13 User Adoption Metrics to Track Product Stickiness

Confused by user adoption metrics? Stop chasing vanity numbers and discover the pivotal indicators that unlock actionable insights and ignite long-term engagement.
This guide covers:
- 13 adoption metrics to track
- Formula to calculate each metric and examples that demonstrate how it’s done
- Different ways to measure product adoption with Userpilot
TL;DR
- A product adoption metric is a key performance indicator (KPI) that tells how well users successfully embrace and integrate your product, feature, or process into their routine.
- Benefits of tracking user adoption: measuring product and user adoption helps you understand product effectiveness, identify areas for improvement, and find ways to build a user-centric product roadmap.
13 product adoption metrics to track
- Time to value
- Product activation rate
- Free to paid conversion rate
- Average session duration
- Average usage frequency
- Product stickiness
- Number of active users
- Product adoption rate
- Feature adoption rate
- Customer retention rate
- Customer satisfaction score
- Net Promoter Score
- Customer lifetime value
- Userpilot offers product growth tools to improve user adoption such as funnel analysis, trend analysis, feature and event tracking, retention cohort analysis, and product adoption dashboards. Book a demo now to start tracking and improving your product adoption metrics.
Try Userpilot and Take Your Product Growth to the Next Level

What is an adoption metric?
An adoption metric is a key performance indicator (KPI) that tells how well users successfully embrace and integrate your product, feature, or process into their routine. There are several adoption metrics you can track, each focusing on a different aspect of user engagement.
Why measure product adoption metrics?
Tracking your most important product adoption metrics helps you in multiple ways. Let’s explore.
- Keep tabs on user engagement: Metrics like active users, feature adoption, and session duration give you a clear picture of user engagement. By understanding the patterns in customer behavior, you can gain insights to fine-tune your onboarding experience, offer targeted support, and, ultimately, keep users coming back for more.
- Remove friction and improve the user experience: Track engagement patterns over time to spot areas with low interactions and then dig further to find and address the root cause.
- Build a user-centric product roadmap: Since product adoption metrics provide real, data-driven insights into how users interact with various aspects of your tool, take advantage of them to inform important changes in your product development pipeline. This approach ensures your product aligns with user expectations and market demands—meaning your marketing and sales efforts won’t go to waste.
13 adoption metrics to measure user engagement
Combine the following user adoption metrics to gain a comprehensive understanding of user engagement and adoption.
1. Time to value (TTV)
This metric measures the time it takes new users to experience your product’s core value after they start using it. A short time to value leads to faster adoption rates and contributes to long-term retention. To measure TTV, use analytics tools to track the time from initial engagement (such as sign-up) to the point where the user reaches a significant product usage milestone that demonstrates value realization.
2. Product activation rate
The product activation rate measures the percentage of users who reach a critical engagement point with your SaaS, known as the “activation point.” This point is typically a specific action or set of actions within your product that indicates the user is obtaining meaningful value.
To calculate, divide the number of users who reach your activation milestone by the total number of new users within that period and multiply by 100. For example, if 1200 new users sign up during a specific timeframe, and 600 of them reach the activation milestone, you would have a 50% activation rate.
3. Free to paid conversion rate
This metric is particularly relevant for SaaS businesses operating on a freemium model. It indicates the proportion of users who start with a free version of the product and then upgrade to a paid subscription.
To calculate the free-to-paid conversion rate, divide the number of users who upgraded to a paid version by the total number of users who started with the free version. Multiply by 100 to get the percentage.
For example, let’s say you had 500 users sign up for a free trial, and out of those, 200 users decided to upgrade to the paid version in a given period. Your free-to-paid conversion rate is 40%.
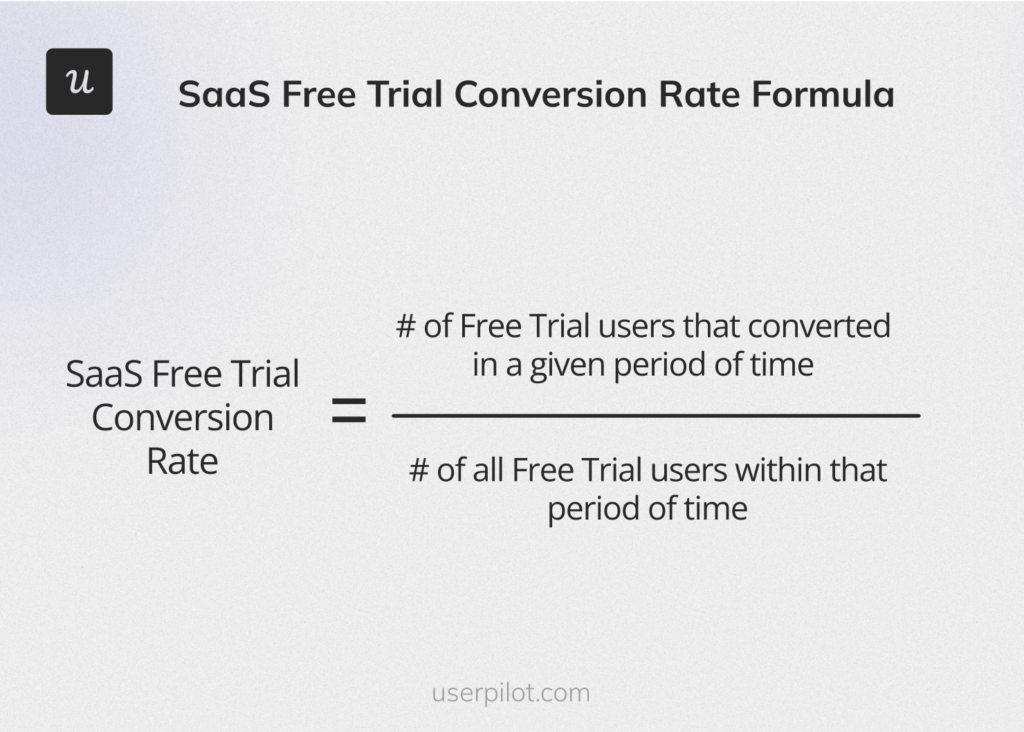
Formula to calculate free-to-paid conversion rate.
4. Average session duration
The average session duration is a measure of the average length of time users spend interacting with your product in a single session. Longer session durations typically imply that users find the product engaging and useful, which can be a positive sign of product adoption and satisfaction.
To calculate this metric, divide the total duration of all sessions (usually in minutes or seconds) by the total number of sessions over a specific period. For example, if users spend a total of 1500 minutes in 50 sessions, the ASD would be 30 minutes per session.
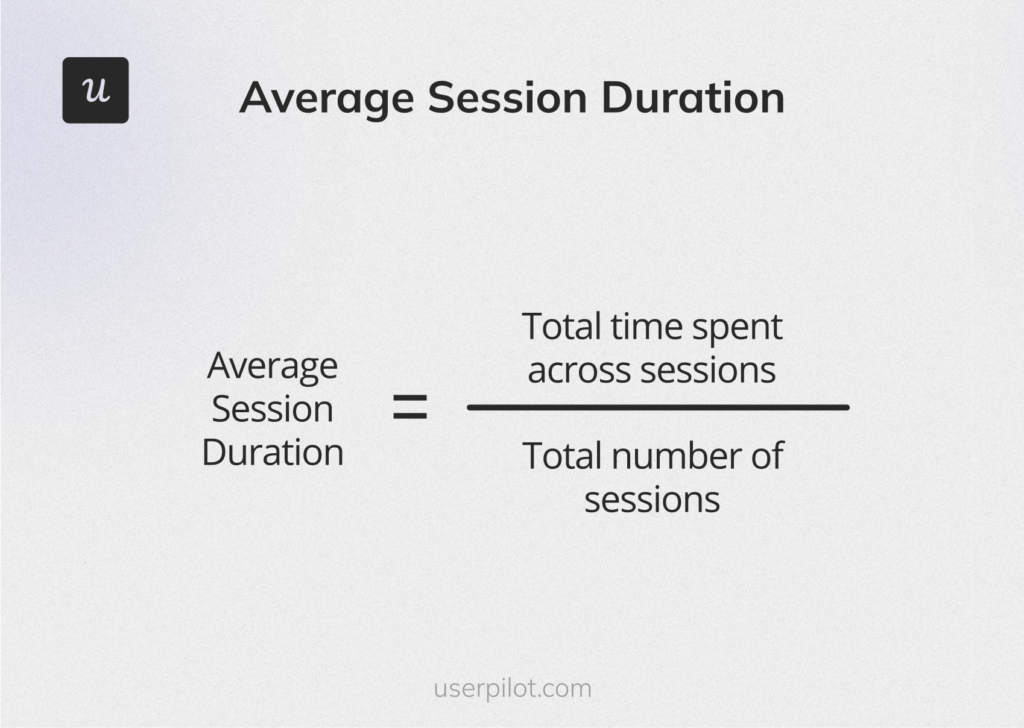
Formula to calculate the average session duration.
5. Average usage frequency
This metric quantifies how often users interact with your product over a given period, such as daily, weekly, or monthly. It provides valuable insights into user behavior and the product’s role in their daily life.
A high average usage frequency is a strong indicator of user adoption, implying that users perceive the product as valuable and have integrated it into their regular routine.
Begin tracking your usage frequency after users complete the initial onboarding flow. To calculate, divide the total number of user sessions by the total number of unique users in the same period. For example, if your tool records 10,000 user sessions in a month and has 2,000 unique users, the average product usage frequency is 5, indicating that each user, on average, used the app five times in that month.
6. Product stickiness
This metric tracks your ability to retain users for an extended period. A sticky product is highly engaging and has users visiting on a consistent basis—which is proof that your features are valuable.
Calculate product stickiness by dividing the number of Daily Active Users (DAU) by the number of Monthly Active Users (MAU) and multiplying the result by 100 to get a percentage. For instance, if your tool has 200 daily active users and 1,000 monthly active users, the product stickiness would be 20%.
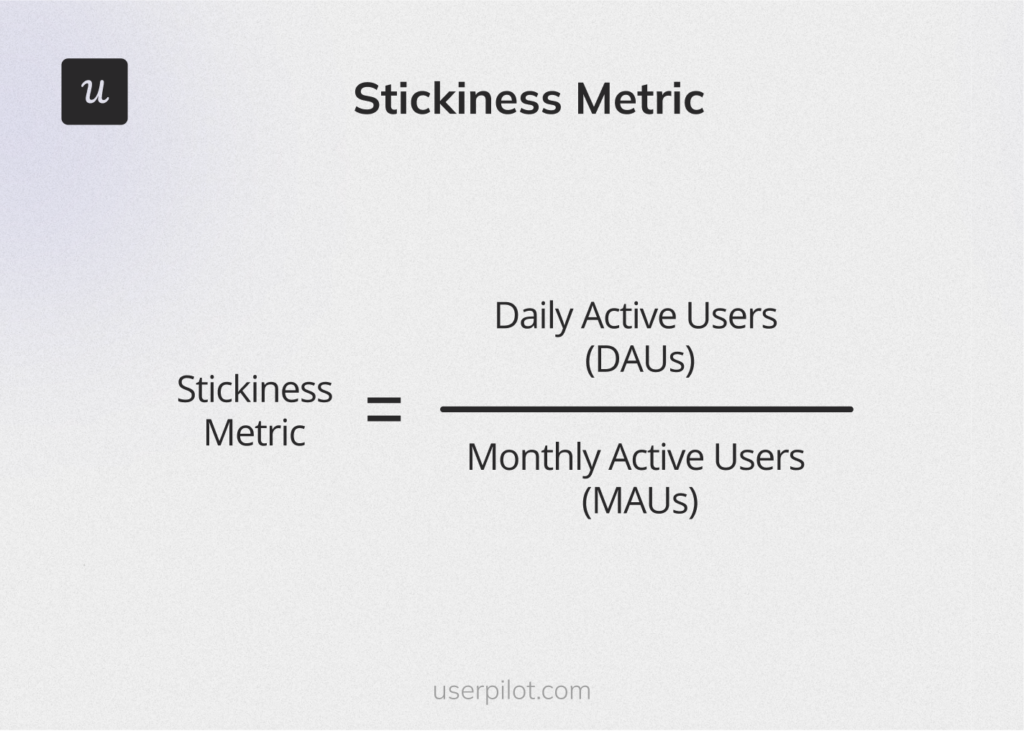
Formula for product stickiness.
7. Number of active users
This is a direct metric that counts how many users interact with your product within a certain timeframe, often categorized into Daily Active Users (DAU) and Monthly Active Users (MAU).
To be sure we’re on the same page, let’s briefly define both terms:
- DAU refers to the number of unique users who engage with your product within a 24-hour window.
- MAU is the number of unique users who engage with your product within a 30-day window.
Notice the emphasis on ‘unique.’ Even if a user logs in multiple times within a 24-hour period (or within a 30-day period for MAU), they’re still counted only once for that timeframe. This approach provides a more accurate representation of your product’s reach and engagement levels.
8. Product adoption rate
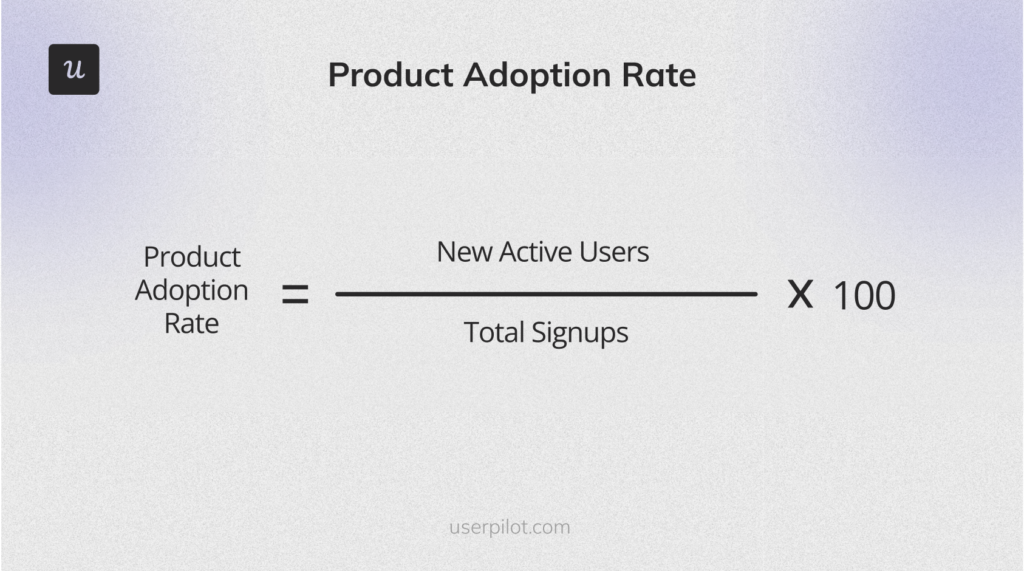
This metric measures the percentage of users who adopted your product within a specific timeframe. Generally, a good product adoption rate shows your onboarding is effective and users find your product valuable.
To calculate, divide the total number of new active users by the total sign-ups and multiply by 100. For example, if 400 users signed up to your tool in the previous month and only 200 are active, your adoption rate is 50%.
9. Feature adoption rate
The feature adoption rate measures the percentage of active users using a specific feature within a defined timeframe. It’s easy to assume you don’t need this metric after measuring the overall product adoption rate; however, combining both user adoption metrics helps you get a clearer picture of customer behavior.
To calculate feature adoption, divide the total monthly users for that feature by the number of user logins in that period. Multiply the result by 100. For example, if you had 400 users for a key feature and 1000 logins in that period, your feature adoption rate is 40%.
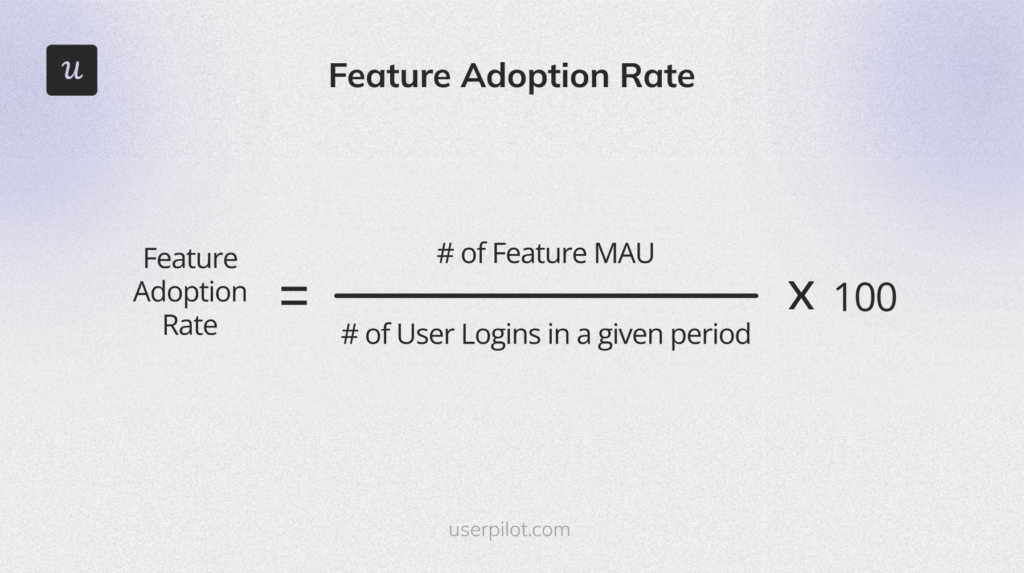
Formula to calculate feature adoption rate.
10. Customer retention rate
This metric measures how many users remain engaged with your product over a specific period.
A consistently high customer retention rate indicates strong user satisfaction and product-market fit. To calculate, subtract the number of users you acquired in a given period from the number of paying users at the end of the period. Divide the result by the total number of users at the beginning of the period and multiply by 100.
Assume you have the following data for a given period:
- 1000 users at the beginning of December
- 200 users acquired in December
- 800 paying users at the end of December
Using the formula, your user retention rate is 60%.
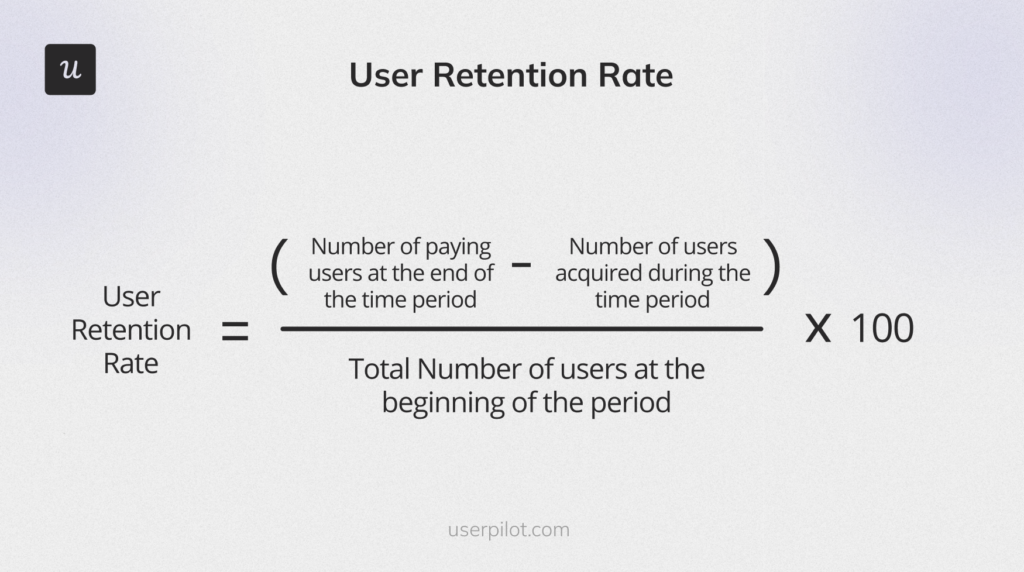
formula for calculating user retention rate.
11. Customer satisfaction score
CSAT score measures customer satisfaction with a specific interaction or experience, and it’s usually obtained through surveys where customers rate their satisfaction on a scale. By consistently measuring customer satisfaction, you can keep track of the user experience and know if users are progressively enjoying your tool or not.
Once you roll out CSAT surveys, calculate the scores by taking the sum of positive responses (usually the top two scores on a scale of 1 to 5 or 1 to 10), and dividing it by the total number of responses. Multiply by 100 to get a percentage. For example, if 70 out of 100 survey respondents give a score of 4 or 5 on a 5-point scale, the CSAT is 70%.
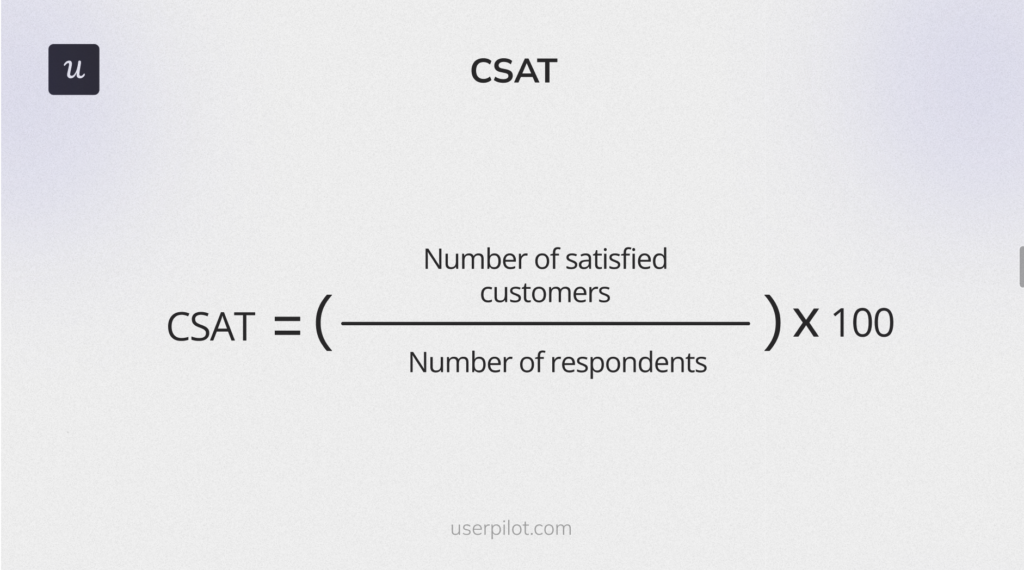
Formula to calculate customer satisfaction score..
12. Net Promoter Score
NPS is a widely used metric to gauge customer sentiment and the likelihood of customers recommending a product or service to others.
Here’s how to interpret the results:
- Promoters: scores 9-10
- Passives: scores 7-8
- Detractors: scores 0-6
Calculate your NPS score by subtracting the percentage of Detractors from the percentage of Promoters. For example, if 40% of respondents are Promoters, 10% are Detractors, and 50% are Passives, the NPS would be 30.
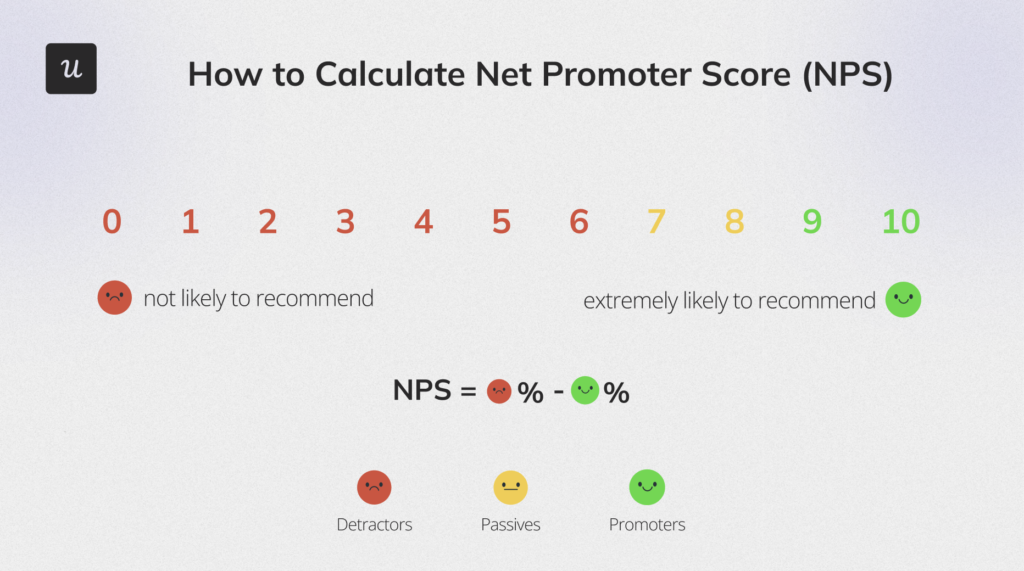
Formula for calculating NPS scores.
13. Customer lifetime value
This product adoption metric measures the total revenue your company can expect from a single customer account throughout their relationship with you. The metric helps you understand the long-term value of maintaining good relationships with customers.
To calculate, multiply the customer value by the average customer lifespan. For example, if a customer’s annual value is $1000 and the average customer lifespan for your tool is 5 years, your CLV is $5000.
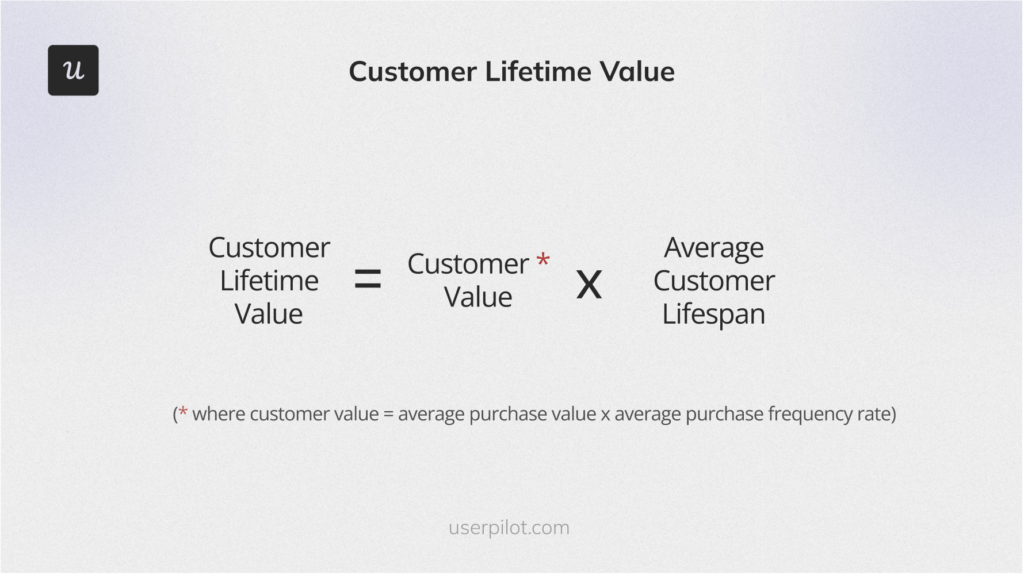
Formula to calculate customer lifetime value.
How to measure product adoption with Userpilot
Userpilot is a SaaS growth platform with features that enable you to track and boost product adoption. Here’s how to maximize Userpilot.
Monitor friction in the onboarding process with funnel analysis
Implement funnel analysis to track multiple user journeys at a time and see how users move through your conversion stages. This will enable you to spot friction and drop-off points in the onboarding process.
By addressing conversion bottlenecks, you’ll increase product adoption and overall user satisfaction.
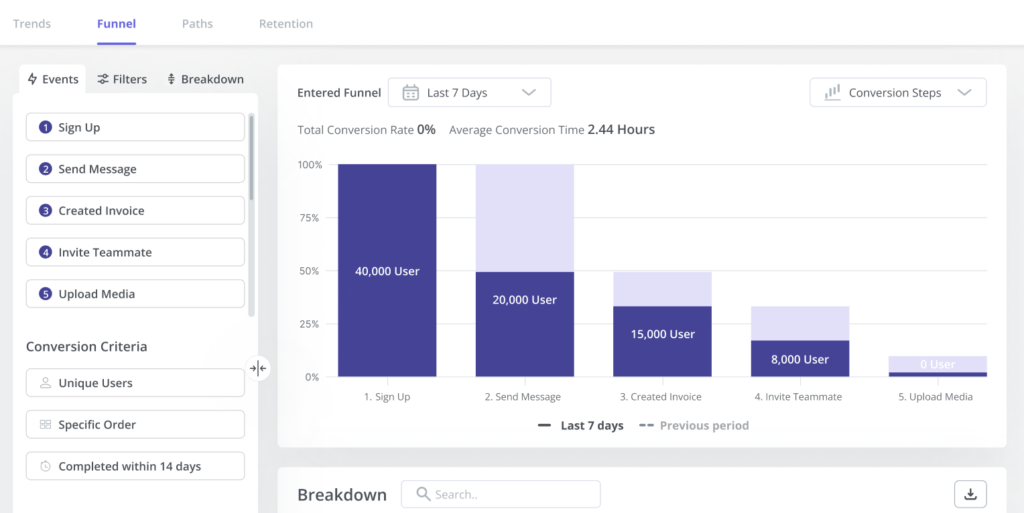
Funnel analysis to spot friction in the onboarding with Userpilot.
Track changing trends and user behavior with trend analysis
Your current adoption rate may look good, but what’s the pattern over time?
Userpilot lets you segment users into different groups based on multiple characteristics and track the changing trends and user preferences for each segment. This allows you to see how users respond to past and current updates, providing insights to increase engagement.
Track feature adoption rate with feature tags
Want to know how your key features are performing?
Userpilot’s feature tagging allows you to measure engagement rates for any product feature of your choice. You can also set custom event tracking and see what percentage of your users complete important milestones.
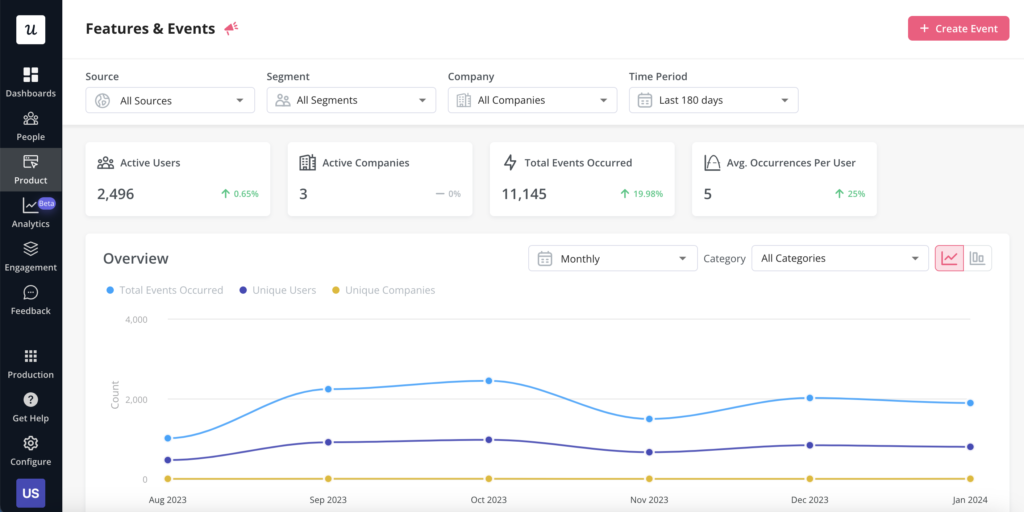
Track and boost feature adoption with Userpilot.
Track retention and product stickiness with retention cohort analysis
With Userpilot, you can define cohorts based on various criteria like signup date, location, feature usage, or any custom property you track. Think of it as slicing your user base into smaller groups with shared characteristics.
Over time, you can view the retention table and see how each cohort’s engagement changes over time, highlighting which groups are sticking around and which ones are churning.
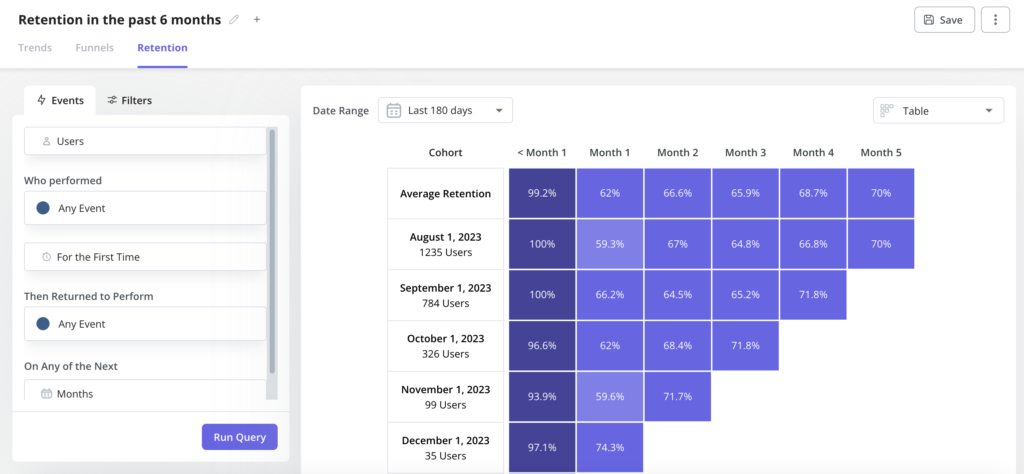
Use cohort analysis to track retention in Userpilot.
View key product adoption metrics at a glance with dashboards
Got several things to track? No need to run different reports every time; just take a glance at your analytics dashboard to view all your valuable metrics in one place.
An analytics dashboard lets you group all your vital adoption metrics and view them in one place. The best part is the dashboard is customizable, so you can choose what metrics to see. Userpilot also lets you filter the results to view the data for different segments and events.
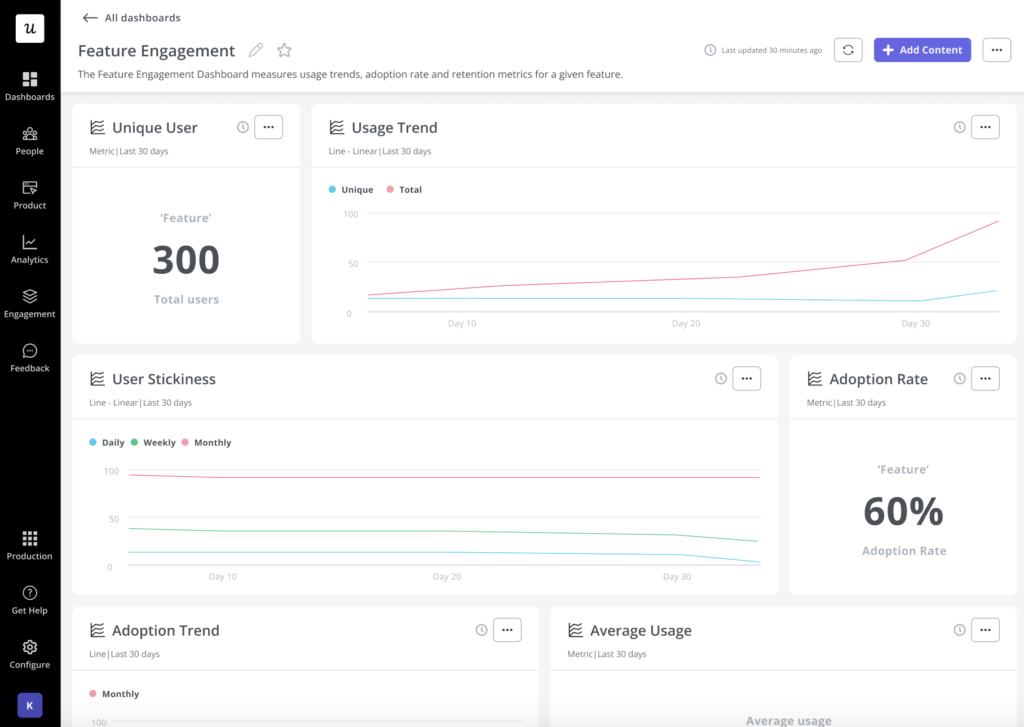
Feature engagement dashboard in Userpilot.
Conclusion
Adoption tracking is an important step in driving growth, but it’s not enough. After collecting user data, it’s important you analyze it and deploy in-app solutions to boost your overall product adoption.
Userpilot can help with both steps. After tracking your important user adoption metrics, you can use Userpilot to trigger in-app flows to educate users and increase their engagement. You can also implement A/B testing when unsure what solutions will work better—or better, still, send in-app surveys to gather direct user opinions. Book a demo now to begin.
Try Userpilot and Take Your Product Growth to the Next Level

