

Uncover more insights about user paths with a new and improved Pathfinder
Available for all Scholarship, Growth, and Enterprise customers
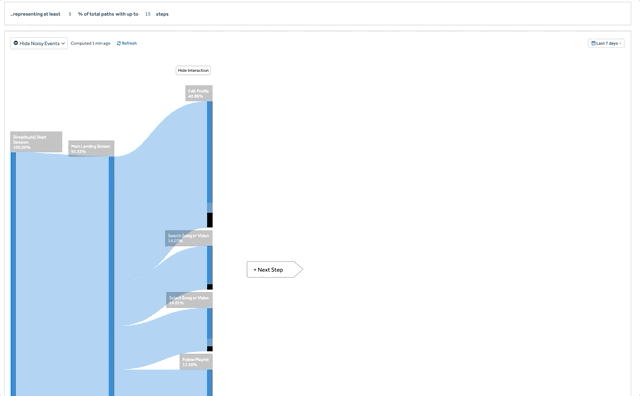
Pathfinder shows you the paths that users take within your product leading up or starting after important product actions. We’ve made several exciting updates to Pathfinder this month!
- Explore up to 15 steps: Now you can uncover more meaningful insights about your user paths. Previously, you could explore Pathfinder up to 5 nodes — now you can view up to 15 for a deeper, more granular path analysis.
- Expand multiple events by a property: A property-heavy analytics implementation may have impacted the value you’ve gotten from Pathfinder in the past—for example, seeing a bunch of generic events like ‘View Page’ wouldn’t have been useful. In the past, customers could only expand a single event type by a single property to get a more granular look at that path. Now, customers can expand any number of events by any number of properties to see the exact paths that matter to them.
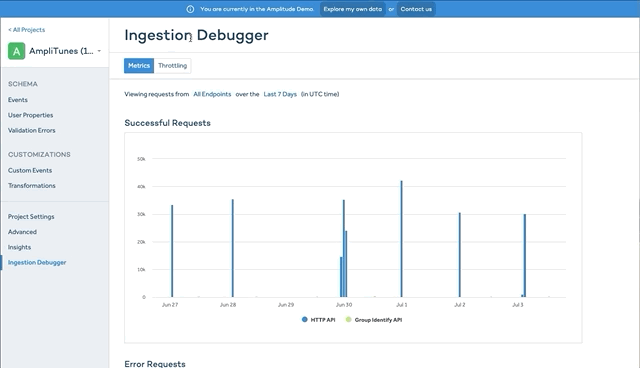
Get more visibility into your data ingestion with Ingestion Debugger
Available for all Scholarship, Growth, and Enterprise customers
Now there’s an easy way to know how much data Amplitude is receiving from your SDK, servers, or CDP. The Ingestion Debugger exposes metrics on successful/failed requests that Amplitude is receiving, as well as throttling and silencing information to give customers the visibility into what Amplitude is seeing from them.
You can find the Ingestion Debugger view under ‘Manage Data.’
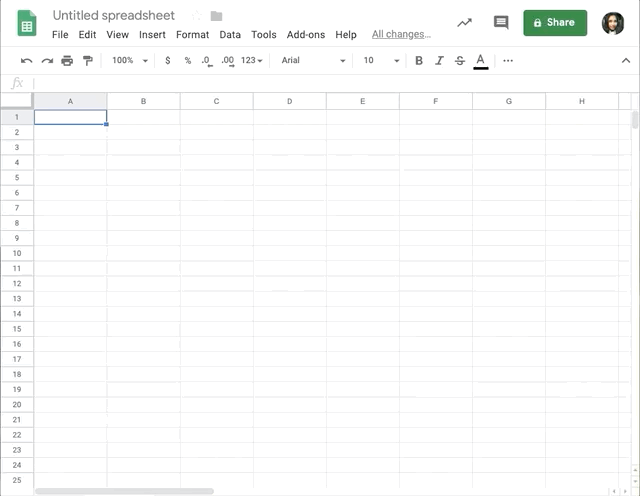
Streamline your workflow by syncing Amplitude chart data to Google Sheets and Google Slides
Available for all customers
Do you often export chart data from Amplitude into Google Sheets or Google Slides? You might need a specific tabular view of your chart data in Sheets. Or maybe you use Slides to present charts to your team. To simplify your workflow, we built an Amplitude add-on to Google Sheets and Slides.
Now, you no longer have to manually export chart data into Google Slides or Sheets. Simply install the add-on and connect to your Amplitude account. Then search for the chart, and click ‘Add’ to begin importing the data. Updating the data in Sheets or Slides is as simple as hitting ‘Refresh.’
Get Amplitude – Export to Sheets
Get Amplitude – Export to Slides
Create custom buckets to analyze your Time to Convert charts
Available for all customers
In Funnel Analysis, Time to Convert shows you a distribution of the time it takes for users to complete the steps in your funnel. Previously, we would automatically divide the horizontal axis of this histogram into 25 buckets and set the bin size from 1 sec, 10 sec, 1 min, 10 min, 1 hour, 1 day, 10 days, and 30 days. The minimum and maximum time to convert depended on the conversion window and your chosen time range and the data.
But what if Amplitude’s automatic bucketing doesn’t work for your funnel data? For example, you might want to investigate users who take between 5 min and 10 min to convert. Now, you can define your own maximum and minimum bins, as well as easily customize your bin size.

Bulk transfer ownership of Amplitude inventory
Available for all customers
Did an Amplitude user leave your org? Not to worry. Org admins can now bulk transfer all Amplitude inventory from one person to another active member of the organization. You can find the Bulk Transfer Ownership option in your org settings.

Discover Amplitude’s chart-sharing capabilities more easily
Available for all customers
We have a two UX updates that add clarity, efficiency, and discoverability to our existing sharing capabilities.
- New ‘Share’ dropdown consolidates the Modify Ownership and Create Public Link functionalities under one dropdown.
- Copy Chart Link button makes it explicitly clear that each chart link is unique and may be copied and shared with other Amplitude users.

Add a new chart to a dashboard right from the Save Chart modal
Available for all customers
Another useful UX update: Previously, users were only able to add their newly-saved charts to a Team Space from the Save Chart modal. Users can now select a dashboard to add their new charts to from the Save Chart modal as well.


