
We’re starting off the new year with a fresh visualization, custom query time zones, and increased visibility around customer usage and event volume. In 2021, we’re planning to introduce more self-service features, new types of analysis, and improved visualizations for your results. We’ll continue to update you on changes to Indicative through our monthly Product Updates and using the “What’s New” widget on your Indicative home page. Check out our latest improvements below:
🏃🏾♀️ New Visualization! User Activity Timeline
We made it easier to visualize the timeline of user activity for an individual user. When viewing the timeline for an individual user, you can view a sessionized list of events and also a visualization of the user’s engagement over time. Learn More!
🕑Query Time Zones
Analyzing a global product? Have an international team? Customers can now specify a time zone for each query to reflect localized results. The time zone selector is located in the top right corner of the query builder within each tool.
⚠️ Monthly Event Usage in Billing
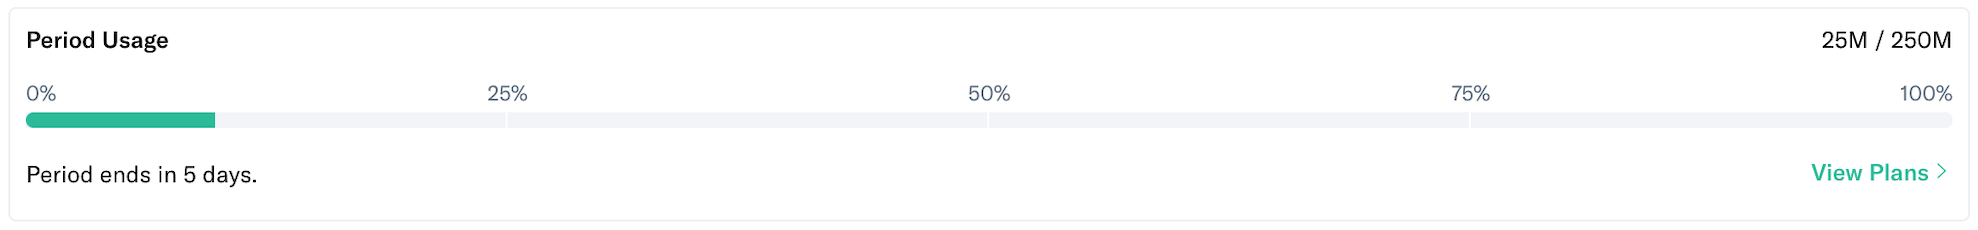
No surprises! We’re making it easier to understand your event usage and data volume! Owners and Admins will receive automated email updates when their organization reaches 80%, 90%, 95%, and 100% of their monthly event volume limit. Please note that events processed beyond the limit will incur overage charges. If you would like assistance in reviewing your data model or event schema, or if you have any questions or concerns, please contact support@indicative.com.
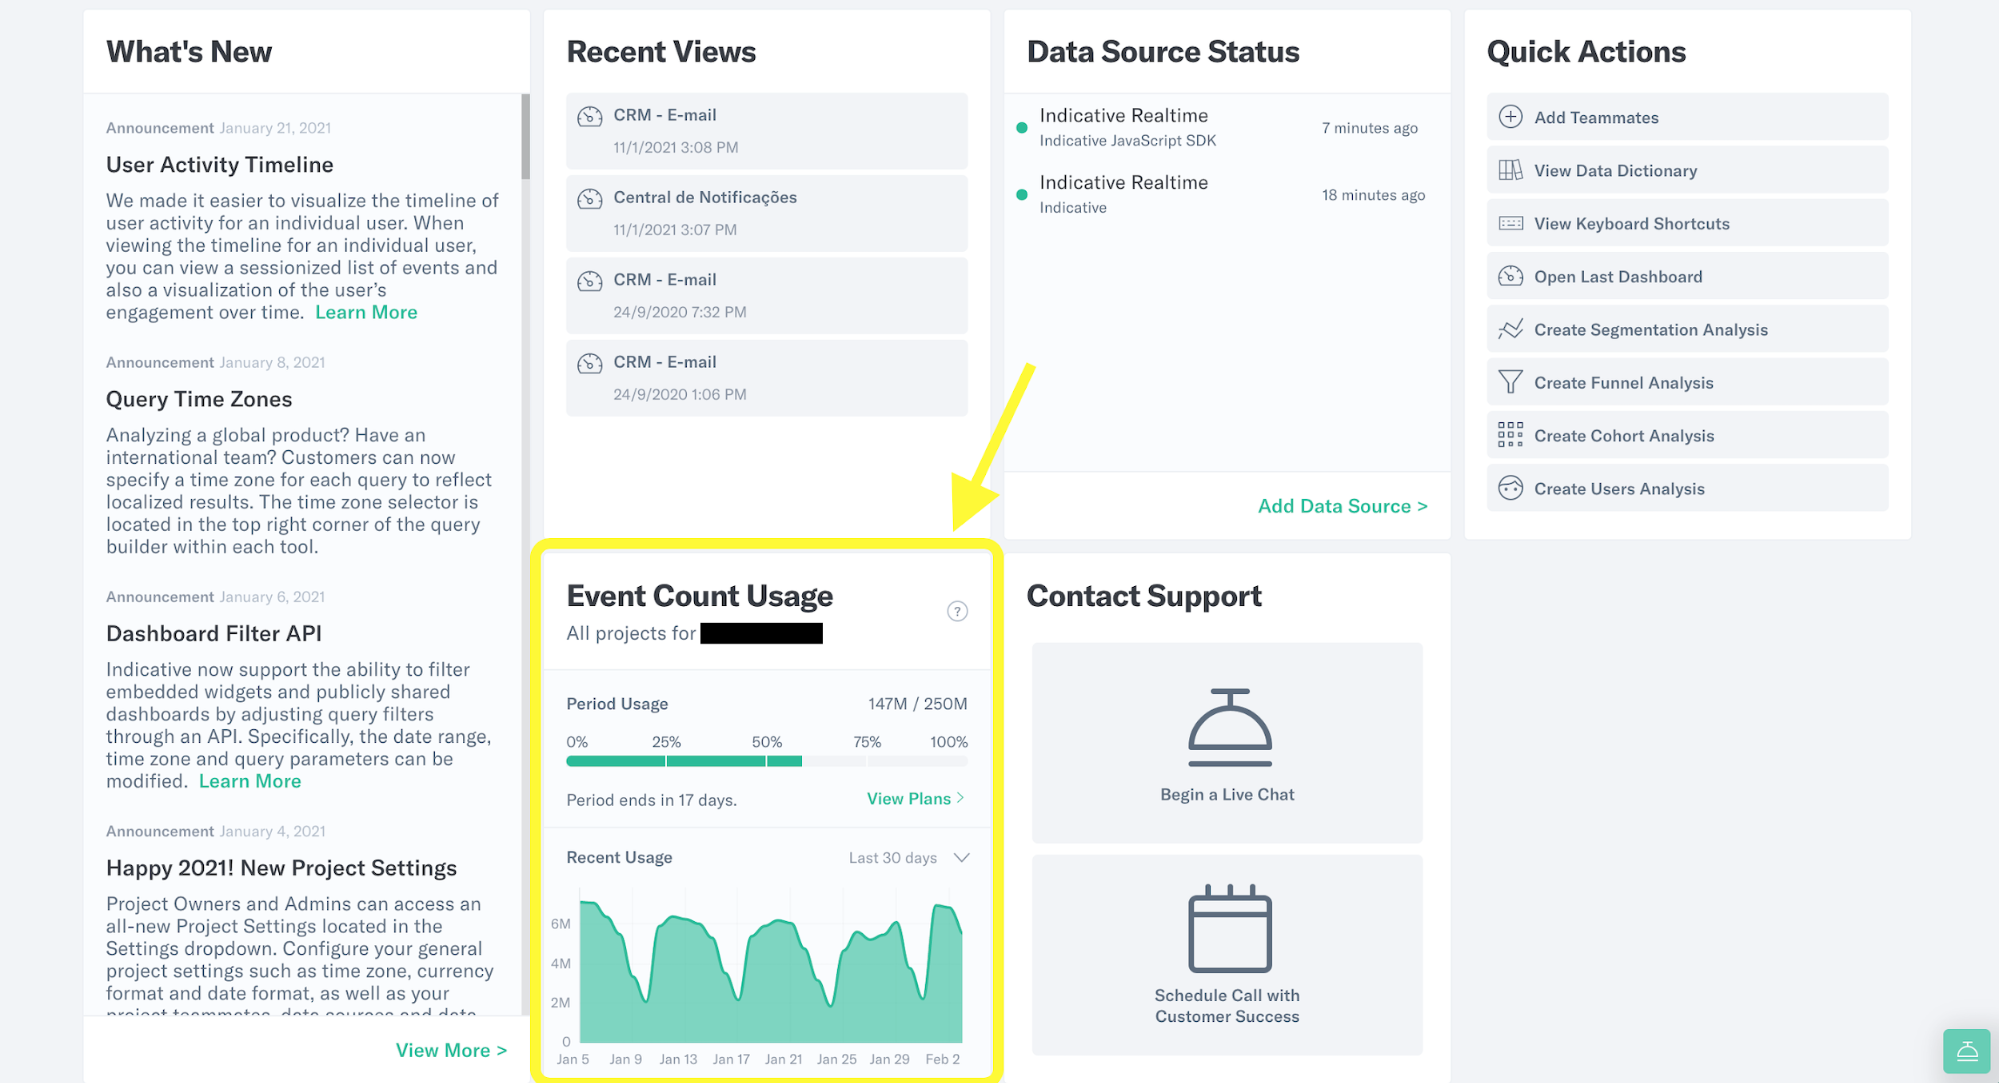
🌡️ Reminder: Owners and Admins can check their monthly event usage on the welcome screen or within Organization Settings >> Billing. Check it out!
We also released some smaller bug fixes and improvements, including:
- Debug Console is hidden for Data Warehouse integrations
- Frontend code refactoring for improved load times and performance
Try out these exciting new features by exploring our Public Demo or logging into your account today! As you know, we love customer feedback. You can help us improve our tools by sharing your thoughts here or by contacting us using the Get Help button in the lower right corner of your browser.
Thank you and happy analyzing!

 Indicative Team

