
February is the year’s shortest month, yet the builders at Indicative continue to churn out new features, additions, and bug fixes. Indicative remains a leader in product analytics for your data warehouse. This month we rolled out new data sources, data destinations, while continuing to add new functionality to the product. Check out the February product additions below:
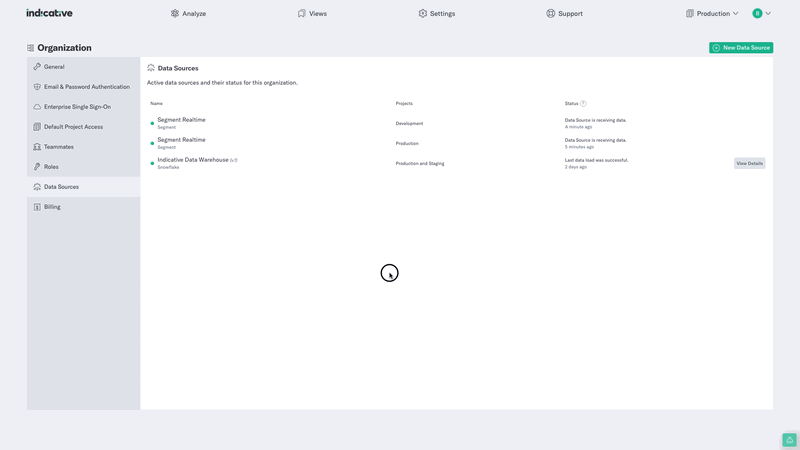
🏠 Data Warehouse Details
In a continuous effort towards data transparency, Data Warehouse customers can now view their Data Source Details. Data Source Details contains information regarding your data source location, enrichments, and data modeling. Check it out!
🆕 Snowplow Snowflake Data Source
Even more ways to send your data to Indicative! In October, we proudly announced a new integration with Snowflake. Now, we welcome Snowplow via Snowflake customers to send their data to Indicative for fast, user-friendly customer analytics. If you’d like to learn more about connecting Indicative to your Snowplow Snowflake data, contact our Sales team today!
⚡ Real-Time BigQuery Exports
Indicative strongly believes that their customers should have unrestricted access to their own data. To this end, Enterprise users may now export their raw Indicative data to BigQuery in real-time. To set up BigQuery exports in real-time, contact our Support team!
❄ Snowflake Integration Improvements
In October, Indicative announced an integration with Snowflake. Since then, we have been tinkering and tweaking this integration to best serve our new customers. Additionally, Indicative is now able to perform access validation for new Snowflake integrations. Snowflake customers can now integrate with Indicative, easier than ever before. Set it up!
We also released some smaller bug fixes and improvement, including:
- Tooltip improvements across all tables and charts
- Free customers can too download their Events & Properties as a CSV
- Decimal precision removed when analyzing user counts
Try out these exciting new features by exploring our Public Demo or logging into your account today! As you know, we love customer feedback. You can help us improve our tools by sharing your thoughts here or by contacting us using the Get Help button in the lower right corner of your browser.
Thank you and happy analyzing!

 Indicative Team

