

This post was co-authored by Lisa Ashcraft.
In 2018, the average company spent $343,000 on SaaS.
In this same report, it was also determined that the average business employee uses eight different SaaS tools to do their daily operations. Who are the people that most directly make these systems work every day to drive our businesses? Admins, of course. But who are the administrators of today? What’s their story?
In this blog—part one of a three-part series—we’ll take a look at this important user group, discuss how this ecosystem of SaaS tools has created admin archetypes and provide you with some tools to successfully manage the right metrics to improve those admin relationships. For those who don’t know, this is easily one of the most overlooked topics that can have the biggest impact on your business. If your admins struggle, your account relationships will struggle as a result.
Gainsight PX can help make admins into all-stars.Read these 5 tips by an admin for admins!
So buckle up as we debunk some myths and learn more about how to track success in you admin relationships.
The four types of admins
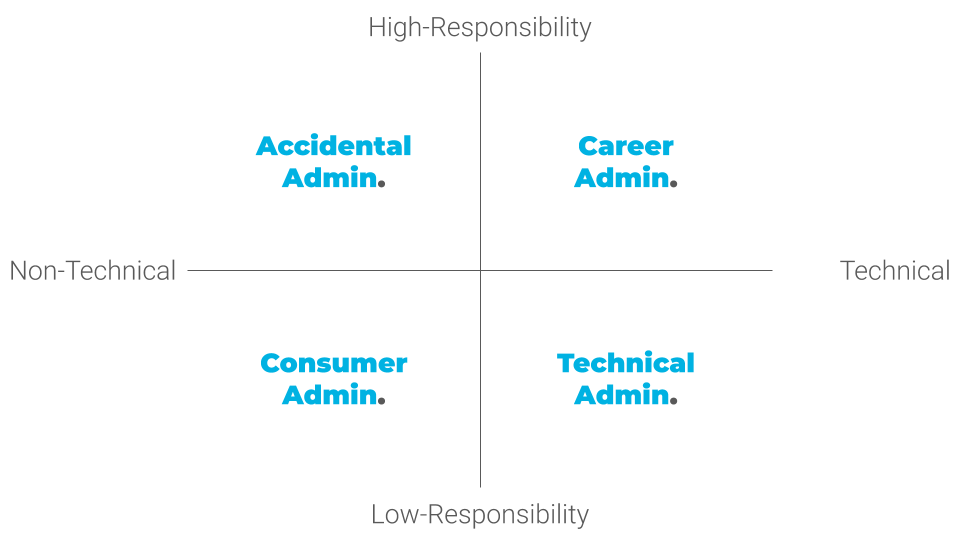
The first myth we need to bust is one we know is true, but we don’t always act like it—there’s more than one type of admin. In fact, there’s a spectrum. But in the landscape of SaaS admins there four main archetypes we can identify:
- The Accidental Admin
- The Career Admin
- The Technical Admin
- The Consumer Admin
If you plotted these on a grid, you could fall anywhere on the spectrum, but this will help us start to make cohorts. What differentiates each type of admin is the ratio of work or effort to the rest of their work responsibilities as well as the other user group populations.
So how do you know what type of admin you’re engaging? Here are some questions to ask your admins.
- Are they responsible for the outcomes using your product?
- Do they have other daily responsibilities besides admining your product?
- How technical are their objectives?
- How much do they want to be in control?
These are all questions that not only help identify the admin, but also help get to the root of developing empathy for your admins. Building on this archetype framework, we wanted to introduce some new metrics most companies aren’t tracking to address admins in general before breaking down each of the admin architypes (which we’ll do in part 2 and 3 of this series—stay tuned!).
Regardless of the archetype, most companies don’t have as many sophisticated behavioral metrics at the admin-level as they do at the end-user and account-level. If any are in place, they’re most often tracked in the onboarding stage or the first 90 days. This isn’t by chance—a lot of companies don’t have the architecture in place to track usage at the user-level, whether purposely for security reasons or simply because of technical limitations. If you do not have user-level insights, it will be harder to quantify the impact of the admin and gain visibility into their experience. For this reason, the first step to improving your admin relationships is gaining as much user-level visibility into usage as possible—and if not usage, then engagement.
In chess, the King (or in business, the decision maker) is the most important piece for winning or losing. But the skill pieces like the Rooks, Knights, and Bishops are more critical for your offensive and defensive strategy. The admins are one of these skill pieces. They are the ones you can directly impact the most to drive offensive and defensive plays within an account management strategy.
Two admin metrics that aren’t useful
So how do you track the effectiveness of your strategy? First let’s debunk two common metrics that aren’t very useful:
1. Admin Logins/Page Views
This metric is poor because it doesn’t capture intent. Page Views across the board is one of the worst metrics you can build a business around. What pages people view aren’t nearly as important as what they do on those pages. It’s better to track actions taken on pages than just to look at what pages are viewed. Companies that rely on this metric struggle to find the relationship between what people are logging in for and what outcomes they are achieving.
2. Admin Time Spent
Similar to Page Views, purely looking at time spent incorrectly simplifies how admins work. Usually admins keep configuration tabs open for prolonged time period as they architect, troubleshoot and build out configuration settings. A better way to quantify time spent is to track the actions taken over time. Companies who build around this metric struggle to find correlations beyond basic insights like “ Too much time bad, Too little time good”. If it is hard to get your team to remove this metric completely another alternative would be to look at time on task. Imagine where the admin cannot even perform the task in your system and has to call in or wait on an internal process to get something done… the time on task for that action would be enormous and be costly for both them and you to do.
Three admin metrics you should be tracking
Now that we’ve debunked two of the most commonly used metrics to define success for admins, let’s talk about three new metrics we should all use:
1. Admin-Related Entity Creation
This is the amount of features, rules, or items configured in the tool by the admin. The idea here is to value the outputs of the effort regardless of logins and time spent. If we use Gainsight as an example, the questions would be:
- Are admins creating Rules?
- Are admins setting up Playbooks
- Are admins building Reports and Dashboards?
You can see how this can correct for admins who are creating tons of value but not spending a lot of time or logging in often—or vice versa. However, it’s not very strong when used in isolation. This metric is more powerful when used in conjunction with the next metric will will introduce: Entity Consumption.
2. Non-Admin Entity Consumption
This metric can be calculated by comparing the amount of entities that have been built by the admin vs. consumed by other non-admin users. This metric is key for evaluating the effectiveness of the admin’s actions. It’s important to look at this by role as well. Most of the issues that can occur with role misalignment can be traced back here. For example, maybe you have a Business Intelligence tool being used, but none of the data integrated by the admin or any of the sources have been used in any reports. Chances are, regardless of how much time the admin spends in the platform or logs in, they are not being effective. Even if those reports have been built and very few have been reviewed by the end-users, that tool would not have any impact and would be at risk of churn due to the ineffectiveness of the admin’s activities.
3. Admin Conversion Rate
Now that we have metrics that help understand effort and effectiveness, we want to be able to view these other metrics with context. Are they doing the right things? You can calculate this metric finding out of all of the admin workflows that can be completed in the tool, how many have been completed by the admin to date? For example, if you have a CRM tool, one conversion might be creating a report. Another would be building an object or adding users. Where entity creation tracks these things being created, this metric tracks the number of workflows required to create, edit, and delete the various entity types within the platform. You should be using this metric to tell what types of activities the admins are doing. Are they spending most of their effort creating rules, building reports, or editing them? These all could be indicators of either healthy or unhealthy use. One of the important keys here is to align conversions to high-value tasks. These may or may not include actual usage in the platform. Here are a few examples of what we mean:
- Admin has enabled highest level of authentication possible.
- Admin has sent the highest amount of license invites (e.g. license send vs. acceptance).
- Admin has accessed enablement services.
A best practice is to build conversion measures across as many of the usage data types available for your admin. Check out this primary data source types blog to learn more.
Okay, so now we know that there are different types of admins, and we need to understand them on a spectrum. We’ve also looked at effective and ineffective metrics, but you’re probably wondering how you can enable improvement among each different admin archetype. We’re going to answer that question in parts two and three of this series, so definitely subscribe to this content using the form at the bottom of the page. You can also contact us directly with any questions you have here, or just leave a comment below and we’ll answer it!