
![Stop Using the Wrong Product Metrics: Unlocking Business Value [Part 2] Image](https://www.gainsight.com/wp-content/uploads/2019/07/stop-using-the-wrong-product-metrics-part-two-product-metrics-product-experience-gainsight-px.png)

This article is Part 2 in a two-part series that will help your product team find the right metrics to improve and demonstrate business impact. Read Part 1 (Stop Using the Wrong Product Metrics: Valuable Metrics Framework) here.
In my previous article, I discussed why product metrics sometimes don’t deliver business value, and I discussed best practices for driving business value as a product manager through a flexible framework of product metrics.
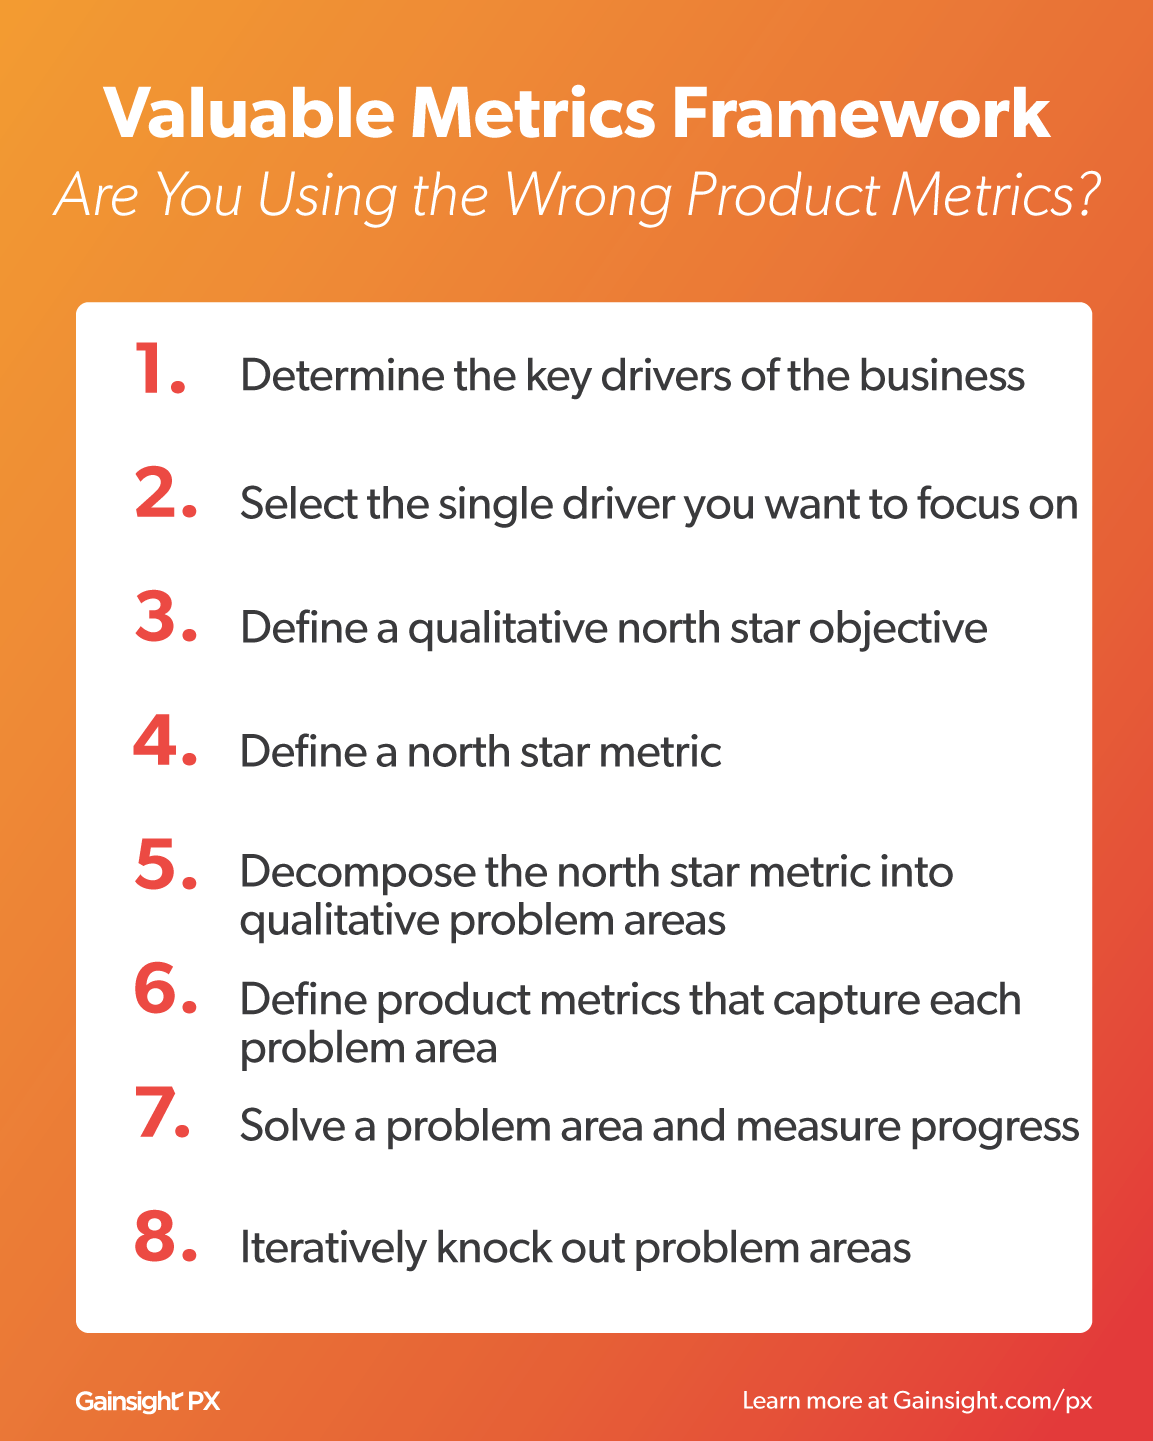
To recap, the framework has the following eight components:
- Determine the key drivers of the business
- Select the single driver you want to focus on
- Define a qualitative north star objective
- Define a north star metric
- Decompose the north star metric into qualitative problem areas
- Define product metrics that capture each problem area
- Solve a problem area and measure progress
- Iteratively knock out problem areas
To bring the framework to life, I’d love to walk you through a real-world example of metrics that I established, how my approach created unique business value, and how I proved the value of my product to my stakeholders.
So, let’s dive in!
1) Determine Key Business Drivers
One of the companies I worked with had three primary business drivers:
- Revenues of the existing business
- Costs of the existing business
- Revenue growth rate of a new business line
How did I determine that these three were the drivers?
I noticed that these three components were the ones that were discussed in every all-hands meeting and in every company strategy meeting.
Even though our executive team did not explicitly state that these three were the key drivers of the business, I noticed through their interactions with the rest of the organization.
Sometimes, you won’t have the opportunity to ask executives directly what they perceive the key drivers to be—and many times, executives may state key drivers for their own department, rather than stating key drivers for the company as a whole.
Be sure to pay attention to the actions and sentiments of your executive team, even if you’re not directly interacting with them. At the end of the day, your executive team is sponsoring your work as a product manager. So, if you don’t have sufficient empathy for their needs, you won’t be able to drive solid impact.
2) Select a Single Driver
As the product manager for the new business line, it was pretty clear to me that I should focus on the revenue growth rate of the new business.
It’s not always that clear. For example, a product manager who worked with the existing business might have to choose between a revenue focus versus a cost focus.
Note that the new business line specifically sought revenue growth rate—not total revenue, not costs, and not total profits.
The reason why we as a business focused on this driver was because we needed to prove to investors that our new business had a future. The way to best demonstrate that was through our month-over-month revenue growth rate.
3) Define the North Star Objective
Given that my business focus was month-over-month revenue growth rate, what qualitative objective could I orient my team and my stakeholders around?
We could capture growth in a couple of ways. We could dominate a market that we already had a presence in, or we could go after new markets.
We decided that our qualitative objective was to penetrate new markets as fast as possible. Our goal was to be ubiquitous—to be present in as many markets as we could and benefit as many customers across geographies as we possible.
After all, a business can’t last if it doesn’t provide customer value. Our new business model would unlock new solutions for unserved customers who were in pain. We wanted to evangelize our solution as quickly as we could so that we could solve these pains that others couldn’t.
4) Define the North Star Metric
We now knew that we wanted to penetrate new markets. What north star metric could we use to reflect such an objective?
We defined penetration as “capturing 0.1% of the transactions within a market,” and we defined a market as “any zip code with greater than 10,000 residents.” Therefore, our north star metric was “number of new markets penetrated per month.”
We could now keep ourselves accountable. We couldn’t declare victory unless we secured a specific number of transactions within a market that was large enough to matter. We also couldn’t declare victory by just doubling down on a single market, because that wouldn’t prove out the virality of our business model.
5) Decompose into Qualitative Problem Areas
To capture a new market, we had to flip business users in a market from using their own process to using our process and technology.
So, we fundamentally needed to convert incumbents to use our product instead, and each converted incumbent would bring us net-new revenue streams.
What sorts of problems did our targeted business users have? Based on the user interviews I conducted, I found that they had the following qualitative pains:
- It’s hard to quickly close transactions in their particular industry because each transaction is unique.
- Leads for this kind of transaction are incredibly expensive because there’s lots of demand for leads, which drives up the cost.
- Leads for this kind of transaction convert at a very poor rate because it’s hard to get a good read on intent-to-transact for these leads.
- The technology that they’ve purchased is clunky, which hinders their ability to focus on the business.
- The technology that they’ve purchased is expensive, which reduces their ability to purchase leads and to hire more people to operationalize.
If I could solve these pains better than our competitors could and better than our customers themselves could, then I could convert them to our platform.
Once I converted a user, I would also capture all of their transactions in the market, which then fed into our north star metric of “number of new markets penetrated per month.”
6) Define Product Metrics for Each Area
Let’s focus on one of the problem areas that I identified:
“It’s hard to quickly close transactions in their particular industry because each transaction is unique.”
Which metrics could we use to determine whether we were fixing the problem?
One potential metric is time-to-close—the number of calendar days it takes from capturing the lead to getting it to close. Another option is fallout rate—how often a lead falls through and never makes it to close.
We could theoretically use other metrics for this problem area as well. Perhaps we could implement a “similarity score”, to try to capture transactions that look similar to one another—with the hypothesis that similar transactions close faster than dissimilar transactions.
The thing to keep in mind is that metrics are a tool for you to measure reality. In other words, the metrics themselves aren’t the reality.
The reality is that it’s hard to close transactions of this type. If we fix the underlying reality and make it easy to close transactions of this type, then just about every metric should improve.
Imagine that I focused only on the similarity score that I proposed. I could theoretically drive a product strategy that ensures that each business user receives only transactions that look similar to each other.
That doesn’t actually solve the underlying reality that these transactions are fundamentally hard to deal with. Even if my metric got better, I wouldn’t have actually delivered true customer value, and therefore I wouldn’t have delivered any business value.
At the end of the day, my team and I focused on time-to-close as the core metric that captured this problem area. I talked it through with stakeholders, and they agreed that it was a valuable proxy of business value. We decided that I would report back on time-to-close on a weekly basis.
7) Solve Problems and Measure Progress
We decided on a problem area metric of time-to-close because it would create customer value, which would then feed into the business value of “number of new markets penetrated per month.”
I quickly found that time-to-close was a difficult measure to work with on its own. That is, I worked in an industry where the average transaction time took anywhere from 30-60 days. If I tried to run any experiments with that kind of lag time, our team’s velocity would be incredibly slow.
Therefore, we broke down this time-to-close problem area metric down into even more granular metrics.
Don’t go with the “best-looking” metrics
We looked at the time in between various stages. We found that the following stages existed for our business users:
- Lead to qualified lead
- Qualified lead to the first in-person meeting
- The first in-person meeting to contract
- Contract to close
Therefore, we measured the time it took from one stage to the next. We also kept an eye on the conversion rate and the volume of each stage—since it doesn’t matter if we can’t get the business to scale.

Again, metrics need to ladder into business value. Don’t move a metric just because you can.
For example, say that I could take on an initiative that would increase the contract-to-close rate from 2% to 3%. Say that I had an alternate initiative I could take on, that would increase the rate of leads-to-qualified leads from 90% to 99%.
While 90% to 99% sounds incredible, it’s only a relative increase of (99 – 90) / 90 = 10%. In other words, I would only increase the business value by 10% by taking on such an initiative.
For the contract-to-close initiative, I would have gained a relative increase of (3 – 2) / 2 = 50%. Given that funnels are multiplicative, it’s worth way more to the business for me to focus on moving the needle on the metric that matters. Even though “moving a metric by 1%” doesn’t sound particularly sexy, that’s what drives actual tangible value.
After analyzing the conversion rates and the times between stages, I found that the bottleneck was the step that converted qualified leads to a first in-person meeting.
Consider both qualitative and quantitative
From there, I shifted out of quantitative mode and back into qualitative mode, and I talked directly with my business users to understand their pain. I asked questions like these:
- What do you hate the most about moving a qualified lead to an in-person meeting?
- Define the ideal qualified lead. Are our qualified leads actually meeting your definition?
- Walk me through the ideal in-person meeting. What’s not happening today to get you to that meeting?
- Walk me through all of the prep you need to do for that meeting. What’s the worst part about prep? How hard is it to actually schedule the meeting?
Remember, metrics are quantitative—they’re powerful for showing you what’s happening.
User interviews are qualitative—they’re powerful for showing you why it’s happening.
Pair your metrics with thoughtful user interviews and you’ll unlock immense business value through the insights that you uncover.
Turning insights into impact
Based on my interviews, I found the problem was that leads were qualified too broadly and that users wanted to reassign these qualified leads to each other because they could specialize.
Some users were stellar at handling one particular subtype of transaction, whereas other users were fantastic at handling a different one. Their inability to reassign to one another meant that they weren’t using their time effectively.
We dove into heavy research to understand how to best reassign qualified leads and how to maximize both collaboration and privacy.
We took two months to develop an in-platform reassignment tool. We measured not just its usage (since that’s a vanity metric!) but also whether we saw higher conversion rates from qualified lead to an in-person meeting.
After this process, qualified leads were no longer the bottleneck!
8) Iteratively Knock Out Problems
After we knocked out the problem around time-to-close, we switched focus to a new problem area: the clunkiness of our business users’ existing tech stack.
We knew our product was only one part of a broader ecosystem. This meant that even if users were succeeding on our product, they could be slowed down by the other products in their stack.
If we didn’t reduce the total pain our users experienced, we couldn’t keep users loyal to us.
Therefore, my next focus was around integration, specifically around email integrations and text message integrations.
These integrations dramatically reduced the time it took to adopt our product, which meant users started getting value out of our product within 14 days of onboarding rather than within 60 days of onboarding.
The Business Value I Unlocked Through Metrics
By doing a couple of iterations of the above, we were able to show the business that our product was accelerating the total velocity of a deal by three days and that we were increasing volume by 8%, translating to millions in net-new revenue for our business users.
Our operations team took the product metrics to market and evangelized our success. Each successfully captured market generated word-of-mouth that made it even easier to capture the next market, and soon we saw our growth rates spike like crazy.
Through the metrics that I implemented and through the iterative product work that my stakeholders and developers tackled, we created a new business line that became larger than our existing business—all within the span of six months.
Summary
The best way to achieve business value is to begin with business value. Remember, your product doesn’t matter unless it creates value for both your customers and for your business!
By using a framework to determine appropriate product metrics, you can ensure you’re prioritizing your time wisely and solving the most impactful problem.
And as a bonus, using this framework will prove the value of your product to your executive team and to your stakeholders!