

Photo by Austin Distel on Unsplash
Prioritization is a critical skill for product managers. Google reports over 12,200,000 results for “product manager prioritization”. Prioritization is a key skill.product managers use for feature selection, tech debt prioritization, sales campaign prioritization, and packaging/pricing decisions to name a few. There are a few fundamental techniques like Pareto analysis that can help support the myriad of product management prioritization frameworks.

What is Pareto Analysis?
Pareto was appointed professor of economics (1893) at the University of Lausanne, where he remained for the rest of his life. In 1906 he made the famous observation that 20% of the population owned 80% of the property in Italy, later generalized by Joseph M. Juran on the Pareto principle (also known as the 80-20 rule ).
From a product management perspective, Pareto analysis translates into 80% of the outcomes are due to 20% of the causes. In other words, focus first on the items that have the most impact. Here’s an example that categorizes customers’ revenue contribution:

As this table indicates, 44% of the customers base accounts for over 90% of the revenues. Conversely, 33% of the customer base accounts for only 1.1% of the revenues. In this case, product managers should focus on the priority needs of the top customers first. Regretfully, the needs of the bottom-tier customers could be safely ignored.
Product managers often get push back on prioritization decisions. Data like this can go a long way to overcoming objections.
Solve Most Impactful Problems First
Pareto can help you identify which problems you should tackle first. Consider the following analysis:
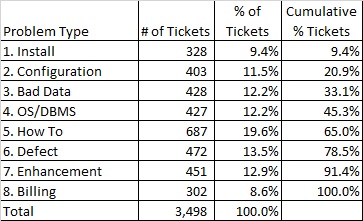
The table shows the frequency of customer support ticket types. Most support organizations track not only major types of problems but subcategories as well. They also typically assign a severity level as well. Severity 0 is system down, severity 1 major function down, etc.
You can further refine this analysis by adding customer revenue tiers:

As the table indicates, the lowest tier customers (<$20K/year) are responsible for the overwhelming majority of the customer support tickets.
When you add in revenue contribution, you can identify which problems should be the highest priority to address:

While the top three tiers only account for 16% of the total tickets, they ae resopnsible for over 90% of the revenue. Resolving the root causes of these customers issues shold be a top priority
Extend Your Analysis to Other Areas
You can leverage Pareto analysis in many ways aside from customer support. Once you have built your base data set you can add in many topics. For example, if you look at customer flux analysis (month to month revenue trends – flat, grow, decline, etc.) you can see some interesting trends:
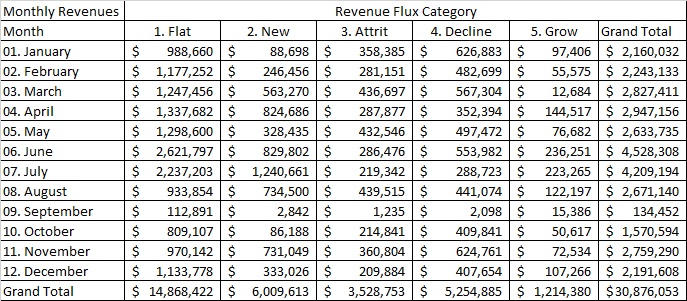
You can focus on one category, attrition, to see what months are the highest:

You can then investigate why these changes are happening Once you build your core data set your are only limited by your imagination.
How Can Product Managers Do This Type of Analysis?
Assemble Base Data
The process begins with assembling some base data. Generally extracts from customer service, sales force automation, and accounting systems are best. Extracts from Agile support systems (Jira, Trello, Rally) can be helpful too.
A challenge you will probably face is that there may not be one common customer identifier across all of the systems you are interested in. You may have to build some type of cross-reference or proxy solution. It is critically important to be able to tie customer billings, sales, customer support, and backlog data together.
Data Augmentation
Once you have your base data you will have to manually augment it. For example, if you have annual customer revenue data, you will need to add the revenue tier the customer fits in. There may be other data categories you want to add. Unfortunately doing it manually is often the best way. If you are an advanced Excel user you can use features like VLOOKUP.Don’t let the prospect of manual data entry put you off. The benefit from a good base data set is worth the investment.
Data Analysis
Once you have your base data squared away you can start your data analysis. Excel pivot tables are a wonderful tool to use. If you are comfortable with SQL and have access to a business intelligence tool (Tableau, SAS, PowerBI) you can use them as well.
Your imagination is the only limit to the types of analyses yuo can develop. It is important, however, that the base data you use is recognized as valid in your company. Many analytical projects have been derailed when a stakeholder objects to the accuracy of the base data.
Automate What You Can
Once you have built a solid set of analyses, try and automate what you can. This should not be a one-time process. You should be able to produce these analyses on a regular basis with current data.
Years ago I ran a large customer service organization for a SaaS company with over 120 people spread out across five locations. Working with an IT Analyst we were able to build a customer scorecard that an agent could pull up on a moment’s notice. It consolidated data from our customer support system (Vantive), our call management system (Avaya), and our accounting system (JD Edwards). Fortunately, we had a common customer identifier across all of these systems.
The scorecard listed the usual customer identification information, a list of the products and services they had purchased, a summary of their tickets organized by problem type and subtype, the average hold times the customer had experienced, the elapsed time to resolve tickets, revenue tiers, service renewal dates, payment history and dozens of other facts. This enabled the customer service agents to understand how important each customer was.
Pareto Analysis is a Great Tool for Product Managers
Pareto analysis is a great tool. You can analyze all types of data like customer billings and customer support tickets. Product managers can focus on what are the most impactful items first. The data can also help them justify priority decisions, especially when the answer is no.