
SaaS Capital finances Software-as-a-Service companies. They lend between $2 million and $12 million to scaling B2B SaaS companies. SaaS Capital publishes great free research focused on private SaaS companies, which is pretty hard to come by. Recently they published the tenth installment of growth metric benchmarks for private SaaS companies. They break out their analysis by revenue tier (<$ 1miilion, $1 to $3 million, etc.) This is very helpful for smaller SaaS startups.
Growth by Annual Recurring Revenue Bucket
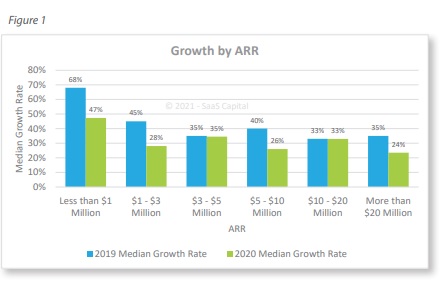
As revenues scale, growth rates decline. This is consistent with public SaaS companies. In comparison to 2019, growth rates slowed in 2020. “While two company groupings performed the same as 2019, the graph shows the clear impact of the global pandemic and economic shock in Q2 of last year. Further, more companies shrank in 2020 than in 2019, as well. Overall, 13% of the companies reported flat or negative growth in 2020, compared to just 2% in 2019.”
When you look at the growth rates of larger private SaaS companies the same trends emerge. Bessemer Ventures recently reported research on their portfolio companies:
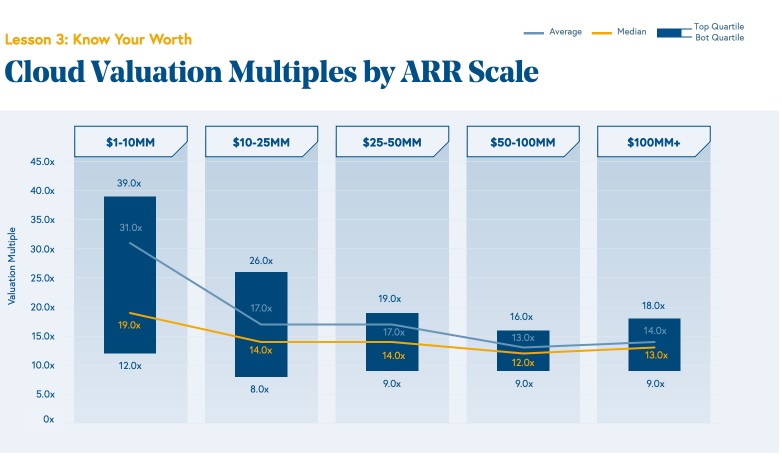
For more information check out Bessemer Ventures Research: Scaling to $100 Million
Quartile Analysis of Private SaaS Company Growth Rates
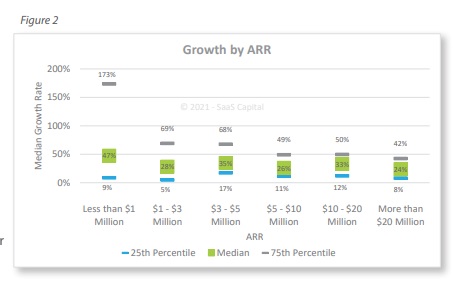
Like public SaaS companies, there is significant variability in growth rates in each revenue bucket. “Figure 2 shows growth rate percentiles by ARR and gives us a better understanding of the ranges of growth rates that exist at each revenue stage. The immediate takeaway is that ‘top quartile performance means different things for different-sized companies. For example, a $2 million SaaS company needs to be growing at more than 69% year-over-year to be in the top 25% of its peers, whereas that bar is 42% for a company with $20 million of ARR.
The chart also highlights the variability seen in earlier stage companies. Part of this is just math: dividing by a small number can return very growth rates. But the other part is truly the variability of early-stage performance. Some companies take longer to develop a product and find their market, while others find terrific product-market-fit early and grow very quickly. As companies grow, they stabilize and grow more consistently and growth rate variance compresses.”
Bootstrapped vs Equity-Backed SaaS Company Growth Rates
There are material differences between SaaS companies that are bootstrapped versus being equity-backed:
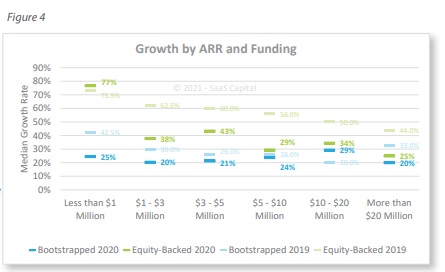
“The data highlights a point about the relative stability of bootstrapped companies versus equity-backed companies. Bootstrapped companies operate at a “steady state” growth rate – the rate that they can grow while remaining cash flow breakeven. Companies that have raised outside equity artificially “juice” their growth rate with operational leverage – they increase spending to increase growth, and presumably, if they decrease spending, growth rates will slow. In our annual survey, we have a question on departmental spending amounts, and data from that question corroborates this. Equity-backed companies started 2020 by spending significantly more on sales and marketing than their bootstrapped peers, 100% more on sales and 57% more on marketing. By the end of the year, the growth spending gap had narrowed to 82% for sales and 43% for marketing”.
Growth Rates and Retention
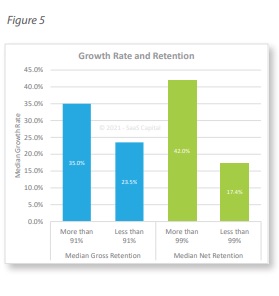
““Companies reporting net retention below the median show growth of 17.4% while companies reporting net retention above the median posted 42.0%. These are significant differences and also a significant departure from the same analysis last year, where the difference in growth rate between the top 50% companies for retention and the bottom 50% was around five percentage points.”
Growth Rate by Company Age
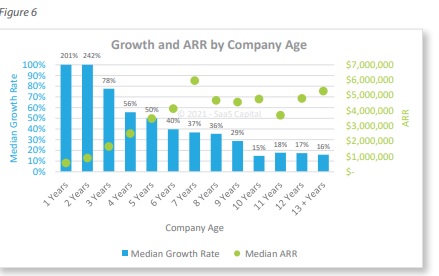
“Historically, company age and revenue have been directly correlated, while company age and growth rates were inversely correlated. As with many things, 2020 appears to have broken the norms. As seen in Figure 6, there are essentially 3 phases as companies age. Startups show very high growth, in part due to small base revenue, as noted throughout the findings above. From year 3 until year 9, growth rates gradually decline as revenue steadily grows. At year 10, growth drops significantly and then remains stable in the mid-teens. Interestingly, total revenue is highest for companies that are 7 years old. This could indicate a SaaS life expectancy of seven years – founders looking to grow the business and then sell, particularly for venturebacked companies. The median age for bootstrapped companies was 10 years old, while the median age for equity-backed companies was 7 years old. Our data also show that 41.1% of bootstrapped companies were older than 12 years, while only 19.5% of equity-backed companies were older than 12 years. This is likely due to pressure from VC fund horizons with the data suggesting 10 to 12 years is the implicit ceiling that entrepreneurs, boards, and investors give themselves to get as big as they can before an exit, regardless of the size and value achieved by that point.”
Summary
ARR growth rates are the largest factor driving private SssS company valuations. SaaS Capital’s long-term research (>10 years) shows some great insights, especially for smaller revenue SaaS companies.
Also published on Medium.