

Chances are you’ve heard the saying, “‘Everyone wants change, just not for them.”
If we’re being honest, we can all agree that the one constant in life is change—yet managing change can be difficult. Will the new thing be better than the old thing? What will I have to relearn or rethink with the new thing? Even if all the parties involved know that the change is overwhelmingly for the better, it can still be tough to manage the process.
More #changeManagement #OrgDev #OrgChange comics – https://t.co/SiPPLeMsFX pic.twitter.com/HYGvR0bKNP
— Torben Rick (@torbenrick) September 18, 2017
Change as seen from a product management operations lens
Change management is one of the core responsibilities of an operations function in business, whether it be IT Operations, Sales Operations, or in my personal case, Product Operations. The product operations function at Gainsight enables the product management team with the tools and processes they need to succeed. We also work cross-functionally with other departments to remove barriers and enable effective communication.
One of our big internal initiatives is our platform evolution, Gainsight NXT. This evolution represents a multi-year effort to upgrade our application and bring more flexibility, speed, and control to our user community. We’re really excited about NXT as it represents a distillation of thousands of points of product feedback and will unlock so many doors for our customers. You can learn more about NXT here.
![]()
As we’ve started deploying new customers on NXT and upgrading existing customers to NXT, some of the big questions that we’ve had to answer have been around usage and adoption of NXT.
We wanted to understand if the adoption and usage of NXT was better, the same, or worse than our legacy Salesforce edition product. We also wanted to know if the usage patterns were the same. Were users finding the same features useful, or were they exploring other areas of the product? And more importantly, what was the week over week retention with NXT? These are not only questions that are being asked internally within our product and engineering organizations but also at the executive level. No pressure, right?!
“PX, please show me the data”
Gainsight PX, our Product Experience Platform, has allowed us to analyze usage data in numerous meaningful ways.
One of the first elements of our analysis was to look at the top 10 pages that were used by customers on Gainsight NXT vs. Gainsight (Salesforce edition). Gainsight PX made it easy to filter by environment type and quickly generate beautiful visualizations that told a compelling story. Both systems shared similar popular pages, but the data revealed that a couple of re-imagined pages in NXT were becoming increasingly popular (see the chart below).
Gainsight PX also allows you to drill down into your data to understand activity and trends at account and user levels. We used this to determine which cohorts were utilizing certain features.
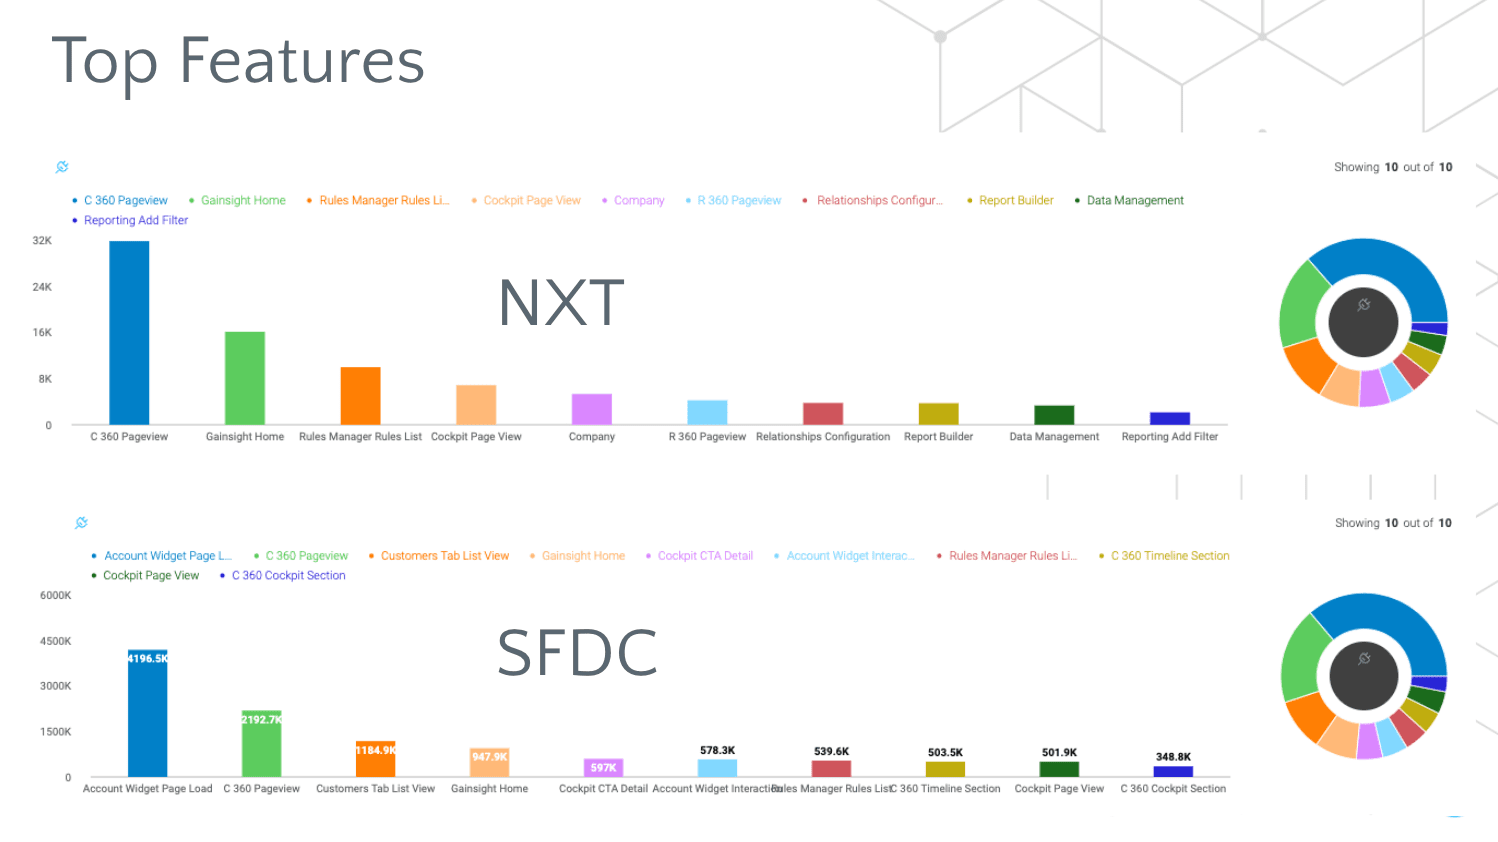
Comparison charts of top features in Gainsight NXT and Gainsight (legacy edition) from data supplied by Gainsight PX
Having a visual comparison of the two systems gave our execs a level of comfort. It confirmed our user community was aligned on how they were using the Gainsight CS product, irrespective of the version they were on.
What about stickiness?
Another important analysis that we did was to measure the retention or “stickiness” of the product experience between our legacy platform and Gainsight NXT. Gainsight PX makes simple work of viewing retention as a whole and sliced and diced.
We wanted to see if new users of Gainsight NXT came back (week after week) at equal or higher levels than the retention we saw within our legacy Salesforce CS product. By creating a filtered cohort group of just NXT users, I was able to show that overall the reception of NXT by new users is better than the customer base measured as a whole. I’m excited to use PX to pressure test some ideas on why that may be the case!
The two charts below are what we used to analyze user retention. Specifically, we wanted to identify a cohort group of new users on a specific week and then see if they came back again in subsequent weeks. The first week will usually be the highest, and the stickier your product is, the higher the week over week “returning users” will be.
The first chart shows the composite analysis of all weekly retained users for the defined time period, while the second chart goes deeper and extracts the individual weekly cohort groups that make up “Week 1”, for example.
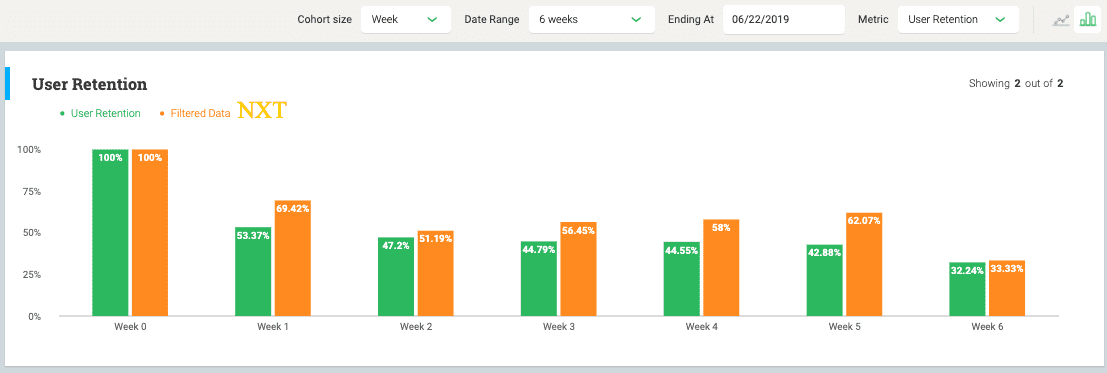
Example of a composite analysis of weekly retained users in Gainsight NXT
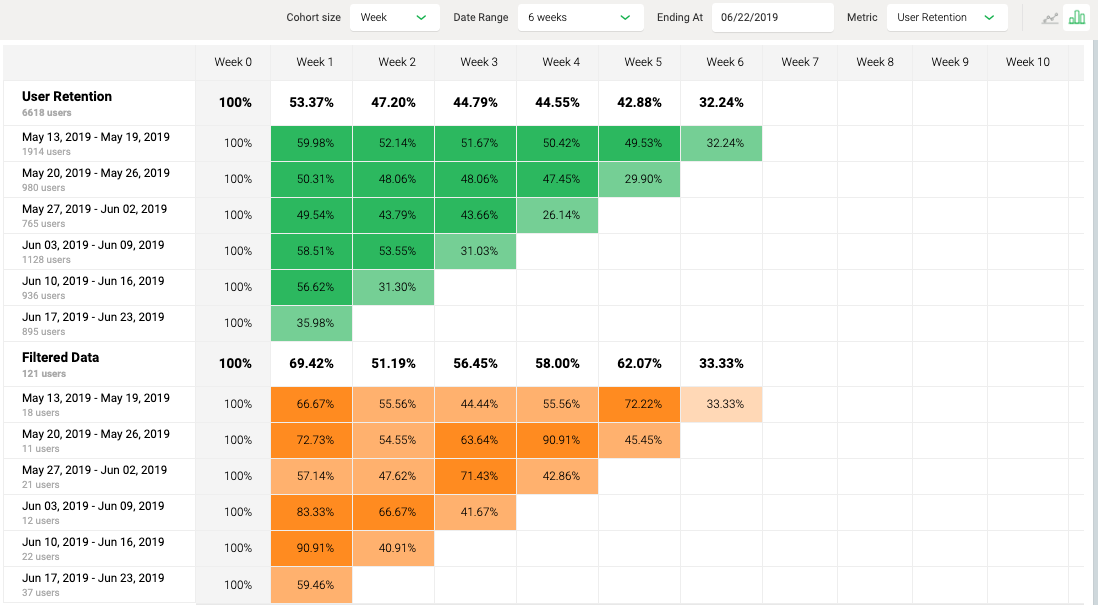
Example of cohort analysis measuring weekly user retention
Answering your product questions with Gainsight PX
Gainsight PX puts the tools at our fingertips to measure and evaluate our success with confidence. It continues to answer some of our biggest and most challenging questions related to change management and product adoption trends. With the data in Gainsight PX, we can also keep our organizational stakeholders up-to-date on the progress of our Gainsight NXT product.
Yes, change can be hard, but when informed and supported with the right data, change can be a lot easier. I mean a LOT easier! After leveraging some of these easy product analytics tools, I feel like trying to run Product Operations without Gainsight PX would be like trying to go surfing without a board. Sure, you could try it, but why wipe out if you don’t have to?