How to use growth accounting to measure product-market fit


Consider a consumer mobile app that sells a monthly subscription to its service. Over the last 12 months, it’s shown stellar revenue growth of ~16% month-over-month for a 12-month period.
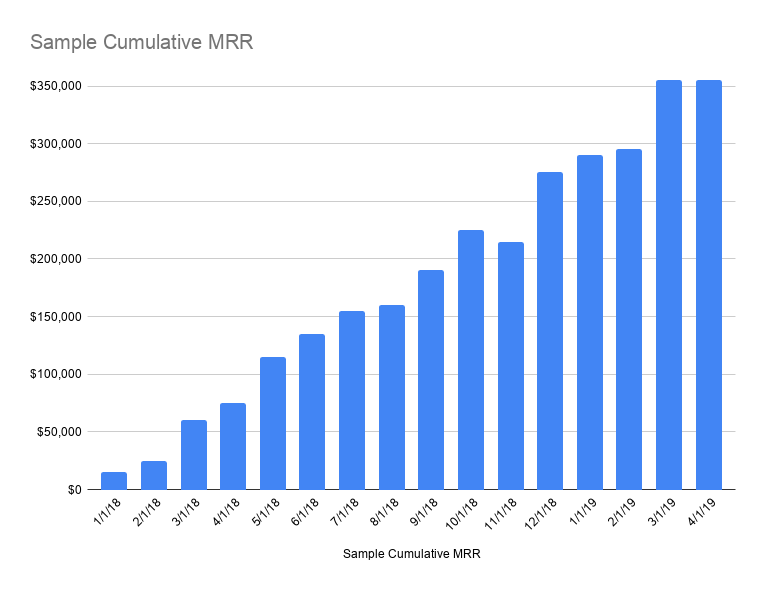
On the surface, the app looks like it has a healthy degree of product-market fit. However, going one level deeper to understand the nature of its growth tells a different story. When we break down the monthly recurring revenue (MRR) into components, we can see that the app has a churn problem.
The app retains only about 40% of its revenue monthly, which means that 60% of its revenue churns every month. Growth looks inefficient because, for every $3 in revenue that the app adds, it loses $2 to $3 to churn. In the near-term, the app can sustain its growth through revenue from new customers who sign up. Over the long term, however, this dynamic portends growth stalling out because while churn scales in proportion to MRR, new customer acquisition typically does not.
At Tribe Capital, our focus is to recognize and amplify early-stage product-market fit. We believe that in order to achieve this goal, we need to have standard quantitative approaches to understanding product-market fit. We want to provide an objective, evidence-oriented understanding of the pattern of product-market fit to everyone on the team so that they can work together on amplifying it.
We have created a framework called “growth accounting” to quantify and analyze growth. Over our collective history of operating and investing, we have exercised and refined this framework hundreds of times across companies in a wide variety of industries, including Facebook, Slack, Front, Carta, and countless others. Growth accounting is one framework among three that we use to understand the health of product-market fit, alongside cohort analysis and concentration analysis.
When teams encounter product challenges like the one posed above, growth accounting can help get everyone on the same page around data that objectively describes the health of their app’s product-market fit. We call this getting to “ground truth,” which means that everyone in the organization is aligned around app performance and where opportunities for improvement are.
This article will explain how we define growth accounting, how we examine a company’s growth rate, and how we break down underlying growth dynamics. We’ll highlight three useful statistics for understanding the quality of a company’s growth and product-market fit, then offer a few examples where we walk through what growth accounting looks like across different businesses.
How to define growth
In the example above, we examine growth within the context of month-over-month revenue measured over a 12-month period. However, we can generalize how we define and measure growth. This allows us to do growth accounting to understand the health of growth for any activity over any timeframe.
Activity
The activity can be anything, though revenue and product engagement are the most common examples because they represent customer activity core to a startup business model. To take a more granular look at customer engagement, you could define the activity as any of the following:
- Photos uploaded
- Messages sent
- Days active in the month
The activity has an associated quantity. For revenue, it’s an ordinal, which is the quantity that the customer pays. For a product-engagement metric like “monthly active users,” the per-customer value is binary — true if the customer uses the product in a given month, false otherwise — which bounds the quantity contributed by the customer as either 0 or 1.
Rate
We measure growth as a rate, which is the ratio of the cumulative quantity at the end of a given period to that quantity at the beginning of the period. Suppose our revenue at the beginning of May is $1,000 and by month’s end it reaches $1,500. That’s a 1.5x increase, which gives a growth rate of 50%.
Growth_rate(t) = revenue(t)/revenue(t-1) – 1
We define growth in terms of rates, not absolute numbers, because it helps us identify something small that can become something large; $500 as an absolute increase in revenue isn’t much over the course of a month, but 50% growth is a large jump, and if that compounds over several years, it can result in an extremely valuable business.
Timeframe
Looking at the growth rate on a monthly basis is typical. Older businesses may also want to look at yearly growth rates. Very early-stage businesses may want to focus on weekly growth rates.
Because growth rates can be volatile, we don’t only look at growth rates from the last month to this month. Instead, we look at three numbers — CMGR3, CMGR6, and CMGR12 — that track the compound monthly growth rate of revenue for the trailing three, six, and twelve months respectively.
For example, the compounding monthly growth rate at month t for the trailing three months would be calculated as follows:
CMGR3(t) = (revenue(t)/revenue(t-3))^(1/3) – 1
The example below is generated data for a fictional product whose monthly revenue is graphed alongside CMGR3, CMGR6, and CMGR12.
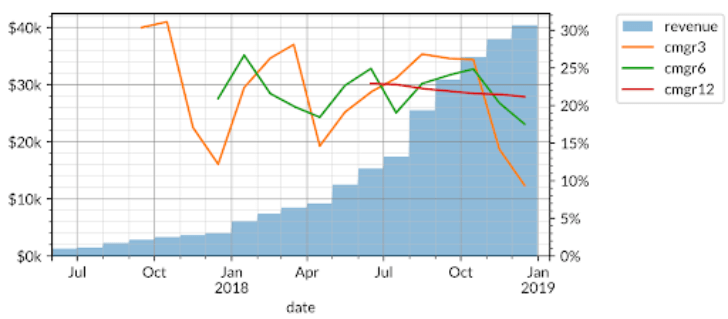
The CMGR3 — the three-month compound monthly growth rate — dropped to 9% due to slower growth in the last few months, but the CMGR12 — which is less sensitive to short-term fluctuations — remains at 20%. The variation in CMGR3 shows that the business likely has a seasonal dynamic to its growth. Overall, though revenue is increasing, CMGR3, CMGR6, and CMGR12 all are trending slightly downward, which means that growth is decelerating.
The growth accounting framework
Growth accounting provides a framework for understanding the underlying components that drive net growth. To dig into the dynamics that underlie changes in growth rate, we break down overall growth in some activity across specific customer segments. From there, we look to see how different segments contribute to or detract from growth.
Let’s assume that the activity we’re analyzing is customer revenue. There are six categories that revenue can be bucketed into:
- New: Gained from customers that were first active in the present period
- Churned: Lost when a customer who was active in the previous period has no revenue in the present one
- Resurrected: Gained from customers who had churned at some point in the past (and thus generated no revenue in the previous time period) but resumed in the present
- Expansion: Gained from customers increasing revenue relative to the previous time period
- Contraction: Lost from customers decreasing (but not to zero, otherwise they would be churned) revenue relative to the previous period
- Retained: Carried over by customers from the previous period to the present one
For example, a customer who spent $10 last month and $12 this month would have $2 in expansion revenue and $10 in retained revenue. However, if this customer instead spent $8 this month (while still spending $10 last month), then $8 would be counted as retained and $2 as contracted.
There are three important identities that express the definitions above:
- All revenue in the present period is equal to the sum of the gains in revenue (new, resurrected, and expansion) and retained revenue.
Revenue(t) = retained(t) + new(t) + resurrected(t) + expansion(t)
- All revenue from the previous period must either churn, contract, or be retained in the present period.
Revenue(t-1) = retained(t) + churned(t) + contraction(t)
- All change in revenue across a period is equal to the sum of the gains (new, expansion, and resurrected) minus the sum of the losses (churned and contraction).
Revenue(t) – Revenue(t-1) = new(t) + expansion(t) + resurrected (t) – churned(t) – contraction(t)
For the last identity, we can convert the terms into percentages (e.g., “% New” is new revenue divided by total revenue from the previous period) to frame everything in terms of the overall growth rate.
Growth_rate ~ New_rate + Resurrected_rate + Expansion_rate – Contraction_rate – Churn_rate
Three useful statistics
Statistics allow us to use these principles to compare across companies. These statistics are a critical component of understanding growth, but we don’t decide to invest purely on them. They are a starting point for discussion and allow us to quickly rule out low-performing companies and concentrate our discussions on the ones with potential.
There are three useful statistics that come out of growth accounting:
- Gross retention is equal to retained revenue divided by total revenue from the previous period.
Gross retention = retained(t) / revenue(t-1)
- Quick ratio is the sum of gains in revenue (new, resurrected, and expansion) divided by the losses in revenue (churned and contraction).
Quick ratio = [new(t) + resurrected(t) + expansion(t)] / [churned(t) + contraction(t)]
Quick ratio measures how efficiently a company is growing in terms of revenue gained per every unit of revenue lost. (By its definition, a quick ratio below 1.0x means that total revenue must be shrinking.)
- Net churn is the sum of losses minus gains in revenue from existing customers only (i.e., excluding new customers) divided by total revenue from the previous time period.
Net_Churn = [churned(t) + contraction(t) – resurrected(t) – expansion(t)] / revenue(t-1)
Note that, by definition . . .
Growth_rate ~ New_rate – Net_churn
For example, a company with 2% net churn loses 2% of its revenue, assuming that it generates no new customers. Note that net churn can be negative, which means that the company will grow revenue even without gaining new customers. Usually, negative net churn is achieved by the company getting significant expansion revenue from its customer base and is a positive signal in any business.
Growth accounting in action
Below are two quick examples in which all of the above growth accounting terms can be applied.
We can apply the growth accounting framework outlined above to the company’s revenue and plot the gains (new, resurrected, and expansion) and losses (churned and contraction) in revenue on one axis, and to gross retention, quick ratio, and net churn on the other axis.
The first example shows growth accounting for an enterprise SaaS product that monetizes via monthly subscription.
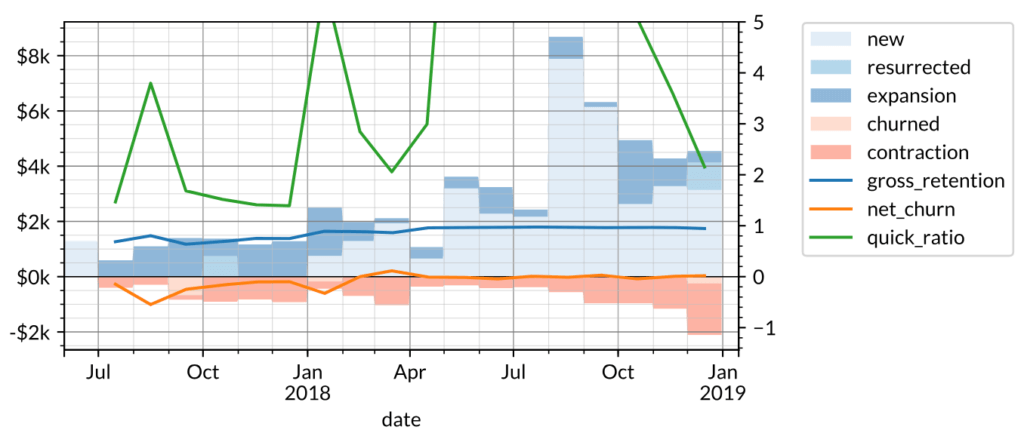
Notice how the spikes in new and contraction revenue in specific months affect the quick ratio, suggesting that there is significant seasonality to the business. The 10% (CMGR3) growth rate for revenue can be broken down into growth accounting components:
10% (Growth Rate) ~ 9% (New) + 1% (Resurrected) + 4% (Expansion) – 4% (Contraction) – 0% (Churn)
This has a slightly negative net churn of -1%, implying that the company would still be growing revenue even without adding new customers. These metrics are typical of a B2B SaaS company, which often grows revenue not only by acquiring new customers but also by expanding revenue from existing customers. Good B2B customers also have low churn, which contributes to a significantly higher gross retention.
The second (once again, fictional) example is a consumer business whose revenue and CMGR3/6/12 are shown below.
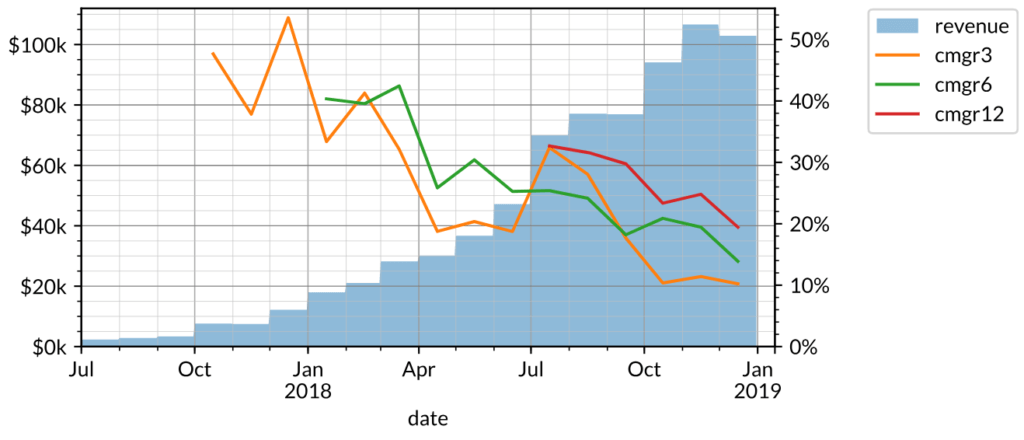
Over the past three months, the company in this example grew about as fast as the previous example (~10% CMGR3). However, growth has slowed significantly, since the CMGR12 (20%) is well above its CMGR3.
The growth accounting of this company is also very different: there is significantly more contraction and churn in the customer base, resulting in relatively low gross retention (<50%) and high net churn. Likewise, the quick ratio is below 2.0x.
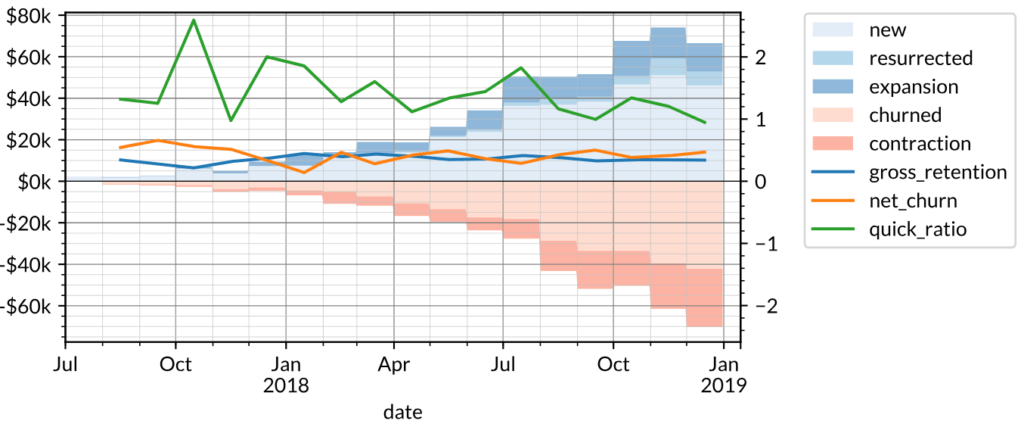
Typical discretionary spend products (often consumer-oriented as opposed to B2B) tend to look like this because there is no recurring revenue behavior to maintain retention.
Neither of these businesses is necessarily better or worse than the other because of these metrics. Rather, growth accounting helps us understand how the business has operated to date and guides the next set of questions to ask. For the enterprise company in the first example, these questions might revolve around whether the company can build out a sales team to maintain growth. For the consumer company in the second example, these questions might revolve around profitability per customer.
If you’d like some help with computing this for yourself, there is a useful PostgreSQL query here that calculates growth accounting, among other things.
A new understanding of growth
“If you want to understand startups, understand growth. Growth drives everything in this world.”
— Paul Graham
In 2012, Paul Graham wrote his essay Startup = Growth, which put growth at the center of founding and investing in startups. “A startup is a company designed to grow fast,” Graham wrote. Growth defines startups, Graham argued, and great growth looks like 10% in week-over-week compounding growth. However, on that point, Graham left an important footnote:
“Beware too of the edge case where something spreads rapidly but the churn is high as well, so that you have good net growth till you run through all the potential users, at which point it suddenly stops.”
For early-stage companies, growth rate is the starting point for identifying product-market fit, but diagnosing the health of that growth and the underlying product-market fit requires diving deeper into underlying dynamics that drive that growth. Growth accounting is Tribe’s effort to better understand growth through a process of standardization that sets the stage for more rigorous analysis.
. . .
. . .
productboard is a product management system that enables teams to get the right products to market faster. Built on top of the Product Excellence framework, productboard serves as the dedicated system of record for product managers and aligns everyone on the right features to build next. Access a free trial of productboard today.