
This is part 3 of our 12-part series “This is Product-Led,” inspired by our conference for Gainsight PX users, Pulse for Product.
The world’s first video game—Pong–was developed by a scientist to amuse other scientists at the Brookhaven National Laboratory. This was true of most retro video games: They were for developers, by developers, and full of inside jokes and tricks you either knew or didn’t. Any product teams at B2B software companies find this scenario familiar?
When you are your own user, decisions are easy. Intuition reigns. But once you begin to grow past early adopters who are wonderfully forgiving of bugs, suddenly, it becomes difficult to know what they need. Churn begins to rise. That’s where data is essential.
As Sid Shah, Director of Product Analytics at Google Geo explained in his Pulse for Product session, you have to ask, “How does one think about building products using both intuition and data?”
It Helps to Have HEART
When the pandemic arrived, Google Geo—the division responsible for Google Maps, among other services—faced a dilemma. “People wanted to call medical facilities before visiting. In an indirect way, this problem was related to saving lives. But how would we know if people had found what they were looking for, and found it useful?” says Sid.
With user journeys, the team could see what features were being used. But Sid knew that usage didn’t necessarily correlate with utility. “Just because you completed your taxes doesn’t mean you enjoyed the process,” says Sid. “We needed sentiment and feelings to measure improvements.” This led Sid and the team to implement in-app surveys.
According to the traditional product development cycle, pictured below, there isn’t a lot of room for subjective survey data. If people are using the feature, they’re presumed to be enjoying the feature. But this often isn’t the full picture.
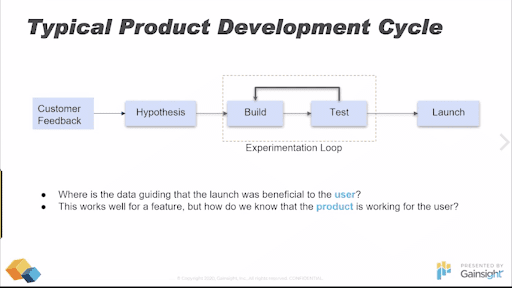
The traditional product development cycle.
“You have to think beyond the traditional product development cycle,” says Sid, who has appended this process with a methodology of qualitative measurement known as HEART: short for Happiness, Engagement, Adoption, Retention, and Task Success. It provides a deeper view into the user experience: Users may have high adoption and task success, but low happiness and engagement, and thus be a churn risk—and a treasure trove of information on how to improve the product.
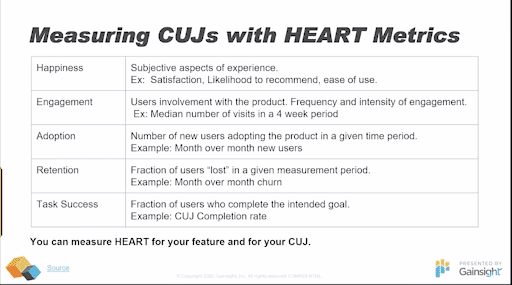
HEART metrics defined.
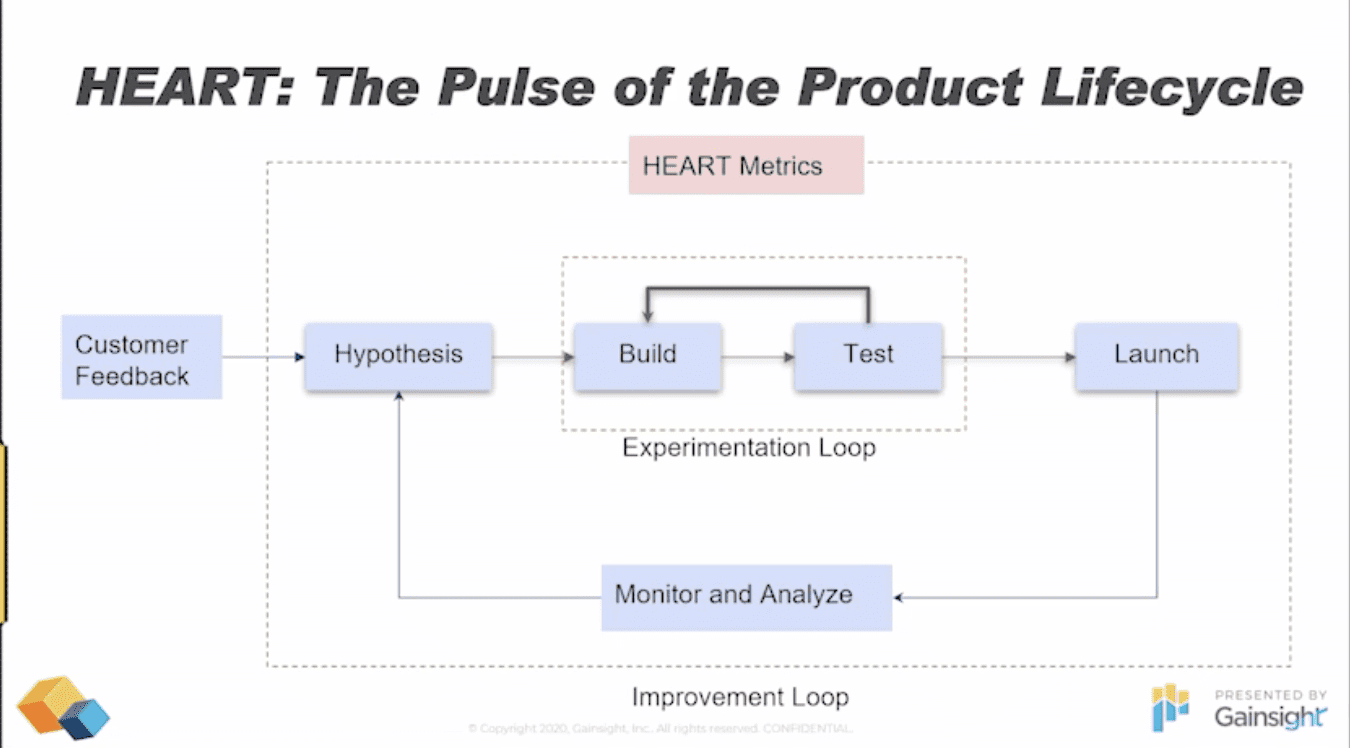 The product lifecycle with HEART metrics factored in.
“This allows us to measure happiness in real-time,” says Sid. “That way we can diagnose in-depth, and ask better and better questions to our users.” Since the pandemic struck, Google Geo has used this data to understand how people look up doctor’s offices, whether they find what they’re looking for, and whether those journeys end in success.
Try It For Yourself
Retro gamers know well that video games have grown easier over time. They’ve become friendlier, more forgiving, and less of a button-mashing slog. What’s bad for hardcore gamers is good for the rest of us: It’s made video games accessible to all. For product teams coming out of a “by developers, for developers” phase, that’s exactly what you want.
Take a page out of the Google Geo team’s book: Measure sentiment in real-time so you know if your users are enjoying their experience. Curious what that looks like? Grab a free trial of Gainsight PX and take a peek inside your product today.
Level up your product strategy—Try Gainsight PX free!