


As we indicated in our previous blog, AIOps (Artificial Intelligence for IT Operations) refers to the application of machine learning analytics technology that enhance IT operations analytics. In this blog, we will review the AIOps capabilities of eG Enterprise and see how machine learning, intelligent correlation and advanced analytics help organizations:
- Get actionable alerts from millions of metrics collected in real-time
- Proactively learn about issues that may affect service delivery down the line
- Remediate application and infrastructure issues quickly and accurately
- Drive continuous improvement in service quality and operational efficiency

The following sections will focus on the following capabilities that form the essence of eG Enterprise’s AIOps capabilities:
- 1 Embedded domain expertise for metrics collection
- 2 Auto-baselining for proactive problem detection
- 3 Automatic problem diagnosis
- 4 Top-to-bottom, end-to-end auto-correlation
- 5 Auto-discovery and dependency mapping
- 6 Metric aggregation and service quality indicators
- 7 Bottleneck detection, Forecasting and capacity planning
- 8 Automatic correction and remediation
#1. Embedded Domain Expertise for Monitoring
eG Enterprise monitors your entire IT landscape – from hardware to application, from network to storage, from virtualization to cloud and containers. Unfortunately, there is no single protocol or mechanism to monitor all of these heterogeneous tiers. So eG Enterprise uses a variety of mechanisms to interface with the applications and infrastructure being managed.
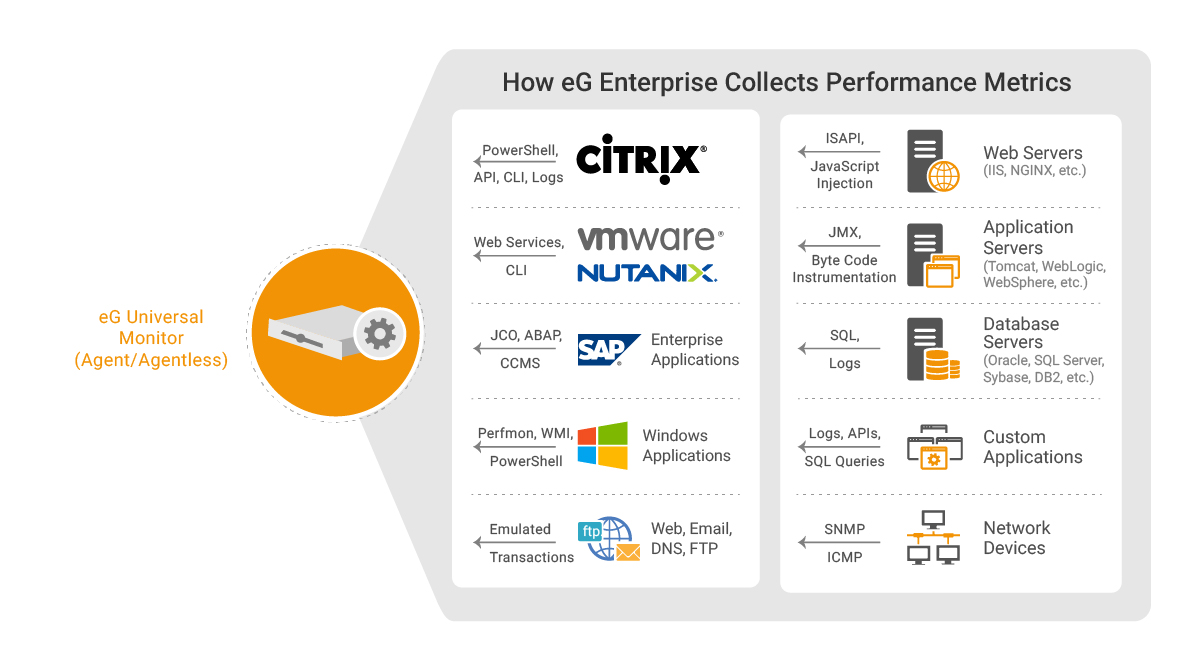
performance metrics from the IT environment
Very often, monitoring tool vendors start off by collecting metrics exposed by the technology vendor using the available APIs. While this is a good starting point, it usually is not sufficient. Technology vendors are focused on functionality first and monitoring is many a times an after-thought. Hence, the metrics exposed via APIs for each technology tier may not be sufficient.
 When architecting eG Enterprise, we place a lot of expertise on “what to monitor” rather than “how to monitor”. What metrics to collect is determined based on a deep understanding of how each technology tier works and what are its failure modes. Vendor-recommended best practices and industry expert recommendations also go into determining the metrics that eG Enterprise collects. Once a short list of metrics is determined, then begins the challenge of how to collect these metrics.
Application APIs, OS commands, log files, SNMP, web services functions, etc. are all reviewed for each tier. Even to monitor a single tier, multiple protocols/mechanisms may be needed. Some metrics are available through OS commands, some others through APIs such as Windows management instrumentation (WMI), while some other details are available in OS or system log files.
75% of users found the universal monitoring capability to be one of the most useful features of eG Enterprise.
Source: TechValidate
#2. Auto-baselining for Proactive Problem Detection
Monitoring tools trigger alerts when thresholds are crossed. IT managers often have several common complaints about the alerting process:
 Firstly, they receive many “false” alerts. A false alert refers to situations in which the monitoring tool indicates there is a problem, but the IT manager determines that there is no real issue or impact. Thousands of alerts can distract and overwhelm IT administrators and prevent them from focusing on or identifying real issues that can impact IT service quality.
- To avoid false alerts, IT managers must define threshold values for the different metrics collected. A threshold is a limit set within a monitoring tool for a metric, so that if a metric crosses this value an alert is raised. In a large enterprise, monitoring tools can collect millions of metrics. Having to set thresholds manually for each metric is a time-consuming and monotonous process. Organizations that tune thresholds manually typically spend a lot of time and money having consultants or administrators tune thresholds manually.
- What would constitute a significant threshold on a metric to trigger an alert can vary wildly depending on the context of what is normal behavior and usage for each, and every system and the time frames involved. Certain metrics could be expected to be high during office hours during companywide video meetings but would be highly unusual at 3am on a Sunday, likewise if Janice in Accounts usually uses Excel on weekdays inside regular office hours but is suddenly downloading a lot of files or running PowerShell at midnight there may well be a security breach in progress.
With eG Enterprise, thresholds are set in three different ways:
- For key metrics, thresholds are set out-of-the-box based on industry standard best practices.
- IT managers can set thresholds for metrics based on service level agreements (SLAs). Three levels of thresholds can be set for upper and lower thresholds, allowing for escalation of alerts should a problem worsen in severity.
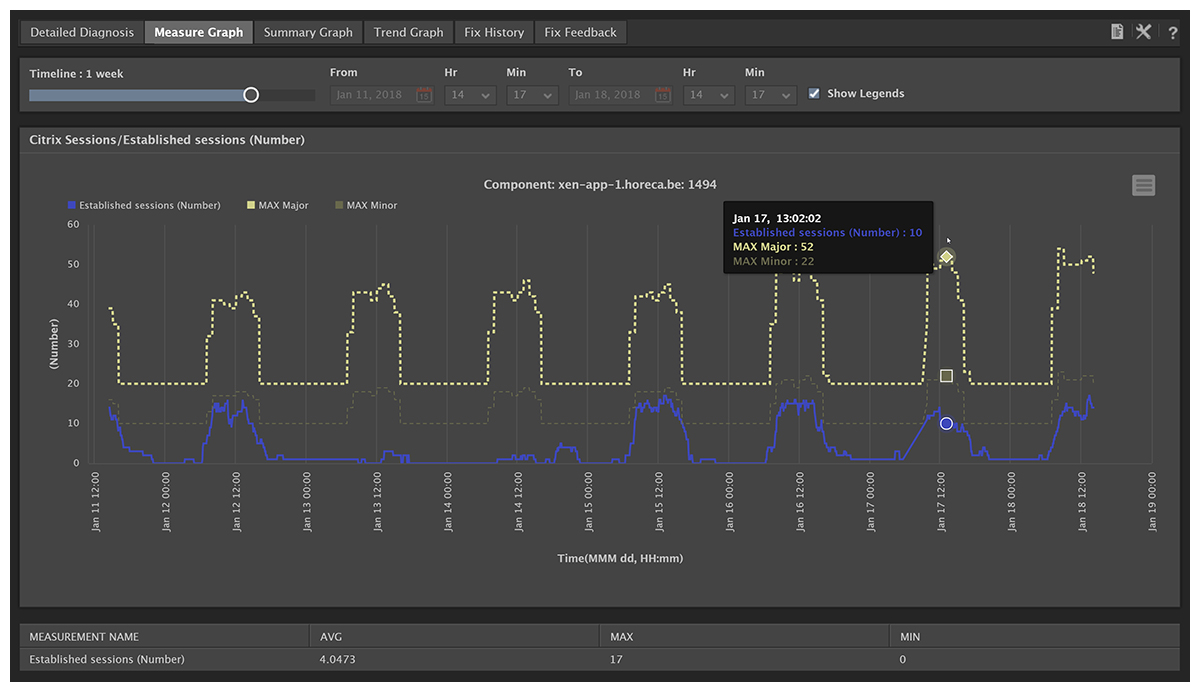
- For time-varying metrics or metrics that depend on the system configuration (and hence, need to be set specific to each system), eG Enterprise’s machine learning auto-baselining technology is used. This technology tracks time of day, day of week behavior of each metric and uses past history to estimate what the upper and lower limits of each metric are likely to be in the future. Administrators can choose the granularity with which they apply this derived intelligence to allow thresholds to be automatically and dynamically fine-tuned.
Auto-baselining is the key to making the monitoring solution proactive and easy to use:
- Administrators often get early warning indicators alerting them to abnormal usage of resources, unusual traffic patterns and such.
- This technology is also a key to making the monitoring solution easy to use. Administrators no longer must configure thresholds one by one, for each metric, for each system.
- Extensive expertise is also not required to configure the solution. At the same time, if a metric generates too many alerts, administrators have an option to configure “leniency levels” that allow for some degree of variation from the normal thresholds.
84% of users reported that eG Enterprise helped them avoid application performance outages by identifying problems before end users were affected.
Source: TechValidate
#3. Automatic Detailed Diagnosis of Problems
 In the medical world, you undergo routine medical checkups to see how you are doing. If all your parameters are normal, no further investigation is needed. On the other hand, if any abnormality is detected, you must undergo additional tests.
The same analogy holds for IT monitoring also. Routine tests check key parameters regarding the applications and the infrastructure supporting them. These tests are designed to impose least overhead on the target environment. But when problems occur, additional diagnosis is performed to collect more details about a problem. Deep domain expertise is required to determine what additional diagnosis is required.

The diagnostic checks vary from one application to another and from system to system. For example, when a large number of IOPS (Input/Output Operations Per Second) are observed on a database server, the diagnosis collects information about the top queries that are causing IOPS. Their execution plans are also collected to provide administrators the details they need to troubleshoot the problem effectively.
If a problem persists, the IT team may reboot a system and the problem might go away. In the same way, dynamic scaling may take effect when a problem occurs, and this could alleviate a problem. The problem is, if you check the IT environment several hours after the problem occurred, you may not be able to determine why a problem occurred unless you collected the right data at the time the issue occurred. If left unresolved, the same issue can occur again and again.
Collecting detailed diagnosis when a problem is occurring is a key to effective monitoring. Collecting additional details right around the time when a problem occurred and storing it for additional diagnosis ensures that IT teams don’t have to rely on the target infrastructure being available when they access the monitoring tool.
70% of users stated that eG Enterprise helped identify the cause of complex application performance problems that involve multiple domains.
Source: TechValidate
#4. Top-to-Bottom, End-to-End Correlation of Alerts
 | Event Correlation vs. Event Filtering Event correlation makes sense of events and contextualizes them. This is often confused with event filtering, which simply attempts to reduce the volume of events. Effective event correlation will differentiate between the specific cause of an event storm and the effects. |
Many IT organizations operate in silos, with separate teams, often geographically distant, responsible for various parts of the infrastructure and application deployment. Often these teams use different set of tools to monitor the health of individual domains, such as cloud and data center, networking, storage, and others. When a problem occurs, it is essential to be able to point to the relevant tier of the infrastructure and the associated team. This is where Root Cause Analysis (RCA) comes in. Accurate and effective root-cause diagnosis can save organizations hours of time they would otherwise spend in bridge calls and in finger-pointing. Good RCA capability ensures that IT operations teams get a prioritized list of alerts – the highest priority points to the root-cause of problems, while the lowest priority often denotes the effects.
Cause-effect relationships between alerts are common in modern application infrastructures because they are architected using a multi-tier architecture. While multi-tier architectures offer improved scalability, they make monitoring and diagnosis more challenging. This is because there are multiple inter-dependencies between tiers that support an application.

For example, with a three-tier web application, the web tier is dependent on the middleware tier, which in turn, depends on a database tier for data. In this example, a problem in the database tier can ripple and affect other tiers in the application architecture.
eG Enterprise employs a multi-level, dynamic correlation technology. Filtering and aggregation of related events is performed, so multiple alerts of the same type are grouped together, further reducing your false alerts. Performance alerts are then correlated temporally, i.e., the diagnosis of the monitoring tool evolves as it gets more information about the end-to-end infrastructure.
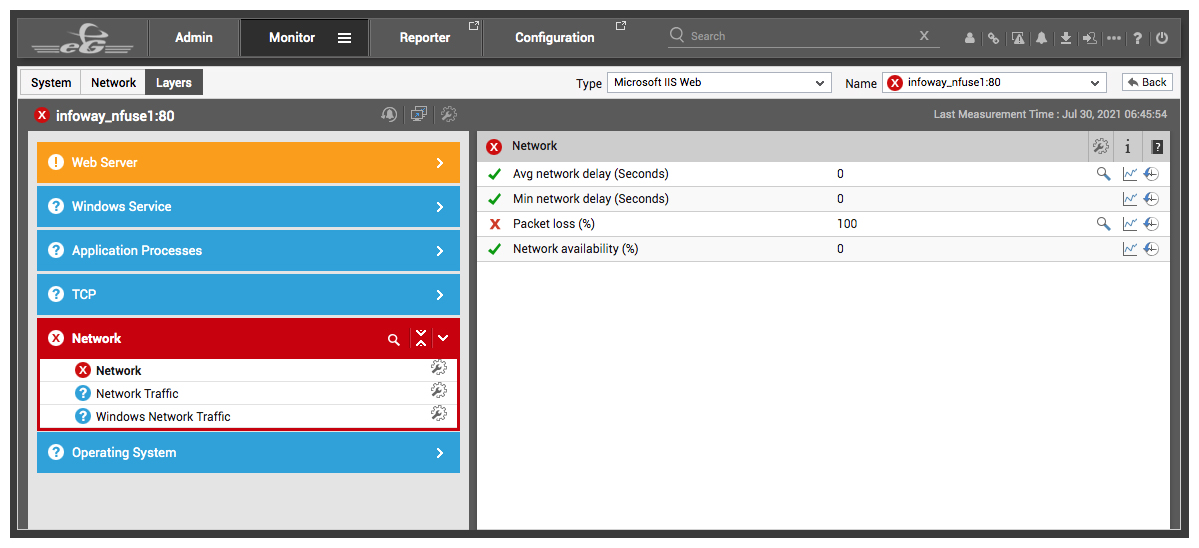
- Correlation happens top-to-bottom first. Layered/stack models of each IT tier are used to map metrics and alerts to layers and to hierarchically organize layers to reflect the dependencies between them. The figure below shows an example of top to bottom correlation. In this example, a web server is down. There are alerts at the network layer and at the web server layer. eG Enterprise has correlated the two and highlighted the Network layer alert as being the root-cause.
 Figure 5: How top-to-bottom correlation works:
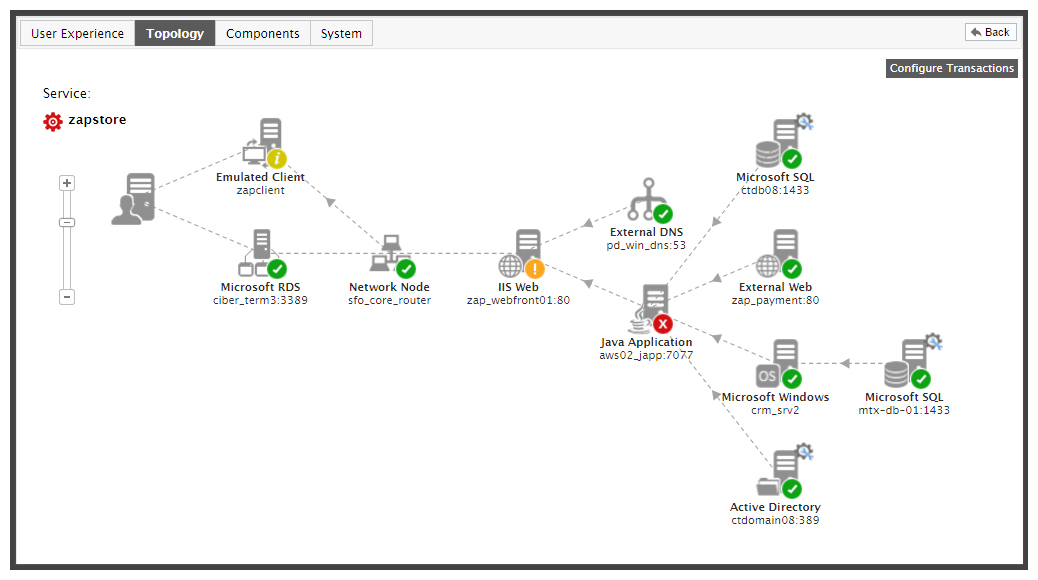
The Network layer alert has a higher priority, highlighting where the real problem is- Next inter-dependencies are used to correlate alerts. Inter-dependencies can be of different types. There are application-to-application interdependencies (e.g., a web server depending on a database server). Application components depend on network elements to communicate and hence, there are application-to-network dependencies.Application components often run on virtual machines (VMs) and VMs are hosted on physical machines. eG Enterprise embeds a patented root-cause diagnosis engine that considers all these types of dependencies and is the industry’s first truly virtualization- and cloud-aware RCA technology. This technology correlates alerts from different tiers and automatically pinpoints where the root cause of a problem lies, enabling you to differentiate the cause of a problem from its effects and resolve performance issues in minutes rather than in days.The figure below shows a topology view of a business service. By correlating across the different alerts in the infrastructure, eG Enterprise has helped highlight the tier with the highest priority alert. Drilling down into the tier will highlight the layer and metric that is the cause of the problem.
 Figure 6: An example of end-to-end correlation in eG Enterprise.
The root-cause of the issue is highlighted in the topology
72% of users reported that eG Enterprise helped reduce the time to identify the root cause of application performance.
Source: TechValidate
#5. Auto-Discovery and Dependency Mapping
Manually creating topology graphs like what you saw in the above figure can be challenging. Some administrators may not even be aware of their service topologies. Furthermore, manually discovering these dependencies can be time consuming. At the same time, some dependencies are dynamic – e.g., an application and its VM can move between physical nodes in a virtualization cluster. Hence, to be effective monitoring tools must be smart enough to auto-discover the applications and infrastructure they are to monitor.
Unlike physical topologies and network connectivity, which is simpler to discover, inter-application dependencies are not straightforward to unearth. Many monitoring tools have used network sniffing and network connectivity information to discover application inter-dependencies. These techniques are more challenging in virtualized and containerized environments where inter-application communications can happen within a physical server itself.
eG Enterprise uses embedded to discover application landscapes (for example, in a Citrix deployment, an agent on a Citrix Delivery Controller can map out most of the service topology map because it knows how to determine where the virtual app servers are, what the dependency between a virtual app server and a provisioning server is, etc.). Using application APIs, configuration information and application-specific commands, eG Enterprise precisely discovers application topologies. Dynamic dependencies like VM to physical machine dependencies are discovered using virtualization APIs. The result is easy deployment and configuration of the monitoring system. Manual overrides to the discovered topology are possible, should the auto-discovered information need to be modified.
70% of users stated that eG Enterprise helped identify the cause of complex application performance problems that involve multiple domains.
Source: TechValidate
#6. Metric Aggregation and Service Quality Indicators
Analytics is defined as the discovery, interpretation, and communication of meaningful patterns in data. This makes analytics a key component of the eG monitoring platform. While monitoring of individual KPIs is important, there are several situations where it is more important to look at combinations of KPIs or to look at KPIs across multiple systems being monitored. eG Enterprise implements metric analysis and interpretation in several ways:
- Performance Ratings: A performance rating is a single quantifiable rating/index that is representative of multiple metrics – this is similar to Apdex ratings used for user experience tracking and Customer Satisfaction Index (CSI) used by service providers to measure their performance.
 Figure 7: How performance rating works in eG Enterprise
Performance ratings can be defined at any layer and for any component monitored. The metrics used are specified at the time of creating a rating and a weightage can be assigned for each metric – so different priorities can be assigned to different metrics for computing the rating. Based on the state of each metric, a rating is computed, and it takes a value between 0 and 100, with 100 indicating a good rating and 0 indicating a poor rating.
The advantage of defining ratings is that administrators can see a simple and clear rating of overall performance, instead of having to dig through multiple different metrics. For instance, a Citrix user experience rating is defined based on logon time, application launch time, screen refresh latency and network latency. Organizations can set SLAs based on the overall user experience rating they are striving to achieve.
Performance ratings are treated like other metrics which means thresholds can be applied to them and it is possible to generate reports based on changes in ratings over time.
-
 Figure 8: Metric Aggregation enables the same measure to be
aggregated across multiple components of the same type.Aggregated metrics: Production systems often have groups of systems working together to handle the workload. For example, a web server cluster has multiple web servers with load balancing being performed across the servers. In such a case, administrators may not be interested in looking at the workload of each server individually. It is more important to look at the web server cluster as an aggregate. IT administrators and architects may be interested in the total request rate to the cluster, average CPU usage of the cluster, memory utilization of the cluster and so on.
eG Enterprise allows administrators to define aggregated metrics that represent the overall health of a cluster or a group of systems. Functions performed to obtain aggregated metrics include average, min, max, sum, etc. Aggregated metrics provide enterprise-wide views of IT demand, quality and utilization.
Aggregate metrics are treated like other metrics. So, thresholds can be applied to them, and it is possible to generate reports based on changes in their values over time.
| While performance ratings combine different types of metrics to provide one rating factor, aggregated metrics combines the same metric across groups of systems to provide a combined value. |
- Conditionally Aggregated Metrics: This is also used to represent the health of a group of systems. Unlike simple aggregation where the metrics from multiple systems are combined together using min/max/average/sum functions, conditional aggregation applies conditions against metrics from each system in the group.For instance, an aggregated metric can reflect the percentage of servers in a group that have CPU utilization above 80%. Different alert levels can also be set – e.g., generate a minor alert when 20% of the servers have utilization above 80%, a major alert when 50% have utilization above 80% and a critical alert when 80% of servers have utilization above 80%. Using this capability, administrators can set complex conditions based on which they are alerted.
#7. Bottleneck Detection, Forecasting and Capacity Planning
Monitoring tools are not just used for real-time monitoring and problem diagnosis. The wealth of data they collect can be used for intelligent analysis and to right-size and optimize the infrastructure and applications being monitored. eG Enterprise embeds a number of capabilities in this area:
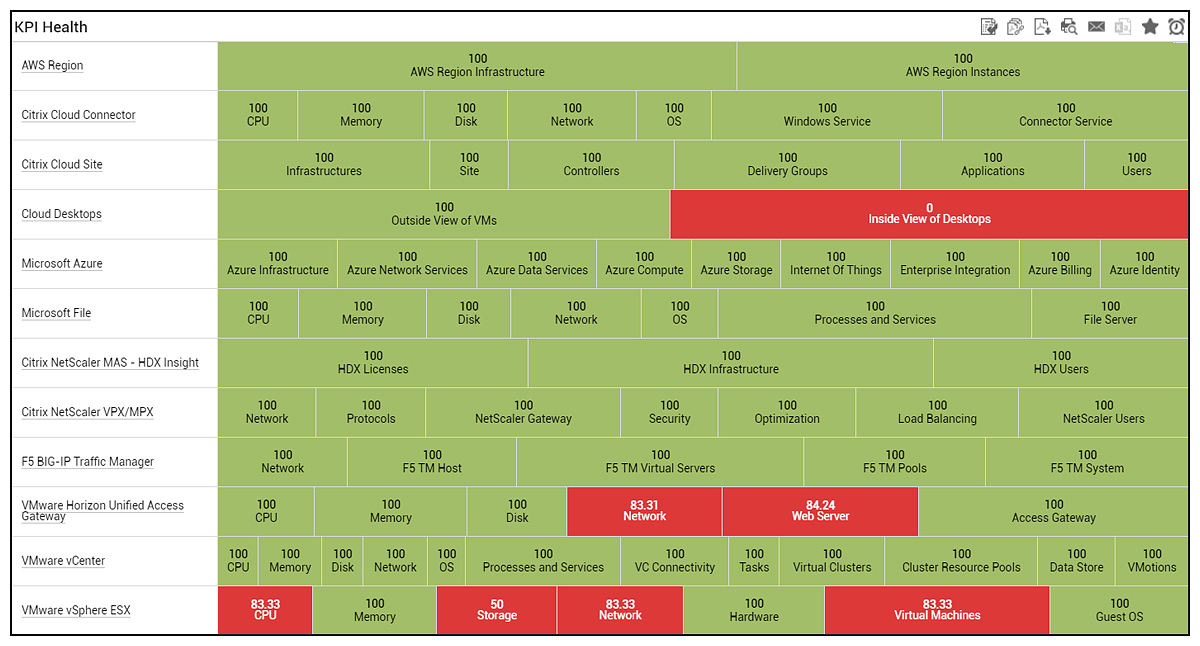
 KPI analysis and bottleneck detection: Analysis of historical alerts is used to provide a clear indicator of which tiers and which layers are responsible for past issues in the infrastructure. Drilldowns allow for deeper analysis of bottlenecks.
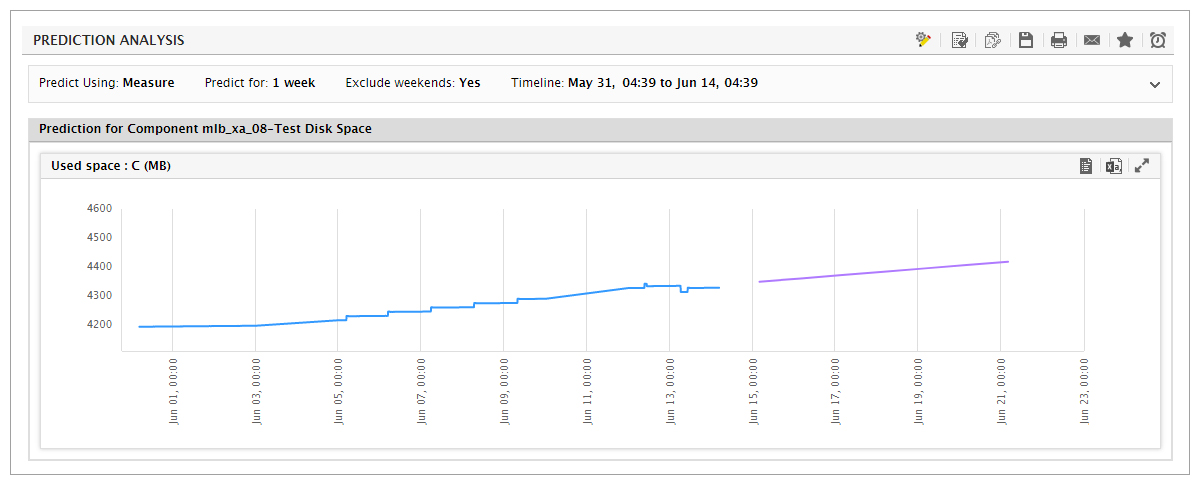
 Forecasting: Using this capability, you can use built-in prediction mechanisms and sophisticated forecasting techniques on historical data for a metric to automatically compute how that metric is likely to change in the future. This report is helpful to determine when in the future the current resource capacity of the target systems may be exhausted; this information will enable you to re-evaluate your capacity plans and make sizing changes, to provide for such contingencies.
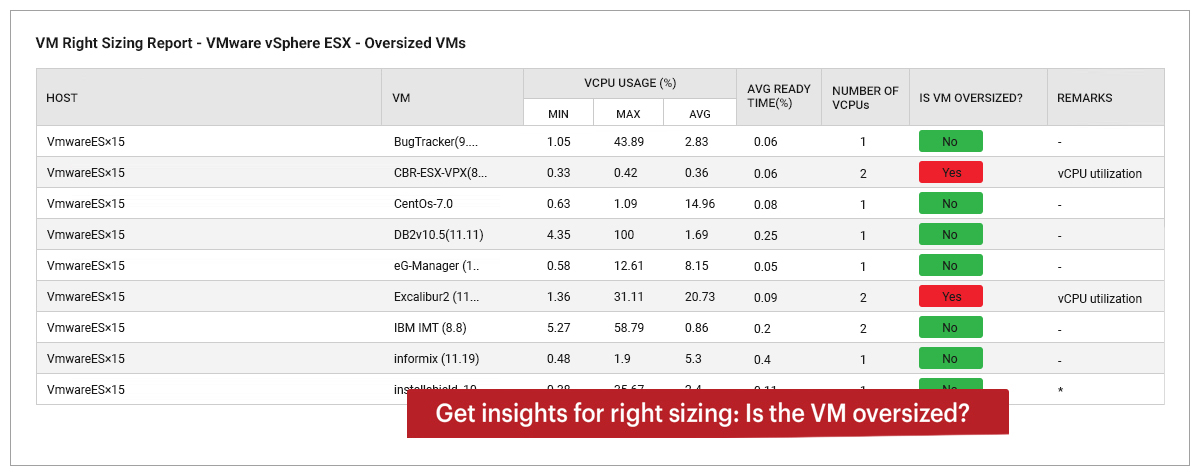
 Right–sizing: For virtualized environments, eG Enterprise analyzes the performance of VMs over time and provides recommendations on which VMs are over-sized, which ones are under-sized, which VMs have not had significant activity in the past and are likely candidates for being powered off, etc.
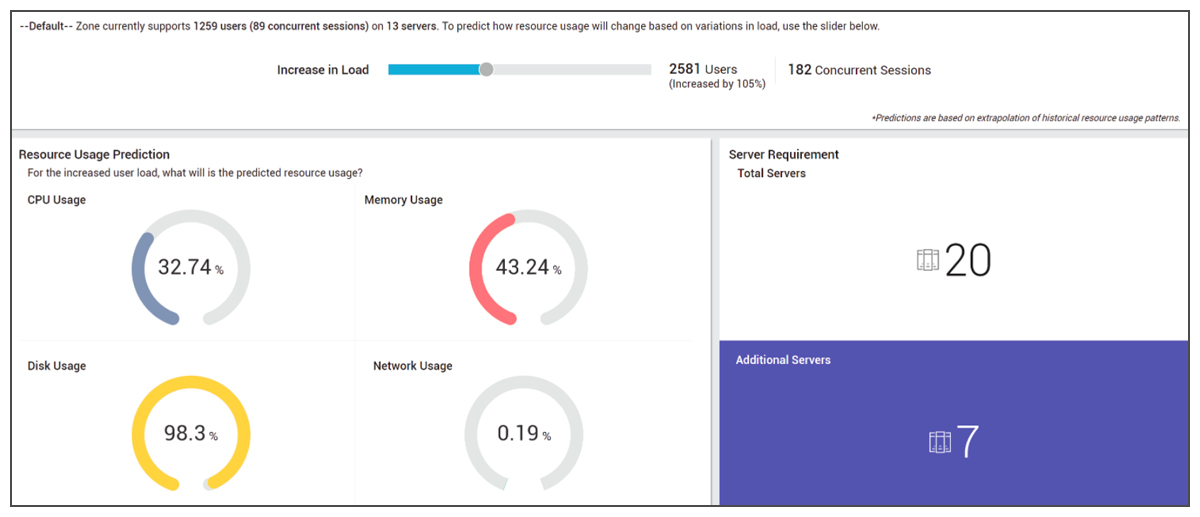
 Capacity planning: Trend analysis and outlier detection is also used to analyze traffic patterns and resource utilization trends. These insights are then used to determine how to plan effectively for future growth. For example, when deploying digital workspaces, you may want to know, how many more systems are needed to accommodate a thousand additional users. eG Enterprise’s capacity planning reports provide the answer to this.
#8. Automatic Problem Remediation
 An important way to enhance IT operational efficiency is automatic problem remediation. When the cause of a problem is well understood, auto-correction must be implemented. For instance, if a service that is in automatic mode is not running, it can be restarted by the monitoring tool. Likewise, when a disk drive fills up, temporary files in well-known locations can be deleted.
Automated actions like these are built into the eG Enterprise universal monitoring technology.
To support scenarios where IT administrators may prefer to execute their own corrective scripts, eG Enterprise provides a way for administrators to define and upload scripts to the system. These scripts are executed by the agents as and when a threshold condition is violated. The scripts embed the intelligence to analyze the thresholds, determine the faulty metrics and perform the appropriate action. With the right auto-correction mechanisms in place, you can increase service uptime and lower mean time to repair (MTTR).
Automation benefits staff well-being by removing the burden of repetitive manual tasks, prone to human error; making work easier and more efficient not only improves productivity but also helps organizations thrive as healthy happy workplaces.
eG Enterprise is an Observability solution for Modern IT. Monitor digital workspaces,
web applications, SaaS services, cloud and containers from a single pane of glass.
Conclusion
Monitoring an IT infrastructure is not just about collecting metrics. There is a whole lot of analysis, interpretation and decision-making that a monitoring solution needs to perform to assist IT operations personnel in their day-to-day tasks. This blog has summarized the different AIOps capabilities that are embedded in eG Enterprise and how they complement each other and enable the solution deliver on its promise of proactive and simplified IT application and infrastructure monitoring.

eG Enterprise is an Observability solution for Modern IT. Monitor digital workspaces,
web applications, SaaS services, cloud and containers from a single pane of glass.


