

Product Managers: Why Do Your B2B SaaS Customers Churn?
Revenue churn is a major challenge for any B2B SaaS product manager. Churn is a nice way of saying lost customer revenue. Every month and year customers decide to stop paying for your product. While some of the churn is involuntary (business closed, merger/acquisition, etc.), the majority is voluntary. Customers decide for a number of reasons not to continue using your product. Some move to competitors. Some simply stop using a solution. The Rest is unknown. Product Managers, why do your B2B SaaS customers churn?

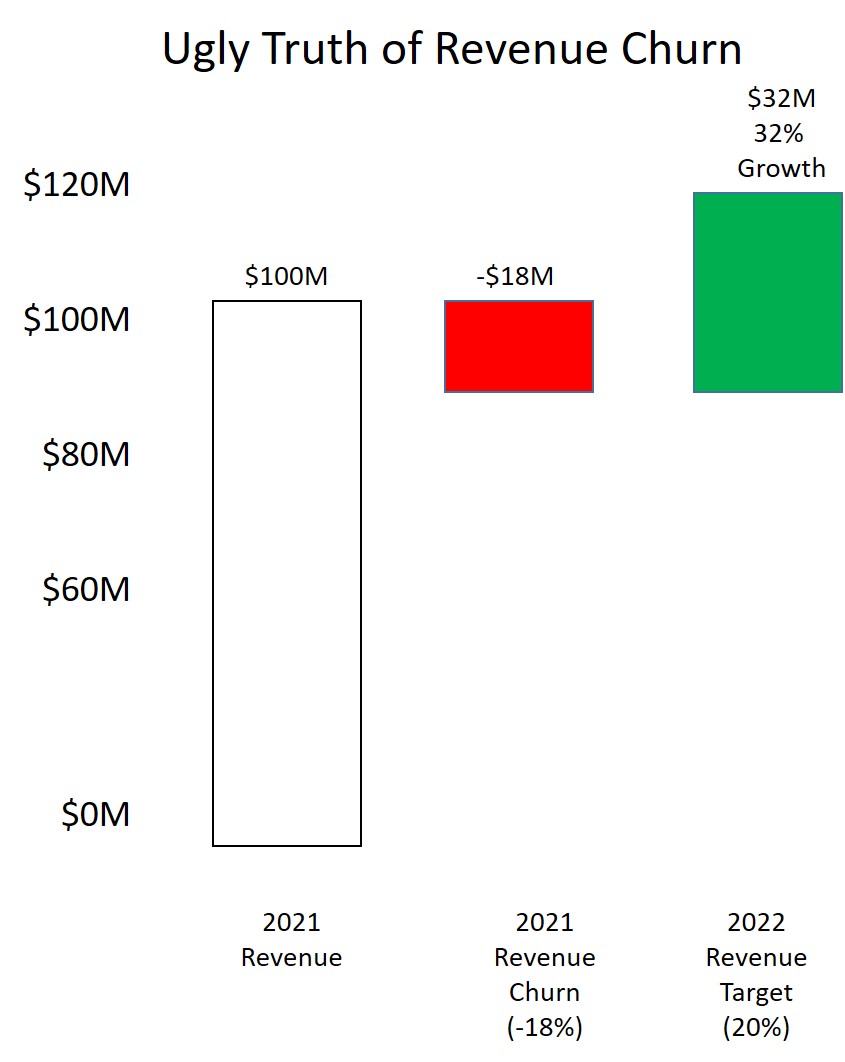
The Perennial B2B SaaS Challenge
Revenue churn is a fact of life for B2B SaaS product managers. Every month and year, customers cancel or fail to renew their subscriptions. This presents a challenge. As most companies are valued in large part by their total revenues and revenue growth, churn, churn creates a hole that must be filled before the company can show any revenue growth.
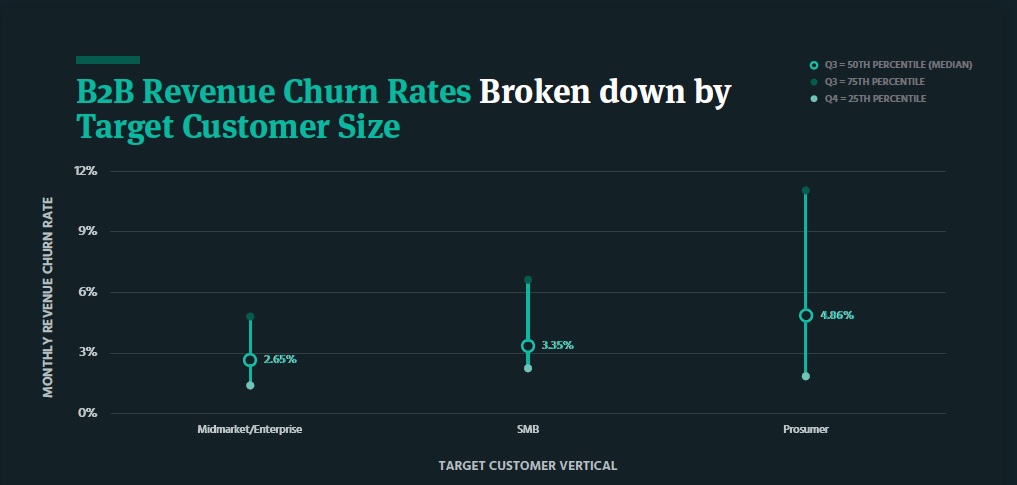
How Big is B2B SaaS Revenue Churn
If you look at industry studies, B2B gross revenue retention is between 85% and 95%. Gross revenue retention is equal to the revenues of a cohort of customers in one time period minus/plus the revenues from the same cohort in another time period. Most companies look at this on a monthly or annual basis. Many companies use another metric, Net Dollar Retention. Net Dollar Retention describes the changes in recurring revenue over time according to upgrades, downgrades, and churn. For this article, we are going to focus on churn.
As Bessemer Ventures reported in their research report Scaling to $100 Million, gross retention ranged from 85% to 90%, depending on the size of the company. Bessemer looked at data from over 200 investments in cloud companies they had made.
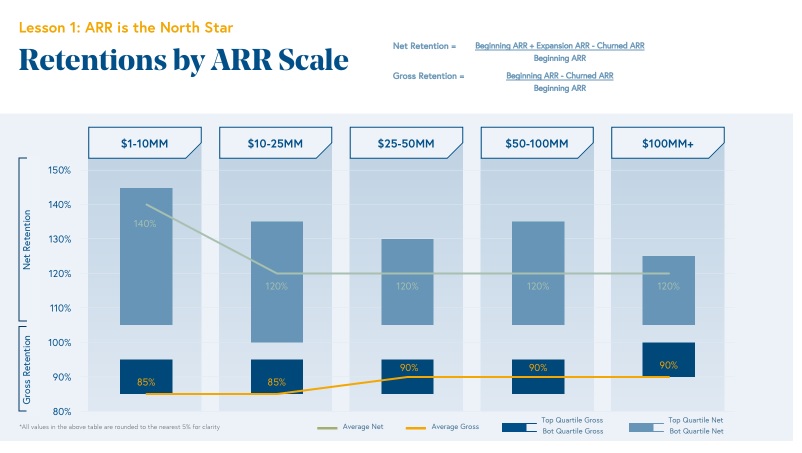
Bessemer Ventures Scaling to $100 Million
Sammy Abdullah, from Blossom Street Ventures, published some great research on gross retention for public SaaS companies. He found:

,
He noted:
“While 91 SaaS companies disclose net dollar retention (which includes upgrades) at the time they went public, only 18 disclose gross dollar retention. That data is presented below and as you can see, median gross dollar retention is 95%. This figure is clearly subject to bias as so few companies report it, but it is nonetheless extraordinary. A few observations:
Gross dollar retention above 86%. Of the 18 publicly traded companies that disclosed their gross dollar retention at IPO, the lowest figure was 86% which is still very good. Generally speaking, healthy SaaaS has gross dollar retention of 80%+. Obviously, the higher gross dollar retention is, the higher net dollar retention will be.
Selection bias. The fact that only 18 companies share their gross dollar retention while 91 share net dollar retention should indicate to you the data is highly subject to bias. In other words, only those companies with fantastic gross dollar retention are reporting it. Even though the median here is 95%, we continue to believe 80%+ gross dollar retention is a fine place to be.
Some firms prefer gross dollar retention. We do know some growth equity and venture funds that look to gross dollar retention more so than net dollar. Their view is that so long as you’re not losing customers, they can teach you how to upgrade those customers, whereas if gross dollar retention is low, that’s a much harder problem to solve (retaining customers). We happen to care far more about net dollar retention, as it takes time to figure out your ideal customer and NDR reflects that focused customer, whereas GDR doesn’t isolate the ideal customer in the data at nearly as well.”
Gross dollar retention metrics
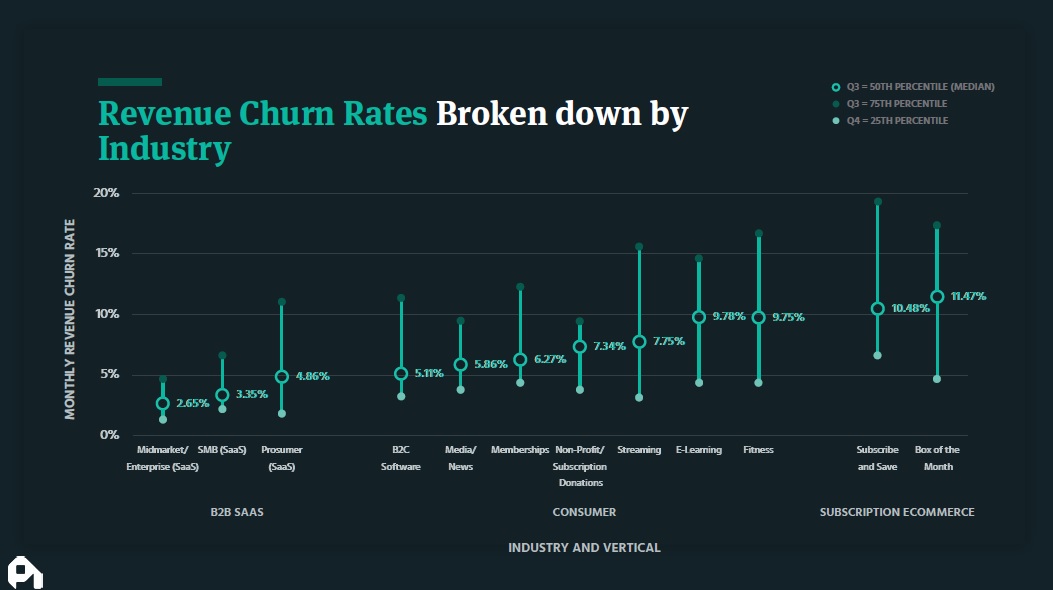
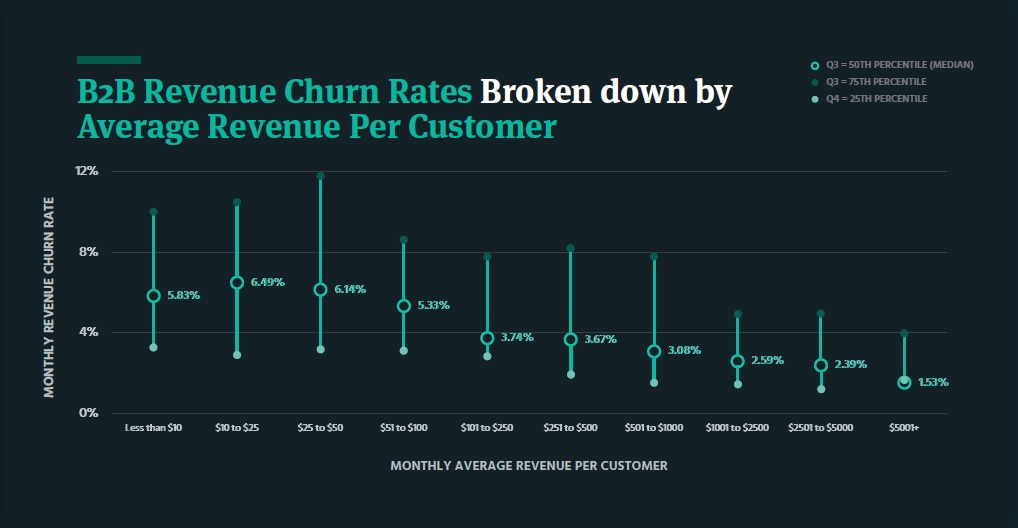
Profitwell, a SaaS company specializing in revenue retention, regularly publishes research on churn. In their most recent report they noted:
Why Do B2B SaaS Customers Churn?
There are a lot of reasons why SaaS customers churn. Over the past 20 years, I have worked for a number of enterprise B2B SaaS firms. Generally, the reasons have broken down into the following categories:

l
Out of Business
Unfortunately, customers do go out of business. The recent pandemic certainly has caused many firms to shut their doors. Even before the pandemic, however, some industries just have a high rate of bankruptcies or closures. For years I worked in the B2B Integration space. A portion of our customer base was garment manufacturers that sold clothing to big retailers like Macy’s and Dillards. Every year, 5% to 10% would close or go bankrupt. New companies would enter the market to replace those that shut down. Going out of business is an example of involuntary churn – churn that happens because of a no fault of the SaaS provider.
Mergers/Acquisitions/Divestitures
M&A continues at an active pace. Eve in the SaaS industry, there are expected to be over 3,000 mergers and acquisitions in 2021:
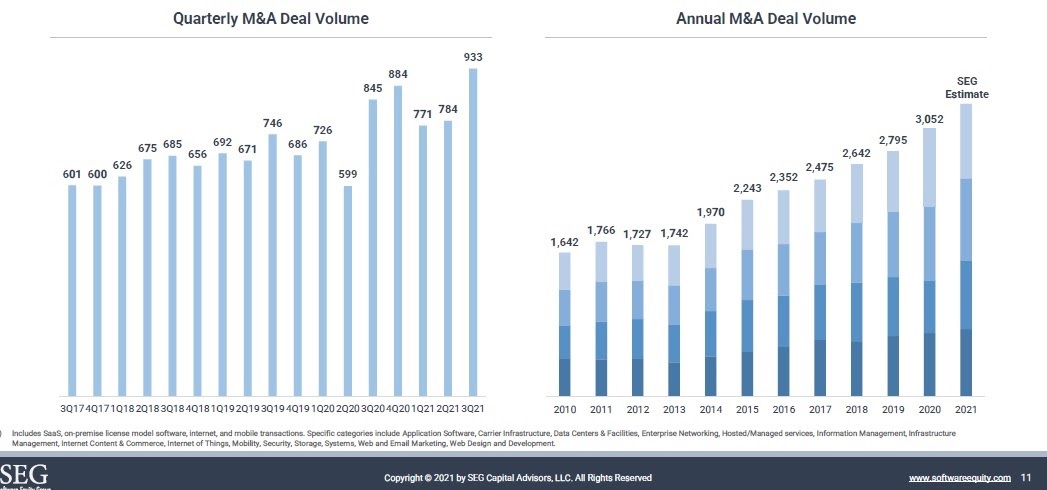
M&A is another example of involuntary churn. When a company is acquired, they often have to adapt the core infrastructure solutions of their new corporate parent. When a company is divested they often have to replace their former owners’ infrastructure software – often they adopt more affordable solutions.
Outages/Customer Service
Frequent outages or poor customer service are often cited as a reason customers churn. If you rely on a mission-critical SaaS solution for your business, unplanned outages can be disastrous. Once my SaaS company had a three-day outage that resulted in several plants of a Japanese auto manufacturer to shut down because our solution that enabled their just-in-time inventory system to fail. Needless to say, they were not a customer for log.
Poor customer service is another reason why some customers churn. While most firms have grudgingly adapted to using email, chat, or websites to create customer support tickets. Many have not. .Long response times, long elapsed-time-to-resolve tickets, being forced to use online knowledge bases can drive customers to seek more responsive vendors. A pattern of not appropriately resolving issues has forced many customers to seek a new provider.
Onboarding/Time-to-Value
A certain percentage of customers churn because of problems experienced during the onboarding process or the length of time it takes the customer to realize value from the solution. These problems are often intertwined. The best SaaS retention occurs when a customer can quickly and easily the benefits or value of the solution. The longer it takes to reach this ‘golden moment” the higher the churn will be.
Price
When you talk to most enterprise B2B SaaS sales teams, they will tell you that price is always a problem when it comes to renewal. Enterprise SaaS marketing teams say that the sales team has a hard time selling the value of the solution.
When it comes to renewals, price is a major issue. For SaaS companies that offer month-to-month contracts that can be canceled at any time price is always a major issue. Customers can continuously check prices. If switching costs are not too high, customers will jump for materially lower prices.
Experience has shown that enterprise sales teams will often cite price as a primary driver of churn. Experience has shown that generally is not the case. Most churn is caused by several factors, price is just one of them.
Commercial Practices
Commercial practices are one of the most common and self-inflicted reasons for customer churn. Practices like prepaid subscriptions, feature bundling, the requirement to accept standard contracts, etc. can lead to friction with customers and churn.
Here’s an example of self-inflicted churn due to commercial practices. I conducted an engagement for an enterprise SaaS firm. They were interested in why customers were not upgrading from their entry-level offering to new packages. We conducted a number of in-depth qualitative interviews with customers who had upgraded and those that did not.
Most were very dissatisfied with upgrade options. Many felt that the upgrade packages included add-on products that they saw little to no value in. The pricing was based on the number of modules purchased and a transaction limit. The entry-level offering had three modules and 10,000 transactions a month. Transactions above 10,000 were billed at $0.05 a transaction. The smallest upgrade was four times the cost of the entry-level package. The upgrade included six additional modules and 45,000 transactions a month. Customers rejected the upgrade 80% of the time. They saw little value in the extra modules and rejected the effective per-transaction price increase. Many customers moved to a solution that offered significantly lower transaction costs but also had lesser functionality. They accepted the trade-off.
This SaaS company also had a program for flagging customers who exceeded their monthly transaction quota. After two months they sent them an ‘improper use’ letter and told them they needed to move to an upgraded package that included higher transaction quotas. Most customers chose to do one of two things. First, they reduced their monthly transactions. Secondly, they adopted a competitive solution that offered significantly lower transaction costs. They accepted lower functionality in exchange for lower transaction costs.

Numbers Tell You How Big Churn is, But Not Why It Is Happening
Calculating gross retention or net dollar retention is fairly straightforward. Understanding why it is happening is a lot harder. Experience has shown that there are usually multiple factors that drive a customer not to renew their service. When you rely upon one source of information, such as sales or customer service, to describe why customers are not renewing, you tend to get biased answers. The best approach is to speak to the customers themselves.
Win-Loss Analysis is a qualitative research technique that has proven to be a great way to get to the real reasons why customers are churning. The main focus of Win-Loss Analysis is interviews with people who participated in the decision-making process During the interviews, a series of open-ended questions are asked. The goal is to understand why the prospect/customer acted the way they did. Usually, product managers or external consultants conduct the interviews. Customers are often reticent to be candid when a=the interviews are conducted by sales or customer service personnel.
The Win/Loss Process
Win-Loss Analysis is a market research technique companies can use to discover key learnings from customers and prospects. These learnings can then drive improvements in marketing and sales, resulting in more revenue and profits. A typical Win/Loss project consists of five major steps:
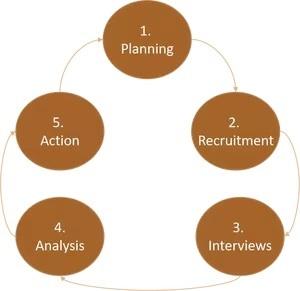
1. Planning
The first step of the process is to do all of the preparatory work required to ensure the success of the project. An important first step is setting research objectives. Setting clearly defined Research Objectives will help you to both target your Win/Loss research as well as set expectations for the success of the program. And be sure to align your Research Objectives with the strategic goals of your organization. There is no sense chasing information from buyers that your organization has no interest in anyways. Research objectives may include:
- Your Product-Market-Price fit
- New market problems that your organization can solve
- Your service levels
- Persona refinement
- Buyer purchase-decision process
- Marketing channel effectiveness
- Sales process
- Communication style
- A better understanding of your place in the competitive mix
In addition to establishing your Research Objectives, you should also define the questions that will be asked during the interviews. The questions should be open-ended and designed to encourage a free-flowing discussion.
Finally, you will need to design the process you will use to recruit potential interviewees, conduct the interviews, analyze and report the results you have learned. The plan should lay out the roles and responsibilities of each participant in the project. You should also develop a schedule and a simple status reporting mechanism so everyone can stay up to date. Create a project charter that contains the research objectives, interview questions, roles, responsibilities, and schedule. Conduct a review meeting with the participants to approve and commit to the plan.
2. Recruitment
The next step in the process is to recruit people for the interviews. Most companies target a mix of net new customers and existing customers who have upgraded or expanded their use of products. You are looking for a mix of won deals and lost deals. Most Win/Loss Analysis projects with a single research objective try to get 15 to 20 interviews.
A portfolio approach to soliciting interviews works best. The tactic that has the highest success rate is when a salesperson makes a personal outreach to a potential interviewee. Generally, 25% to 40% of these contacts will convert to an interview. The second most common approach is email. Organizations pull a list of candidates from their CRM or sales force automation system and then email them asking for participation in the project. This approach performs like most email campaigns – a 20% open rate and a 2% to 5% click-thru rate. 50% of those who click-thru convert to interviews. The final tactic is to do phone follow-up with contacts that opened the email but did not click thru. This tactic performs like telemarketing campaigns – a 1% to 2% success rate.
Most Win/Loss Analysis programs use incentives to encourage targets to commit to doing the interview. Companies offer a $25 or $50 gift card. This provides the interviewee with something tangible in exchange for their valuable time.
The biggest challenge many Win/Loss Analysis projects face is recruiting enough quality interviewees. Sending cold non-personalized emails to all of the CRM contacts associated with a customer tends not to be successful. What happy customer wouldn’t want to do a short interview and get a $50 VISA gift card? A lot fewer than you would expect. Experience has shown that a portfolio approach that combines warm introductions, multiple emails, and phone call follow-ups works best.
Sometimes when a Win/Loss Analysis project has problems in getting sufficient interviews to reach the research objectives. Teams will then increase the interview incentive to $75 or even $100. While this may spur more people to respond to the solicitation, often these individuals are only interested in the incentive payment. These individuals may only have limited exposure to the product and may not have been involved in the actual sales process. This risk can be reduced by selecting the best candidates to target with the solicitation. Sending an email blast to every contact from a company in your CRM system will not produce the quality results you are looking for.
3. Interviews
The core activity of the project is conducting interviews. Most interviews take 20 to 30 minutes to complete. Companies use internet meeting services that facilitate the interview scheduling process, but also allow the discussion to be recorded. This enables the interviewer to focus on the discussion instead of trying to listen and take notes at the same time. There are services that will transcribe the recordings for you into a Word document for about $1 minute.
Experience has shown that interviewees are more comfortable talking to an independent third party instead of a representative from the company. This results in a free and easy discussion. It also avoids making embarrassing or disparaging comments about their experiences or opinions.
A critical aspect of the interview process is asking why a customer believes certain things they say. Surveys and checklists are one way to get customer feedback, but they lack the ability to follow up on interesting statements. The real value of using experienced interviewers is that they can follow up and explore why a customer believes specific things. Often this is the most valuable outcome from the interviews.
4. Analysis
After the interviews are completed, the recordings are transcribed. Next, the team reviews the transcripts to identify common themes. These themes are analyzed and documented in a final report. The report contains a summary of the interviewees – company size, interviewee title, transaction type (new/upgrade and win/loss). For each theme or finding, specific quotes from the interviews are included. This lets the report’s reviewers hear, from the customer’s perspective and in their voice, the exact point they were trying to make. A meeting is held with all of the interested internal organizations to review the report’s findings and conclusions.
5. Action
The final step is to take action on the recommendations. Effective Win/Loss Analysis programs are really part of a cycle to drive improvements in the business. Win/Loss Analysis is a variant of the Six Sigma DMAIC (Define, Measure, Analyze, Improve, and Control) methodology. If action is not taken based on the recommendations from the interview analysis then an opportunity to fundamentally improve your business will be missed.
Summary
Churn is a fact of life for B2B SaaS product managers. Understanding the scale and divers of churn is critical. Product managers can make better prioritization decisions with an accurate understanding of how big churn is and the reasons that are driving it. While calculating churn is pretty straightforward., understanding the real reasons behind it is much harder. Qualitative research techniques like Win-Loss Analysis is a great mechanism to learn the facts driving churn. It can also provide actionable intelligence that can be used across the enterprise.
Also published on Medium.