


Monitoring Tools are Not a Focus for Java Developers
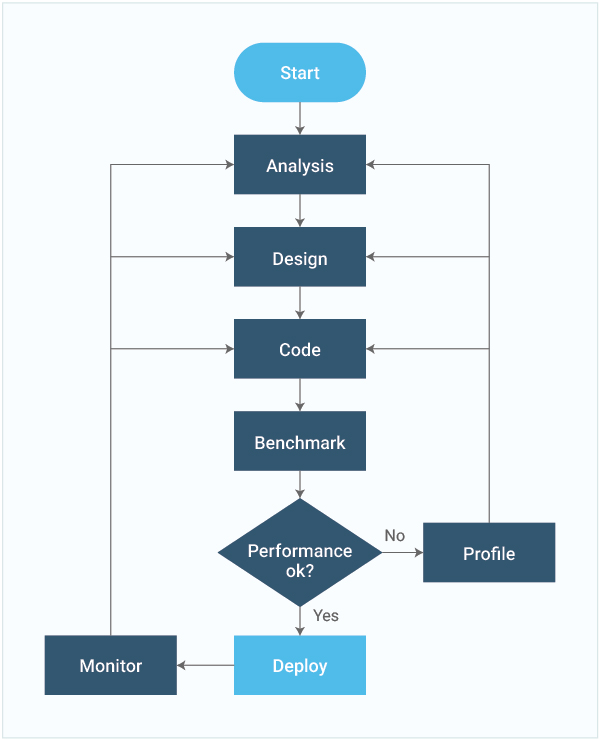
Software developers are often only concerned about the functionality of their applications. When these applications are deployed in production, scalability and performance issues surface and application developers then have to worry about performance. Many a times, such situations warrant a complete restructuring of the application code, causing significant impact to new rollouts and current users. Performance considerations when assessed during the development phase itself can significantly reduce the time from delivery to stability of applications in production.
What are Java Monitoring Tools?
Java monitoring tools track the availability and performance of Java applications. From an availability standpoint, Java monitoring tools track if the application is up or down, and from a performance standpoint, they track the throughput (requests served) and responsiveness (latency) of the application. To assist in troubleshooting Java application performance slowness, Java monitoring also track the internals of the application including how well the Java virtual machine (JVM) is performing, whether the Java web container (e.g., JBoss, Apache Tomcat) is functioning well and the performance of individual Java transactions to detect hotspots in the application code.
Challenges with Monitoring Java Applications
Java applications pose unique challenges:
- Garbage collection: Java provides automatic memory management, therefore, the developer does not have to manually dispose obsolete objects. At the same time, garbage collection has a cost: too many collections will take its toll on performance.
- Multi-threading: While multithreading enables parallelism and faster processing, it can also result in a number of performance anomalies. Deadlocks, thread leaks, and high CPU threads can all slow down the Java application.
- Data access: Java applications often rely on database servers for data access. When queries issued by the Java application take time, users will see slowness. When such an issue happens, IT administrators will need to determine whether the slowness is due to a query that is not properly framed or whether the slowness is due to a bottleneck on the database server.
- Calls to external services: Java applications may involve HTTP/web services calls to external services. To optimize Java application performance, it is important to identify times when the application becomes slow due to a call to a third-party service.
This blog post is about popular tools you can use to monitor Java application performance.
Top Free Tools for Monitoring Java Applications
There are a number of free utilities that can be used to monitor the performance of Java applications:
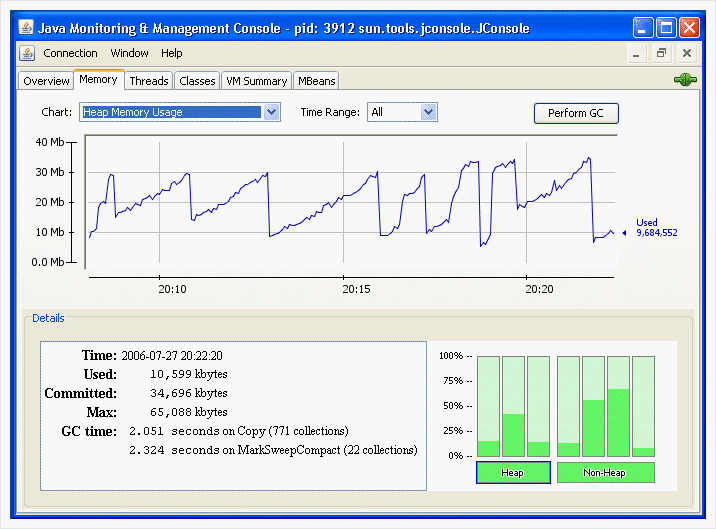
- JConsole: JConsole was the first built-in monitoring tool for Java Virtual Machines (JVMs) and complies with the Java Management Extensions (JMX) specifications. JConsole uses extensive instrumentation of the JVM to provide information about the performance and resource consumption of applications running on the Java platform.By connecting to a JVM’s JMX port, administrators can use JConsole to see what threads are running in the JVM, how many classes are loaded in the JVM, how high is the memory usage of the JVM, etc.

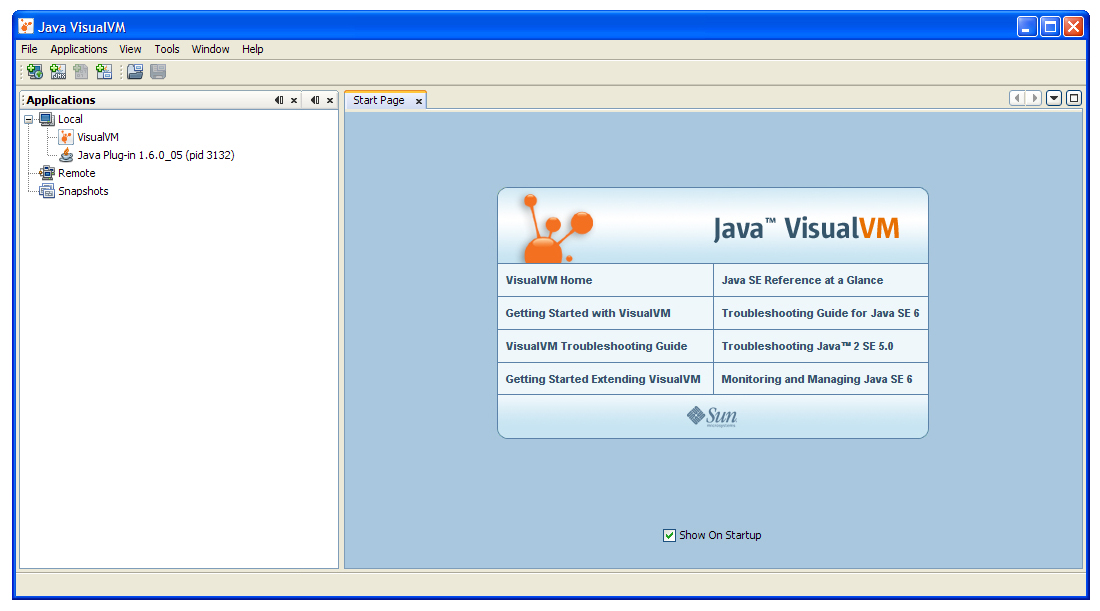
The JConsole user interface - Java VisualVM: It is the more modern built-in monitoring tool for Java Virtual Machines (JVMs). It provides a visual interface for viewing detailed information about Java applications, and for troubleshooting and profiling these applications. Various optional tools, including Java VisualVM, are provided with the Java Development Kit (JDK) for retrieving different types of data about running JVM software instances. For example, most of the previously standalone tools, such as JConsole, jstat, jinfo, jstack, and jmap are part of Java VisualVM.Java VisualVM federates these tools to obtain data from the JVM software, then re-organizes and presents the information graphically to enable you to view different data about multiple Java applications uniformly whether they are running locally or on remote machines. Furthermore, developers can extend Java VisualVM to add new functionality by creating and posting plug-ins to the tool’s built-in update center.
Java VisualVM can be used by Java application developers to troubleshoot applications and to monitor and improve the applications’ performance. Java VisualVM can allow developers to:- Generate and analyze heap dumps
- Track down memory leaks
- Browse the platform’s MBeans, and perform operations on those MBeans
- Perform and monitor garbage collection
- Perform lightweight memory and CPU profiling
Java VisualVM was first bundled with the Java platform, Standard Edition (Java SE) in JDK version 6, update 7.

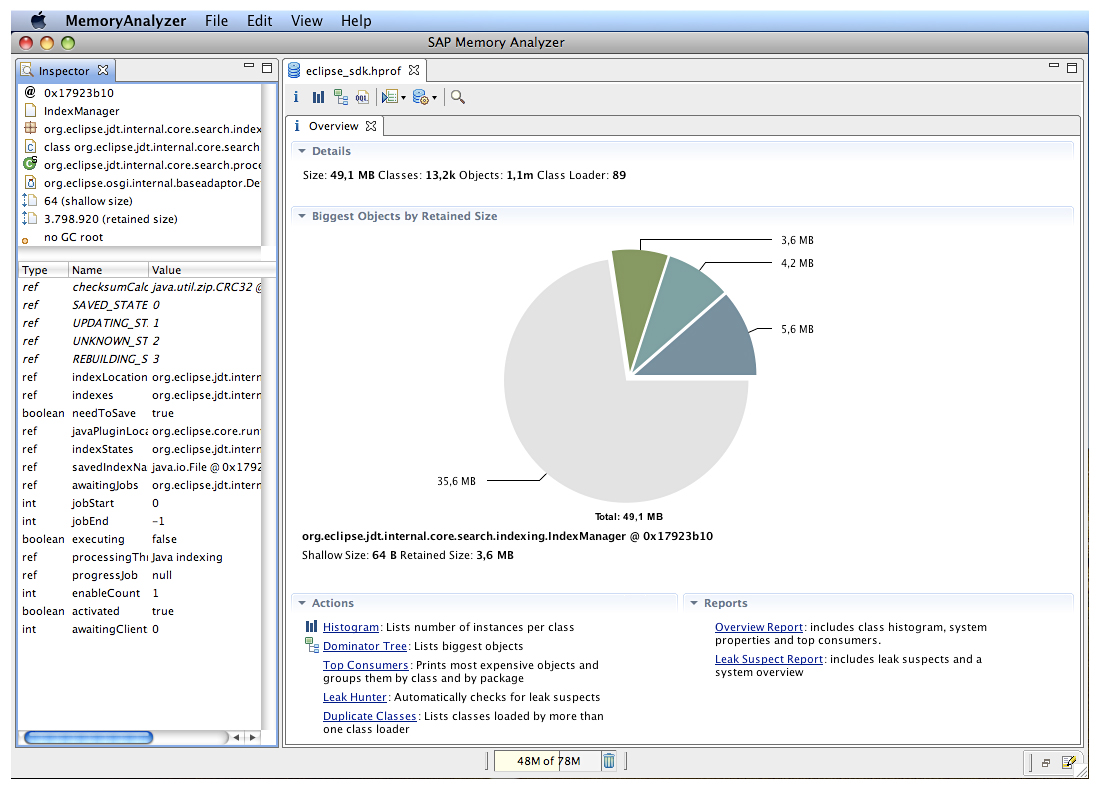
The JVisual VM GUI - The Eclipse Memory Analyzer for analysis of Java Heap Memory: One of the most important metrics to monitor on a Java-based system is memory. Essentially, all Java objects are stored in an area called the heap. When an application runs, the heap’s storage will fluctuate in size. If the heap becomes full, objects are discarded to make room. But if your heap is always near its maximum configured limit, you run the risk that too much time will be spent finding and clearing memory in the heap for new requests and this will slow down the Java application’s performance.The Eclipse Memory Analyzer is a full-stack Java heap analyzer specifically designed to help developers allocate memory consumption and set policies. Developers can use the Memory Analyzer tool to analyze heap dumps even when millions of objects are passing through. They can also calculate the retained sizes of objects to help ensure the garbage collector is collecting the right objects from the heap. IT teams can also generate ad hoc reports to extract leak suspects.

Eclipse Memory Analyzer analyzes heap dumps to identify top consumers of memory in a JVM
Pros and Cons of Free Java Monitoring Tools
 The main advantage of the above-mentioned free Java monitoring tools is that there is no cost to deploying these tools. Java developers and administrators are familiar with these tools and can use them.
The main disadvantage of these tools is the need for manual intervention. An administrator needs to analyze snapshots of threads in the JVM manually. Likewise, a heap dump has to be obtained and then manually input to MAT. The output has to be interpreted to determine whether there is a memory leak in any of the Java applications deployed on the JVM. In a sense, these free tools are similar to the Performance Monitor utility in Microsoft Windows OS. Performance Monitor is a free utility, which can be easily accessed but a lot of manual work is required to extract useful metrics from this tool and to analyze them.
Yet another challenge is scalability. While it may be possible to analyze one JVM with JVisualVM, what happens when a production environment has 100s of JVMs? It is not practical for any administrator to be manually analyzing their performance.
A third challenge is the lack of support for post-mortem diagnosis. Often, when production issues occur, administrators may restart their application servers to overcome the issue for the time being and make sure that users are not affected. All of the above tools provide a live snapshot of performance. They do not have ways for analysis of past history to determine what may have happened in the past to trigger a problem.
Finally, note that all of the above tools focus on the performance of the Java Virtual Machine. The JVM is only one component of a Java application. Issues in the application code or its external dependencies (database servers, third-party services, etc.) can also affect Java application performance.
eG Enterprise: Full-Stack Java Application Performance Monitoring
 The eG Enterprise solution from eG Innovations addresses the above limitations of free JVM monitoring tools. A single agent on an operating system monitors all JVM instances running on it and all the applications they support. From the eG Enterprise console, administrators can monitor:
- The JVMs
- The application servers/containers that are running on the JVMs
- Transactions of applications deployed on these servers/containers
Using JMX, eG Enterprise collects all key performance indicators (KPIs) from the JVM. These KPIs are polled periodically and stored in a relational database for historical analysis. Using this repository, administrators can look at live metrics as well as review historical metrics for post-mortem analysis of problems. All the key JVM parameters including GC performance, heap and non-heap memory usage levels, class loading/unloading, uptime of the JVM, thread activity, and resource usage are monitored.
The performance of Java application servers/web containers, such as Tomcat, JBoss, WebLogic, and WebSphere also affects the performance of the application. For instance, if the capacity of an application server’s thread pool is insufficient, application requests may be stalled when connecting to the server. eG Enterprise embeds out of the box monitoring capability for all popular Java application servers.
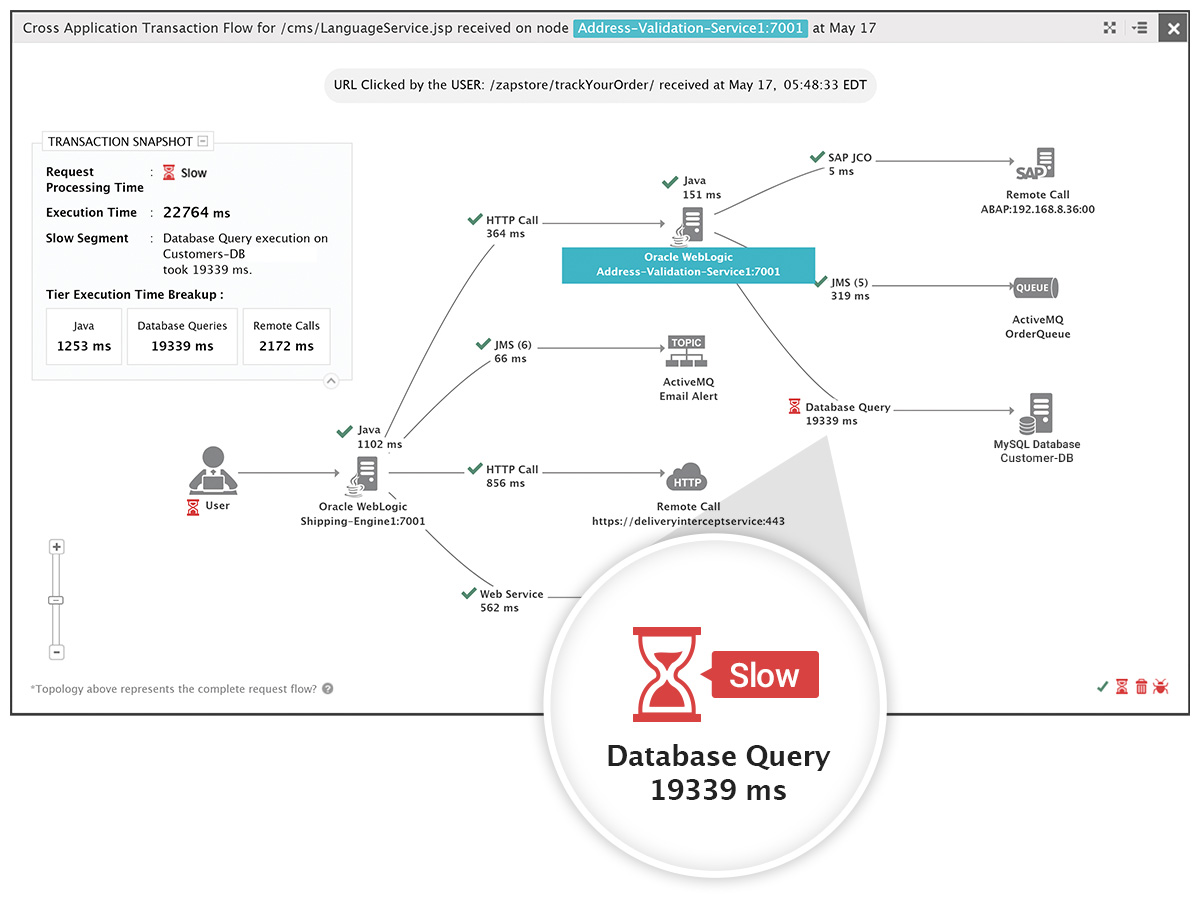
Using byte-code instrumentation, eG Enterprise also monitors details of application processing, without requiring Java applications to be re-written to support monitoring. Light-weight instrumentation added to the JVM allows eG Enterprise to track processing of all requests. Based on response times, requests are categorized into healthy, slow, and stalled requests. A tag and follow mechanism is used to understand Java processing across tiers and a transaction flow graph is obtained for each slow or stalled request, highlighting what caused slowness – is it in the Java code, database query, or external web services call?

eG Enterprise is an Observability solution for Modern IT. Monitor digital workspaces,
web applications, SaaS services, cloud and containers from a single pane of glass.


