7 Best Product Analytics Tools for SaaS Growth Insights

Driving product growth requires a keen understanding of user behavior, feature adoption, and performance metrics. To achieve this, you need more than just intuition—you need data-backed insights from product analytics. That’s when you need solutions for the job.
In this article, we’ve curated a list of the 10 best product analytics tools to provide you with the valuable data-driven insights you need to supercharge your product’s growth strategy.
TL;DR
- Product analytics tools are software solutions that help you collect and analyze user interaction data within a product for actionable insights.
- When looking for suitable product analytics tools, you should ensure your go-to choice has features such as event based analytics, qualitative insight capturing, charts, and integration support.
- With that being said, here are the best 7 product analytics tools to help your product teams drive growth:
- Userpilot is a product growth platform that lets you look at granular product analytics such as which features have the highest adoption rates and big-picture insights using trends or funnel analytics.
- Pendo is a product adoption platform that lets teams monitor product usage, track user behavior, and publish in-app guides.
- Heap is packed with features that help you track real-time product data using Live data feed.
- Mixpanel supports both mobile and web apps, and it’s an analytics tool of choice for product teams across the globe, regardless of the company size.
- Baremetrics is a subscription analytics and insights management platform. It helps businesses get hundreds of valuable metrics and insights, achieving real-time growth.
- If you are looking for a free product marketing analytics tool yet free, Google Analytics is the right fit. It comes with features like event-tracking, analytics reports, etc.
- However, if you need an analytics option that also allows you to act on collected data, book a Userpilot demo to see how it empowers you!
![]()
Try Userpilot for Collecting and Analyzing Product Data!

What are product analytics tools?
Product analytics tools are software applications used to collect, analyze, and interpret data on how users interact and behave within a product.
They are primarily used to gain insights into user engagement, measure feature adoption, and make data-driven decisions to improve the product’s performance and user experience.
Must-have features for product analytics tools
Here are the features to consider while opting for a product analytics tool:
- Event tracking: Allowing you to capture both no-code and server-side event.
- Capture both quantitative and qualitative data (i.e. survey or session recordings).
- Analytics dashboards: Having different analytics dashboards to monitor user behavior with options to view and break down data in different ways.
- Segmentation: Sending product offerings, in-app messages, or trigger flows by segmenting users based on various attributes such as demographics, behaviors, product usage, user feedback, etc.
- Integration support: Can connect with other data sources through integrations or webhooks for a more well-rounded understanding.
Best product analytics software tools to gain actionable insights for SaaS
In your pursuit of driving product growth through data-backed insights, it’s essential to have the right tools in your hands. In this section, we’ve handpicked the top 7 product analytics tools tailored for SaaS businesses.
We’ll go into each tool’s main analytics features and its pricing to help you decide if it’s the right fit for your business!
Userpilot
Userpilot is a product growth platform that drives user activation, feature adoption, and expansion revenue. It also helps product teams collect user feedback, streamline onboarding, and gather actionable insights from analytics.

With Userpilot, you’ll be able to track product usage and collect user behavior data to get a holistic view of how customers use your product — which will guide future development, improve the user experience, and inform your growth efforts.
Main features for product analytics
Userpilot lets you look at granular product analytics such as which features have the highest adoption rates and big-picture insights like trend reports.
Here are Userpilot’s top product analytics features for product and marketing teams:
- Feature tagging: Userpilot’s click-to-track feature tagger lets you view how many times a feature has been used and by how many users to measure its adoption. Users on the Starter plan can add up to 15 feature tags while those on the Growt or Enterprise tier can create unlimited tags.

- Trends and funnels: Userpilot’s trends and funnels report lets you extract actionable insights from big data. You’ll be able to see which stage of an onboarding conversion funnel most users drop out on and create trend reports with detailed breakdowns by user or time period.

- Saved reports: The saved reports analytics dashboard shows you all the reports you’ve created and lets you filter, export, or delete any reports in a single click. In addition to adding filters or sorting by report type, you can also edit or duplicate reports to help you review analytics.

- Analytics integrations: Userpilot integrates with some of the most popular analytics tools like Amplitude, Mixpanel, Segment, Google Analytics, and more. This makes it possible to sync product analytics both ways between the tools in your tech stack.

Pricing
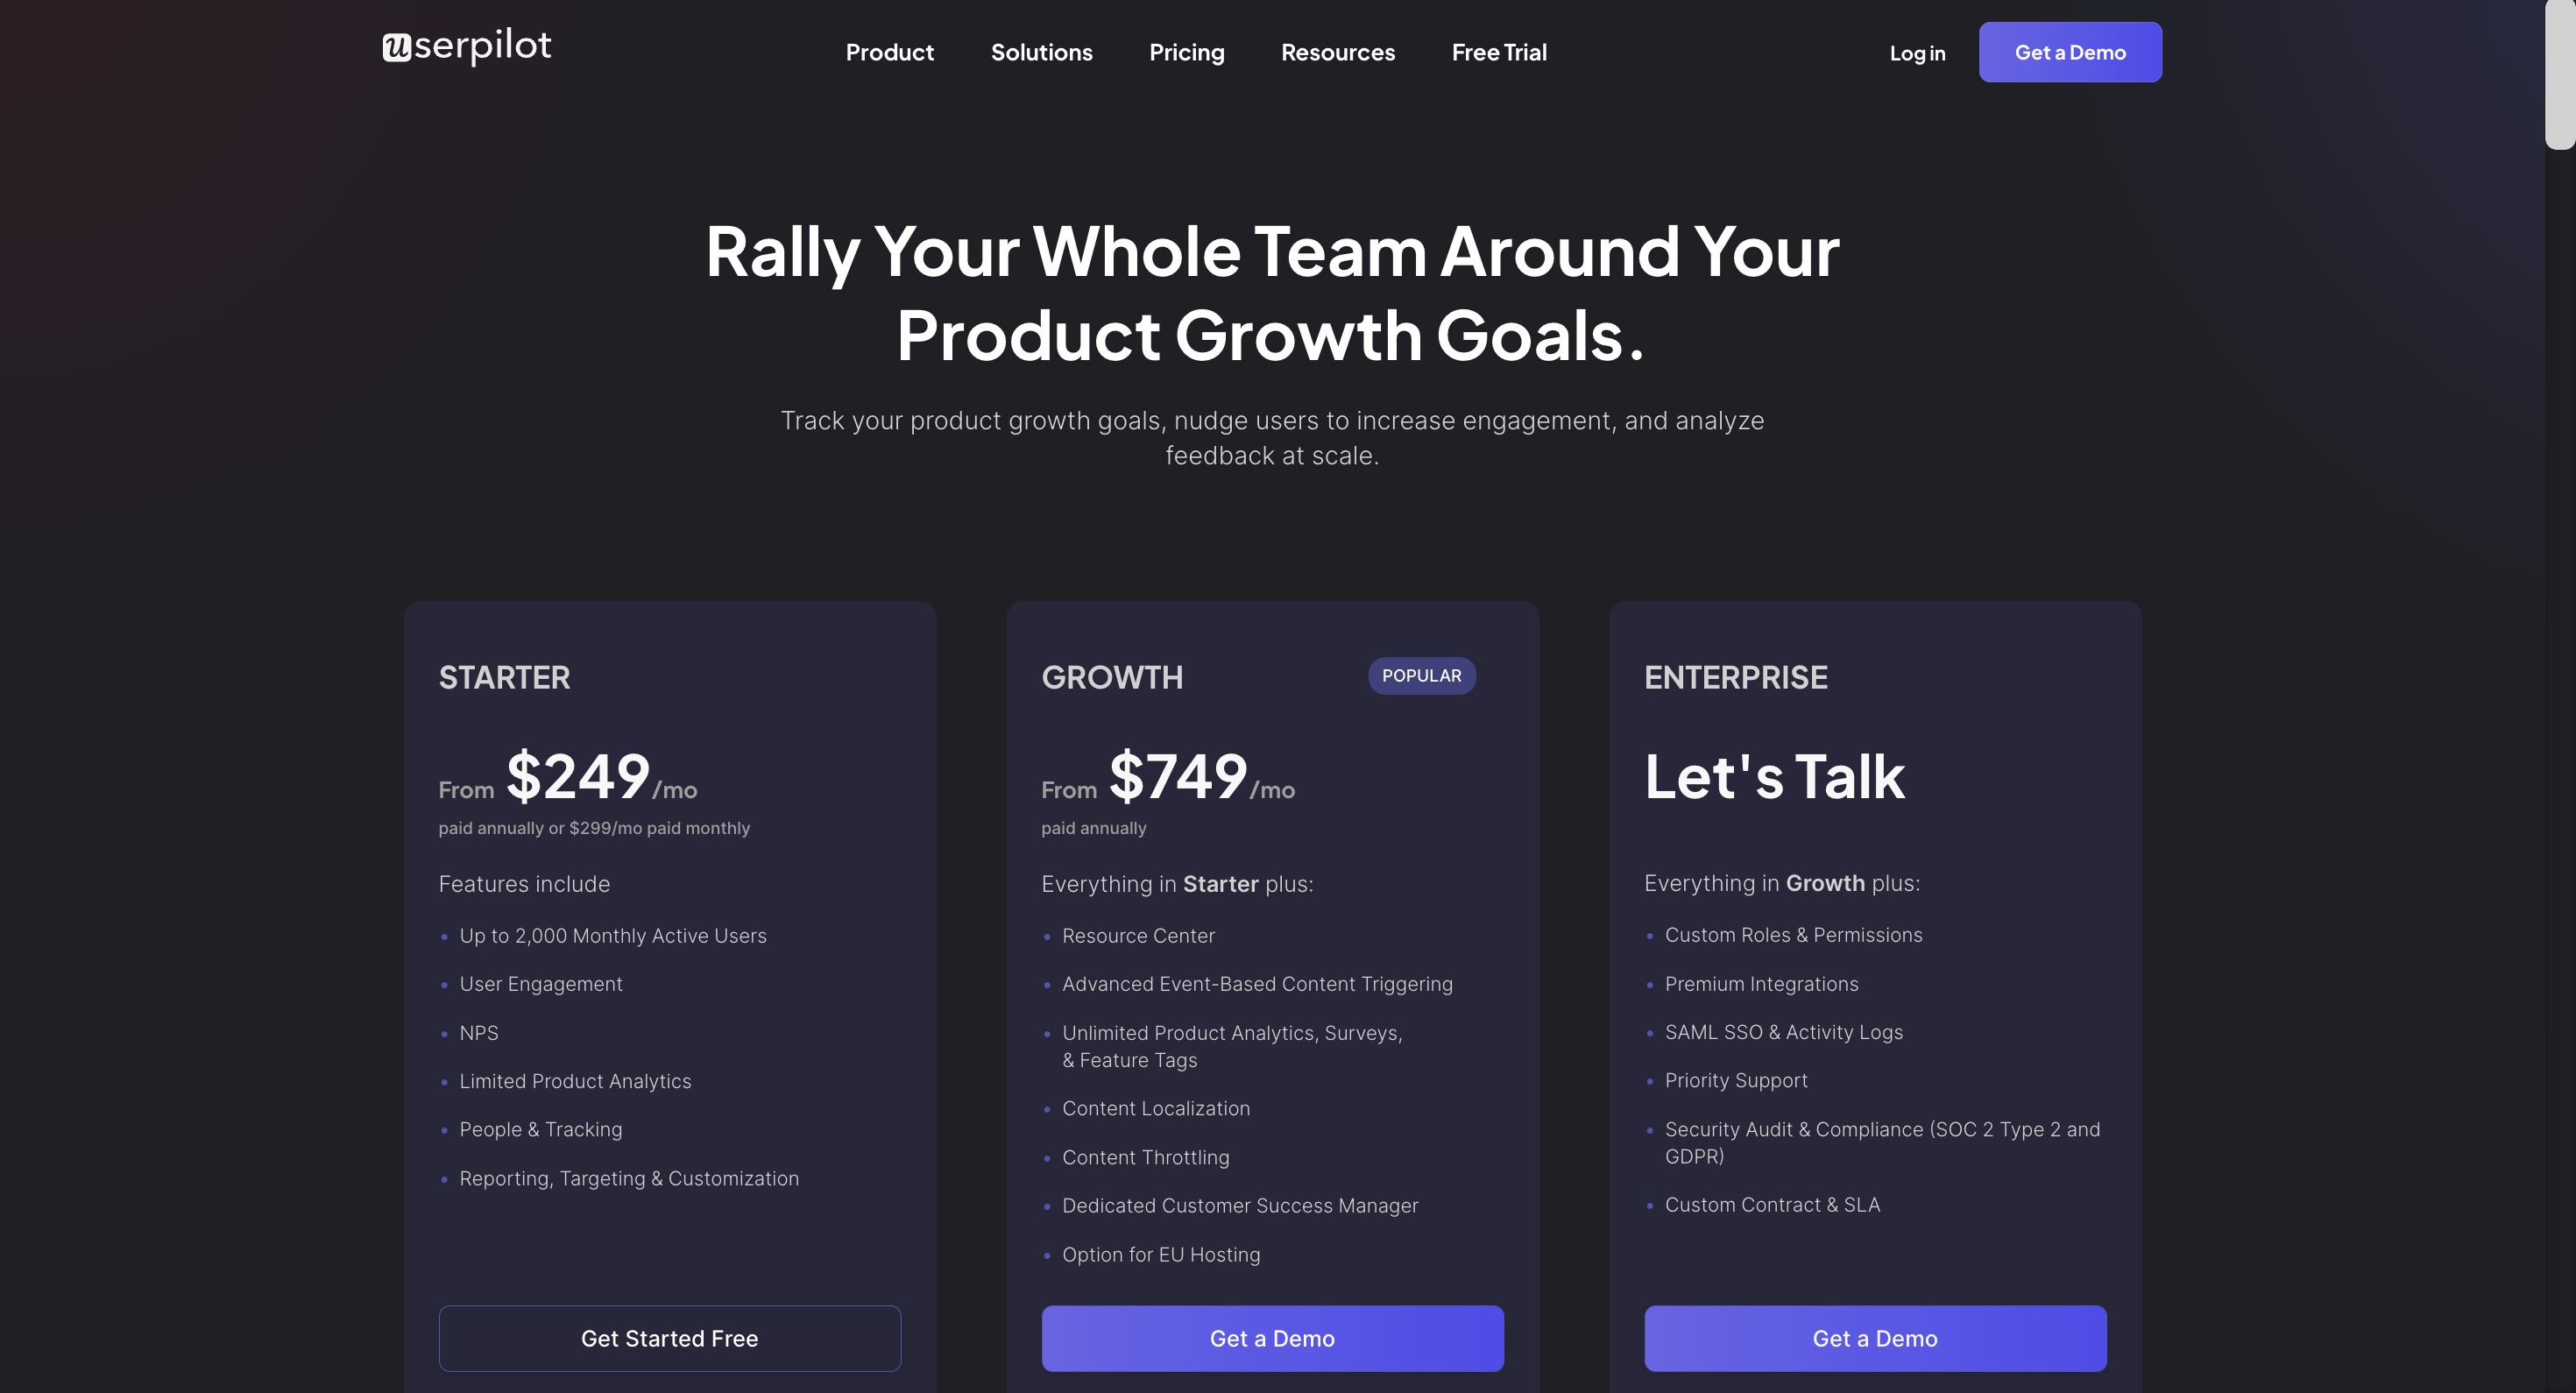
Userpilot’s transparent pricing ranges from $249/month on the entry-level end to an Enterprise tier for larger companies.
Furthermore, Userpilot’s entry-level plan includes access to all UI patterns and should include everything that most mid-market SaaS businesses need to get started.

Userpilot has three paid plans to choose from:
- Starter: The entry-level Starter plan starts at $249/month and includes features like segmentation, product analytics, reporting, user engagement, NPS feedback, and customization.
- Growth: The Growth plan starts at $749/month and includes features like resource centers, advanced event-based triggers, unlimited feature tagging, AI-powered content localization, EU hosting options, and a dedicated customer success manager.
- Enterprise: The Enterprise plan uses custom pricing and includes all the features from Starter + Growth plus custom roles/permissions, access to premium integrations, priority support, custom contract, SLA, SAML SSO, activity logs, security audit, and compliance (SOC 2/GDPR).
Pendo
Pendo is a product adoption platform that lets teams monitor product usage, track user behavior, and publish in-app guides. The no-code solution focuses on increasing user engagement and driving feature discovery.
Additionally, Pendo also lets you survey users, segment customers, and see how many site visitors or MAUs your web app is getting. Certain features like product areas, data explorer, product engagement score, and resource centers are locked to the Starter plan or higher.

Main features for product analytics
A few Pendo analytics features worth highlighting include:
- Dashboard Widgets: There are 26 different analytics widgets that you can add to your Pendo dashboard. These widgets can track feature adoption, guide engagement, user sentiment, and cohort data like which operating system is being used.
- Saved Reports: Pendo lets you view all the user behavior reports you’ve created from a single screen. Unfortunately, you won’t be able to create reports using the data explorer feature unless you upgrade to the Growth or Portfolio plan.
- Cohort Retention: The retention analytics dashboard on Pendo helps you visualize the churn rate for each cohort on a weekly or monthly timescale.

- Data Explorer: Pendo’s data explorer lets you create event groups that can combine data from multiple apps, events, or guides. The data explorer also comes pre-loaded with formulas for sums, ratios, and relative percentages to speed up the data analysis process. Note: The data explorer feature is only available on the Growth and Portfolio plans.
Pricing
Pricing for most paid Pendo plans (except Starter) is only provided on a quote basis and there are no listed price ranges on the solution’s website. That said, certain reviews have stated that prices start at upwards of $20,000 per year for a single product and more than twice that for higher plans.
Pendo has three paid plans and one free version that is limited to 500 MAUs which makes it accessible to startups but difficult to scale in the long run.
Heap
Heap is a robust product analytics platform that provides users with a plethora of in-depth insights into customer behavior and needs. With Heap, you can track user interactions in real-time across all touch points within your product.
Insights from Heap help you dig deeper into the paths users take when navigating your product and identify precise points of friction. Plus, the platform uses sophisticated data science capabilities to help you make better-informed, data-driven decisions to improve user experience.

Main features for product analytics
As a cutting-edge product analytics tool, Heap is packed with features that help you monitor product usage, activation, and adoption.
Here’s how Heap facilitates seamless product analytics:
- Once you install Heap’s code snippet into your product, it automatically starts tracking user actions. You can access this raw data on your Heap dashboard and label the most relevant events.

- You can use the Live data feed for a glimpse of how users move through your product in real-time. This makes it easier to identify and eliminate roadblocks.
- You can use Session Replays to monitor the exact journey a user takes within your product.
- Other product analytics features that come in handy include Usage Over Time, Journey Maps, Funnel analysis, Retention analysis, and Heatmaps.
Pricing
Pricing for Heap is available on request. You’ll have to contact the sales team for a quote. The final price will depend on various factors, including the number of sessions and integrations you need.
That said, Heap offers a free plan that lets you track up to 10,000 user sessions per month and stores your data for 6 months. Review platforms like G2 say that paid plans start at $3,600 per year. All paid plans come with a 14-day free trial, too.
Mixpanel
Mixpanel is a simple and powerful product analytics tool that allows product teams to track and analyze in-app product engagement. It allows your team to see every moment of the customer experience clearly, so you can make changes that work.
In addition, it lets you explore data freely without using SQL. Set up your metrics to measure growth and retention. Slice and dice data to uncover trends and see live updates on how people use your app.

Main features for product analytics
It supports both mobile and web apps, and it’s an analytics tool of choice for product teams across the globe, regardless of the company size.
Mixpanel product analytics functionalities work based on:
- User segmentation: User segmentation is the bedrock of effective product analytics in Mixpanel. You can divide your user base into distinct groups based on attributes, behaviors, or properties and uncover meaningful trends and preferences among various user groups.
- Funnel analysis: Mixpanel’s funnel analysis feature allows you to create sequences of events that users should ideally complete. This helps you gain insights into where users drop off and where they progress.
- Retention analysis: With the retention analysis feature, you are able to track how often users return to your application after their initial interaction.
Mixpanel offers a free plan with very advanced product analytics functionality but no engagement layer or feedback features like that of Userpilot.
Pricing
Mixpanel’s pricing plan is divided into 3 plans; the starter plan, the enterprise plan, and the growth plan.
Here’s an overview of the pricing plans and features of each plan:
- Starter plan: This plan features essentials to find product-market fit. It is free and allows up to 20M monthly events.
- Growth plan: This plan costs $20+ per month for up to 100M monthly events. You get all features in the starter plan plus unlimited saved reports to monitor, update, and iterate on KPIs, Mixpanel modeling layer, and group analytics and data pipeline add-ons.
- Enterprise plan: This plan empowers your team, especially if you have a large organization. It costs $833+ per month for up to 5M-100M+ monthly events.
Amplitude
Amplitude is a powerful analytics tool that gives organizations in-depth, real-time insights into product usage and user behavior. It offers various features, including event segmentation, funnel analysis, user cohorts, and retention analysis.
With Amplitude, you can create a custom dashboard to collate multiple charts and reports on a single page. Amplitude’s robust behavior analytics help product and growth teams improve product adoption, identify new monetization opportunities, and maximize customer lifetime value.

Main features for product analytics
As a digital analytics platform, Amplitude is designed to provide you with a plethora of useful product-related insights. Whether you want to assess feature adoption or track conversions, Amplitude’s powerful analytics eliminate guesswork from the process. You can share these real-time analytics among different teams to facilitate collaboration.

The features that facilitate seamless access to product analytics include:
- Automated report generation (with actionable insights)
- Instant visualizations (to map user journeys and understand product usage)
- Event recommendation (so you know what events and metrics to track)
Pricing
Amplitude offers three distinct pricing tiers:
- Starter – A free plan suitable for small teams.
- Growth – Suitable for teams that need to scale fast; pricing is available on request and depends on your requirements.
- Enterprise – Includes advanced governance and security features; pricing is available on request.
However, it’s worth noting that Amplitude’s pricing plans are complex because they’re based on the number of monthly events or features. Other tools like Mixpanel and Userpilot offer more transparent pricing based on the number of monthly active users.
Baremetrics
Baremetrics is a subscription analytics and insights management platform that helps businesses get hundreds of valuable metrics and insights, achieving real-time growth.
This software is the easiest way to get the insights you need to understand your performance and where to focus next.

Main features for product analytics
Baremetrics primarily focuses on subscription analytics, but it does offer some user analytics features that can be helpful:
- User segmentation: With Baremetric’s new segmentation, you can create and save groupings of all your customers in seconds. Baremetrics allows you to segment your user base based on various criteria such as subscription plans, location, signup date, etc. This segmentation helps you understand different user groups and their behaviors.
- User churn analysis: When you are tracking user cancellations and the reasons behind them, Baremetrics helps you identify patterns in user churn. This information can be used to improve your product or service and address pain points that lead to cancellations.
- Trial insights feature: You can improve your conversion rates by monitoring exactly what’s going on while your customers are on trial. With trial insights, you will keep track of conversion rate, average trial length, active trials, and new trials with up-to-the-minute data.
Pricing
Baremetrics has 4 different plans ranging from a core suite of metrics to many modules that can supercharge your SaaS growth, reduce churn, recover failed charges, and plan for the future.
Here’s a brief overview of the features of each plan and their price tags:
Note: Each pricing plan value depends on your current MRR. So, we are using the $0K value as a benchmark to review the different plans.

- Metrics plan: $108/mo. Features include—smart dashboards, benchmarks, export data, data enrichment, etc.
- Recover plan: $58/mo. The pros of this plan include—Automated Email reminders to delinquent customers, recovery of more than your entire Baremetrics cost or next month is on them, and more.
- Cancellation insights plan: $108/mo. Features include customizing your reasons for cancellation, recovering more than your entire Baremetrics cost, personalized email questionnaires, etc.
- Forecast+ plan: With this plan, you can see intelligent MRR projections with configurable options. It is included with metrics. So what are the features? Connect to Quickbooks Online or Xero, generate financial models like P&L, Balance Sheet, and more.
Google Analytics
If you are looking for the best product analytics tool yet free, Google Analytics is the right fit. It is a web analytics service offered by Google that tracks and reports website traffic and mobile applications traffic and events, currently as a platform inside the Google Marketing Platform brand.

Main features for product analytics
Google Analytics isn’t just for web and user analytics; it’s also for product analytics. Businesses use Google Analytics to analyze user actions, website traffic, and product achievements.
Here are some ways SaaS companies can use Google Analytics for product analytics:
- Event tracking: You’ll find a number of auto-collected events that are mainly for marketing and conversion purposes, but you can also track product events by defining events and setting trigger conditions in Google Tag Manager.

- Product data import: The product data import feature is excellent for tracking user behavior and conversions. Users can import data into Google Analytics. This simplifies and reduces the amount of data you need to send by importing product data.
- Customer Journey Report: With charts like funnels and paths, you can allow you to visualize and analyze the steps users take before completing a desired action.
However, if you want to monitor how your product is performing, you may want to consider another product analytics software that allows you to collect user behavior data, filter it, display it in customized formats, and analyze it.
Pricing
It is a free product analytics tool with paid upgrades available for advanced features. It has two price plans: the free and 360 plans respectively:
- Google Analytics offers a free version that provides a wide range of features for basic website analytics. It’s suitable for individuals, small businesses, and websites with relatively low traffic.
- GA 360 (now GA4) provides higher data limits, BigQuery integration, service level agreements, and more with costs starting from $12,500 per month and $150,000 per year.
Conclusion
Product growth relies heavily on data-backed insights, making product analytics tools important assets for any forward-thinking business. These tools provide the means to dissect user behavior, optimize features, and enhance overall user experiences.
Want to get a comprehensive analytics solution and boost product adoption? Get a Userpilot demo to optimize the customer experience and drive growth.
![]()
Try Userpilot for Collecting and Analyzing Product Data!


