

Roses are red. Violets are blue. NPS is a leading indicator for retention—except it’s just not true.
It’s often taken for granted (even among long-time Customer Experience (CX) professionals) that Net Promoter Score (NPS) survey results correlate positively to retention. Sure, it may not tell you why a customer is happy or not happy. It may not provide any prescriptive actions for you to take, but it’s valuable because it’s one of the few basic metrics that’s truly predictive of future behavior—the likelihood a customer will retain.
But there are two main problems with that assumption:
- The NPS survey was never designed to predict churn
- The data does not support the idea of correlation to retention.
You can find out a lot more about NPS here, but the basic premise of it is a single survey question that asks a customer to rate how likely it is they’ll recommend a given product or service to a friend or colleague on a scale of zero to 10. Nines and 10s are considered “promoters,” sevens and eights are “neutral,” and anything lower is a “detractor.”
Take the percentage of promoters minus the percentage of detractors, and wham bam—you’ve got yourself an NPS score.
You’ll notice that nowhere in the question does the survey mention “renew” or “retain” or anything related to buying a product again. The question was chosen for three reasons:
- It’s fast and easy to respond to.
- It can lead to an advocacy event.
- It correlates to growth.
It was never intended to predict renewal.
So why do so many people assume a retention connection?
Why Do Promoters Churn?
Because NPS is associated with growth and advocacy, it’s easy to make the mental leap to connect it specifically to renewal. After all, if you would “strongly recommend” a product or service to your friends and colleagues, why in the world wouldn’t you renew?
But it isn’t that simple. There are plenty of reasons why a promoter might churn:
- The key stakeholder or champion leaves the company.
- The client has a great experience, but isn’t achieving their desired outcomes.
- Budgets change; company priorities shift that are outside the scope of your product.
- Your product is well-loved but duplicative of other entrenched (and possibly cheaper) tools.
- The company undergoes a merger or acquisition.
- And so on.
And it’s in common scenarios like those that a positive NPS viewed in a silo can be incredibly misleading. If you assume that NPS is a retention indicator, you can be blindsided by churn.
Gross Retention vs. Net Retention
Furthermore, when we don’t granularize retention into gross and net categories, we also can get a misleading sense of the impact NPS has on either number.
First let’s recap:
Gross retention is the percentage of Annual Recurring Revenue (ARR) from renewals. It does not include expansion revenue.
Net retention is the ARR percentage plus expansion revenue (upsell, cross-sell, etc.).
Since NPS doesn’t correlate to renewal (or its inverse, churn), it isn’t a factor in forecasting or altering your gross retention number. This isn’t even a correlation vs. causation issue—it just flat out doesn’t have a consistent relationship! That’s according to research from ProfitWell, which you can see here. You’ll notice that there is a caveat, though: companies with really high NPS scores—we’re talking in the top 25% relative to their vertical—actually did see a 5–10% bump in renewals.
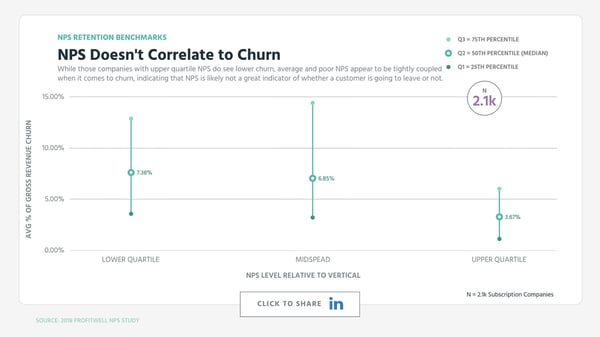
Let’s keep that in context: if you have terrible NPS or even above average NPS, there isn’t a retention correlation. That means 75% of companies can’t use NPS as an accurate predictor of churn.
But when it comes to net retention, NPS can give us some help.
NPS Correlates to Upsell and Cross-Sell
ProfitWell’s data showed a relationship between expansion revenue and NPS, with the bottom quartile of companies (by NPS) earning 5% less in monthly expansion revenue than median quartile and 15% less than the top quartile.
That’s a big deal! What we’re after in subscription is revenue growth—and expanding your existing customer base is among the cheapest ways to do it. Investing in new logo acquisition can be expensive, and the revenue payoffs can often be months or years after you sign the initial contract.
NPS: What Is it Good for?
Okay, so if NPS can’t predict churn, what is it good for? There are five ways you should be looking at NPS as a strategic metric:
- NPS does correlate to growth: Since 2003 when Fred Reichheld introduced it, NPS has been strongly correlary to (and a leading indicator of) growth—through word of mouth and we now know, expansion.
- It’s simple and ubiquitous: Companies have been using this yardstick for over a decade now, and we’re sitting on a lot of data thanks to the widespread use of the same metric. There are plenty of cheap and simple ways to spin up your own NPS program.
- It’s a good benchmark: People ask us all the time, “What’s a good NPS score?” The answer is pretty simple—better than it was last quarter! If your NPS is getting better, your growth numbers will likely get better too.
- It surfaces dissatisfied customers: We’ve been talking mostly about NPS in aggregate, but one of the biggest strengths of the survey is that it uncovers customers who may be unhappy or unsuccessful. That lets you reach out to take action—maybe even automatically!
- It identifies advocacy candidates: If someone is telling you they would recommend your product to their friends, that doesn’t mean they’re going to automatically do it all by themselves. To get advocacy, you usually need a process to ask for it and facilitate it happening. But NPS is a great way to find the people who are ready and willing to do it. Click here to learn more about how to funnel advocacy hand-raisers into solid marketing assets.