
When data warehouse journeys fail—and how to make sure yours doesn’t

In my 10 years of working with big data and partnering with thousands of different customers across nearly every industry, I’ve seen many data warehouse projects fail. Spectacularly.
What does it look like when a data warehouse “fails”? Sometimes teams fall short of getting pipelines tied together and running, sure. But most often, failure takes the shape of a long, drawn-out process where companies spend time and energy to operationalize their data in such a way that their warehouse only delivers a fractional return on the organization’s investment. “Failure” looks like costing more than it’s worth—or delivering less than it should.
Creating a place where an organization can store all of its data to create a single source of analytical truth is the whole point of a data warehouse. And today’s warehouses and surrounding data tools (including Mixpanel’s new Warehouse Connectors) make that goal easier than ever to achieve. But it’s not automatic, and, in my experience, it’s rarely the technology that goes awry. Developing systems for a diverse group of stakeholders to consume the same data is no small task; it’s a journey. Organizations rarely have patience for that journey.
As a result, projects often fail because they run out of time (or money). If we can identify some thematic risks before they become problems, we can save time (and money) and mitigate the “failure” outcome. Let’s discuss some specific things I’ve seen go wrong again and again with data warehouse projects, why those things happen, and how they can be avoided.
Why data warehouse journeys fail
When data warehouse project fail, it’s typically because of one (or occasionally all) of these three reasons:
The technology stack is wrong
Maybe you chose Snowflake but didn’t realize your queries would (eventually) require computationally expensive UDFs, which tanked the performance of your pipeline while skyrocketing costs.
Maybe you chose BigQuery and when it came time to automatically partition your tables or replicate a database across regions, you ran into limitations inherent to the platform.
Maybe you chose Redshift and when your data volume exploded, you had long periods of unanticipated downtime to scale up your clusters.
Maybe you chose Azure and when you needed to integrate your data stack with other (non-Azure) tooling, the team was surprised to find no connectors outside the Microsoft ecosystem.
Even if none of these anecdotes resonate with your experience, they are all symptoms of the same condition: Every technology has its own parameters and quirks, and these things generally don’t present themselves until you’re trying to scale an already established system. The choices you make now only come back to bite you later when you’ve already crawled and you’re trying to go from walking to running.
There is no perfect technology stack, only trade-offs. In general, when making technology choices, I find it helpful to establish a rubric of priorities and vet your proposed technology choices against that rubric.
Here’s one way to establish a rubric of priorities with respect to technology choices and trade-offs:
How fast does the system need to be? How fast does it need to appear?
Humans (generally) have an expectation of “computers going fast”. Indeed, end users have little patience for spinning dashboard loaders and apps typically have a very small window to make a first impression on the end user.
As engineers, we know there are many tricks to give the perception of speed (just ask your web developer) even if some piece of an underlying system is actually slow.
Ryan Dahl, the creator of node.js, said it best in his 2011 rant:
| “I hate almost all software. It’s unnecessary and complicated at almost every layer. … The only thing that matters in software is the experience of the user.” |
It’s easy to forget that “user experience” particularly as it relates to terms like “fast” or “slow” are often relative to some baseline expectation. These expectations are usually established by an earlier version of a system. This is especially true in analytical products: If the dashboard feels slow—relative to how it “felt” yesterday—it doesn’t matter how powerful the back-end is. Your end users will always be disappointed if you keep them waiting.
At Mixpanel, we have special cases in our web app to handle “slow query UX,” and I find it is a good implementation of this compromise. When we serve up a report that takes “a long time” (by our own standards) to load, we use that opportunity to teach our end users something new about our product:

After implementing some of these features, we noticed a decrease in “my query is slow” type tickets, and we also were pleasantly surprised to watch our end user’s adoption of these neat little tips and tricks rise considerably.
Therefore, try to decouple “compute time” and “end-user time” when determining the requirements of a system’s speed or UX. Don’t let better be the enemy of good, and only make optimizations where they are absolutely necessary.
How cheaply does the system need to run? How predictable are costs?
In 2023, cloud data warehouses are ubiquitous, and it has never been more simple to stand up a piece of extremely sophisticated technology by clicking a few buttons in an interface.
That power makes it easy to abstract away the costs of said infrastructure until the invoice hits at the end of the month. Poor planning results in unpredictable costs. Getting a surprise bill is the result of poor observability.
It’s easy to get excited about cutting-edge technology and become enamored with the latest and greatest tooling. The latest tools often come with the most expensive price tag, and while it’s obvious that cost is a major factor in making technology decisions, often a predictable high cost is better than an unpredictable cost.
At Mixpanel, we transform our Google Cloud Billing table into Mixpanel events, making it easier to monitor the cost of every single cloud service we deploy within our infrastructure and joining it with the team who is accountable for that system:
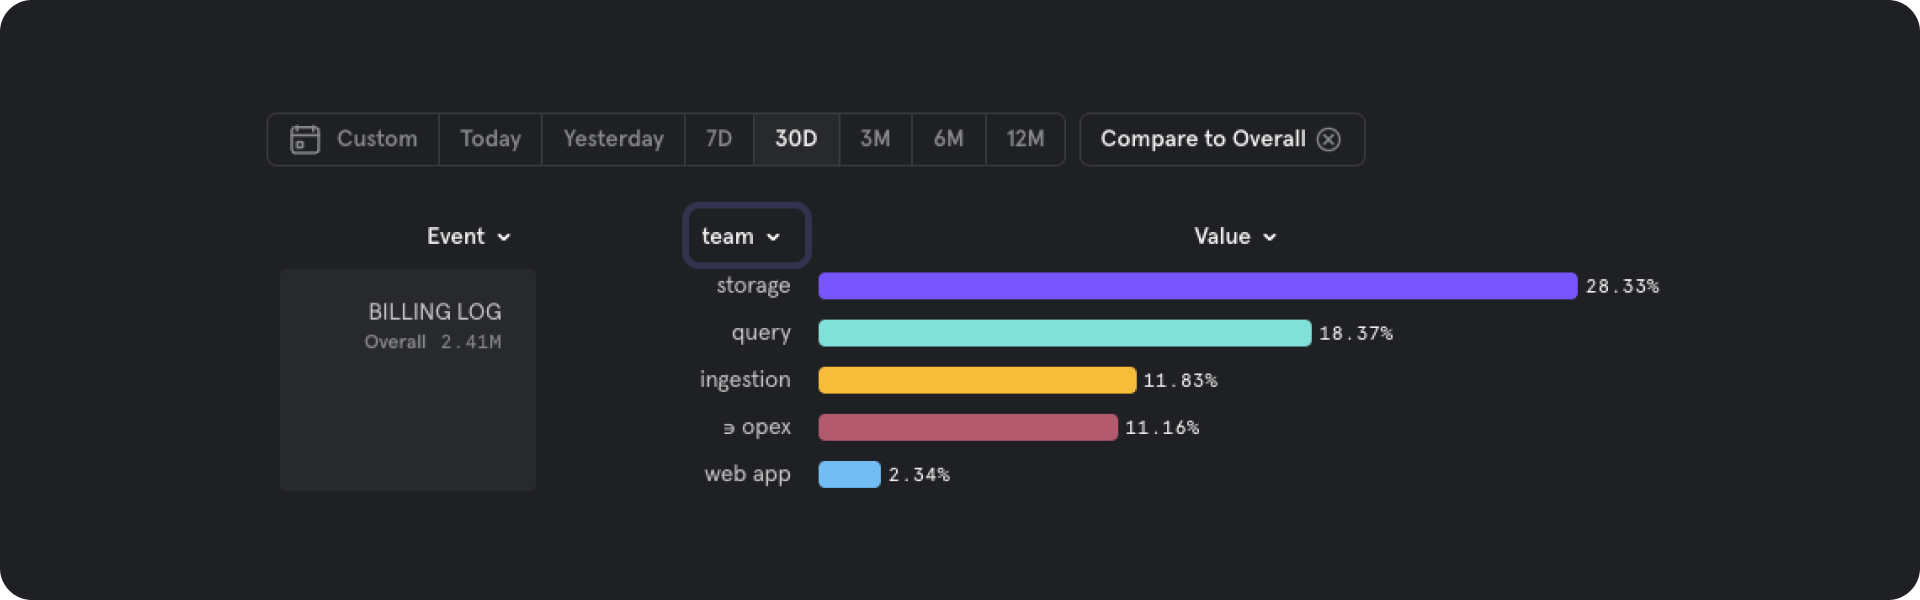
Observability is the key to predictability. And we’ve found, particularly with monitoring costs as they change over time, the more eyes you can have on the data, the better. Before standing up the latest and greatest, always ask, “How will we observe the costs this system will generate?” Do you have leading indicators or only lagging ones? Can you make the billing data accessible to less technical stakeholders who might be closer to the money? Having vague answers to these questions up front is a red flag on the runaway cost train.
How correct does the output need to be?
Precision is great—but only when it’s feasible. It can be maddening to scrutinize a single (problematic) row in a table of more than 1B records. Ultimately, these types of exercises are futile, especially in analytics where bad records (even tens of thousands of them) account for 0.001% of the data and are therefore insignificant when looking at a larger trend.
Certain metrics (like latency or revenue) do require precision, while other metrics (like total page views or clicks) don’t. For metrics that don’t require precision, don’t build a precise system. For metrics that do require precision, look for ways to cut down the data volume. For metrics that require precision sometimes, try something new, preferably non-destructive!
At Mixpanel, we offer query time sampling features to beat this tradeoff by giving our end users a “go fast” lighting bolt button to be used on demand!

Effectively, Mixpanel collects data at full fidelity and offers (as an opt-in feature) the ability to sample data at query time. For queries over billions of events, this means the chart or dashboards load very quickly but only at 10% fidelity. When precision is important, users turn off the lightning bolt to get a precise unsampled answer.
What interface do we need? What interface do the people want?
Every project you ship, every pipeline you create, every report or widget you build, and every line of code you write has a lifespan. And you don’t know how long it’s going to last while you are building. You don’t find out until later, when the requirements change or when a bug is identified.
For this reason, you should expect whatever you have built to be re-built over-and-over again.
John Woods wisely posted (on a Google Group in 1991):
| “Always code as if the guy who ends up maintaining your code will be a violent psychopath who knows where you live.” |
If this wisdom resonates, then you know that your chosen technology stack should provide an interface and developer experience that can be used by a significant majority of your team.
Nothing kills engineering productivity more than unpacking legacy code. Tech debt endlessly accumulates when we choose, build, or model the wrong set of interfaces. And the interfaces we need will change over time in ways that we cannot anticipate. It’s quite common to construct brittle spaghetti systems for a proof of concept, but if we never refactor, we’re essentially borrowing time from our future selves.
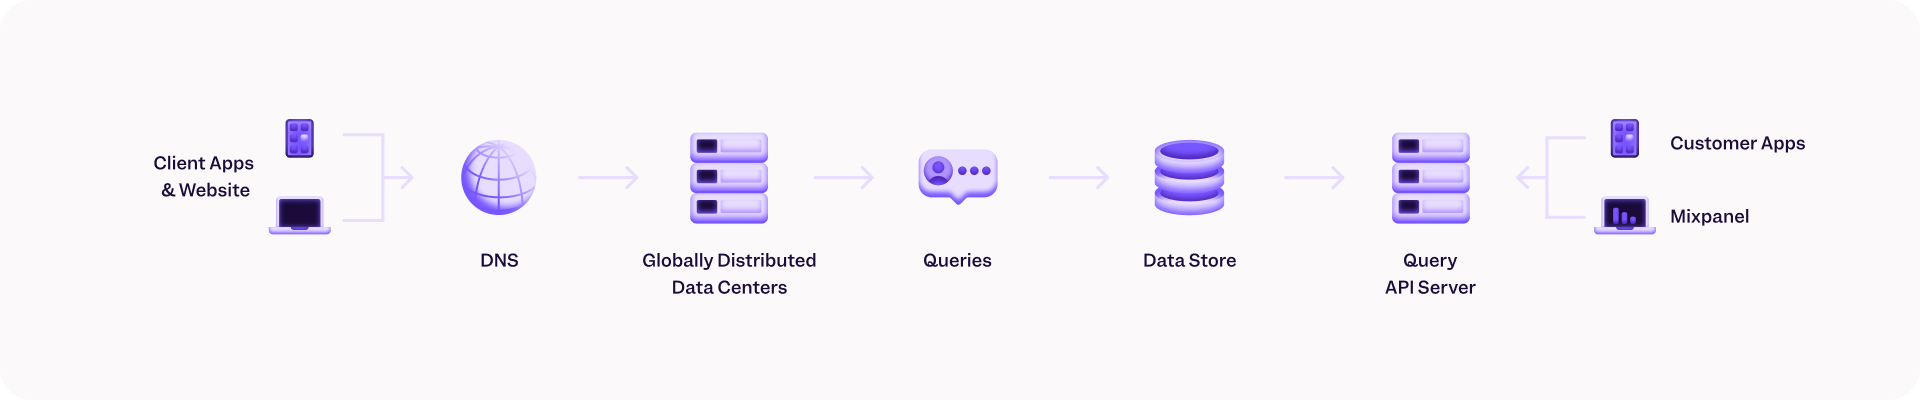
Part of Mixpanel’s magic is ARB, our in-house database which stores the event data our customers send to us. And a big part of ARB’s magic is its storage, query, and compute interfaces.
As you establish your own set of priorities, remember that you’ll have to make compromises, almost everywhere. Seldom can a system be “fast,” “cheap,” and “correct” with a “fantastic interface” all at once. Once you have your rubric, rank it. In doing so, it will become more clear what the technical requirements of your data stack should be.
The people are wrong (for the project)
If you’ve ever recruited or hired data people, then you know the professional world of data is a vast sea of technical titles and roles. “Architect,” “Scientist,” “Engineer,” “Analyst,” “Advocate,” “Admin,” etc. Then add the prefixes, like “Database,” “Machine Learning,” “AI,” “BI.” And don’t forget the “Senior”, “Lead, or “Chief” pre-prefixes and “I,” “II,” “III,” suffixes.
Personally, I’m not a huge fan of job titles. I understand why they are necessary in corporate culture, but rather than thinking about a project’s needs exclusively in conventional terms— “We need a senior data engineer, a junior data scientist, and a BI Analyst III!”—try an alternative approach that places people in roles based on archetypes rather than job titles.
In the spirit of my “data warehouse projects are journeys” framing, I will elucidate this concept with Dungeons & Dragons player archetypes as a metaphor.
Every successful warehouse project will need a brave and open minded adventuring party consisting of the following players:

A Dungeon (Data) Master
Someone needs to understand the universe. All forms of data are modeling some real-world description of facts. Without a subject-matter expert, without someone who actually understands what the data represents, it is hopeless to build useful things that people will get value from. Your DM isn’t always the project lead, but every team needs an individual who “gets the data” and can clearly explain (often repeatedly) the state and condition of the system. Without a DM, the team will get lost, wandering aimlessly with no clear direction. With an experienced and patient DM, even a level one party can have an epic adventure, punching well above their weight class.

A Storyteller
Someone needs to make the data come to life. The role of the storyteller is to summon an audience and connect that very same audience to the data. This storyteller therefore is versed in tangible business values that everyone can understand and relate to. The storyteller also knows all of his or her stakeholders and knows how familiar (or unfamiliar) they are with the data. Without a storyteller, it doesn’t matter how much a project has achieved; if no one knows about it (or cares about it), the whole project amounts to nothing.

A Steward
Someone needs to write everything down. As projects move forward, many artifacts (code, documentation, slides, charts, meetings, etc.) get created. These assets need to be organized, tagged, and cataloged, so they are discoverable and can be referred back to. The Steward is also responsible for destroying assets that are no longer needed. Without a Steward, no one knows what’s oustanding. And because no one can trace the project’s journey, timelines and estimates become extremely unreliable.

An Instigator
Someone needs to challenge the status quo. Software development of any kind is peppered with assumptions, and the Instigator isn’t afraid to ask, “Why are we doing this?” Respectful conflict can be a fruitful way to push harder on requirements and challenge the party to think more critically about the problems they are trying to solve. Without an Instigator, everyone ends up agreeing with each other and real innovation rarely comes to fruition.

An Explorer
Someone needs to boldly go where no one has gone before. The Explorer tries new things and refactors existing processes. They are not afraid to ask, “What if we did it differently?” and try it themselves. Without an explorer, projects lack creativity.
A parting thought on this is that more people will not necessarily make a project move faster. And neither can it hinge on a single person (I believe the “10x developer” is a myth and a cultural artifact of our society’s propensity for exceptionalism). It takes a balanced party featuring most or all of the above players, working together to forge a valuable system.
The requirements are bad
This is the most common reason that data projects fail. Requirements are constraints which define the boundaries of what the project is attempting to solve.
Requirements are not technical in nature; rather, they make a clear business case, which explain:
- Who the stakeholders are (users)
- What the problem is (definitions)
- Where the resourcing will come from (accountability + budget)
- When a solution is required (timeline)
- Why the problem needs to be solved (pain points, alternatives considered)
All too often, I see technical requirements get conflated with business requirements. This leads to planning the implementation of a solution before the who/what/where are well understood.
Put differently, vague requirements are future bottlenecks in disguise. While engineers are often quick to complain about vague requirements being a simple miscommunication (or an insult to the intelligence of the stakeholders), I believe vague requirements are an inevitable outcome when you don’t have safeguards in place to keep your project scope lean.
That’s because common language makes it too easy to be vague. Take this (familiar?) requirement as an example:
We need to understand who our power users are, what actions they perform in our app, and how much they spend.
On the surface, this seems like a reasonable analytics use case, but even a small probing inspection of this statement reveals many terms shrouded in vagueness:
- “Power user”: What does it mean to be a “power user”? Do we already have a definition of a “power user,” or do we need to create one? Is the definition constant, or does it change over time?
- “Actions they perform”: What constitutes an action? Are actions just page views/clicks or something more specific?
- “How much they spend”: Does “spend” refer to time or money? Is it both? Maybe it’s something else? If we’re talking about time, what unit of time do we use? And how do we aggregate time? If it’s money, is this a profit metric or a revenue one? Should money metrics be standardized to a single type of currency, or is it relative to the end user’s location?
Vague statements are not bad, but you have to recognize they’re mearly starting points for requirements. Before your team starts working on any project, the requirements need to be unpacked and rewritten so they are clear. And remember: If any key member of the team thinks that a requirement is unclear, then it’s unclear. Requirements must be unanimously understood.
At Mixpanel, we standardize requirements-gathering in the form of a product requirements document (PRDs) to keep our project plans tight and focused.
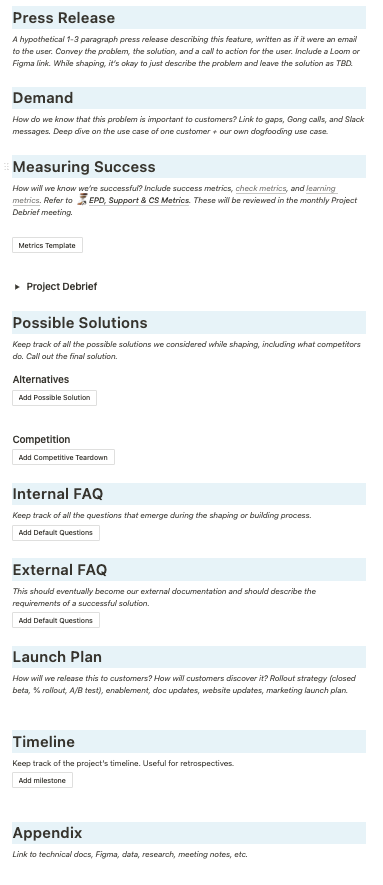
Most pointedly, the first exercise for any newly proposed feature or product at Mixpanel is to write the hypothetical “shipped” email or documentation for the release. This type of “do the last thing first” framing is an invaluable exercise that helps teams qualitatively describe exactly what they need to build and why they need to build it—before they actually build anything!
How data warehouse projects fail
While some of the observations I’ve shared thus far may seem obvious in theory, working within a corporate structure, with various stakeholders and company politics, can make it very difficult to “see the forest through the trees.”
It’s easy to lose sight of these types of high-level themes when you spend most of your time weeded in technical details. Sometimes you can look to solutions outside of your organization to help, but, like everything else, that also takes time, money, and resources.
Unfortunately, “failure” doesn’t become apparent immediately. Failure is an “end state.” While there is always value in postmortems and retrospectives, these are distant lagging indicators of efficiency, productivity, and (ultimately) outcomes.
It would be much more useful to have leading indicators, a set of heuristics that gives you a sense of whether or not further investment in a project is worthwhile.
So if the “wrong tech,” “wrong people,” and “wrong requirements” elements helps explain why data warehouse projects fail, we can also then begin to examine how data warehouse projects fail.
Specifically, I’ve observed the following three different types of failures that usually occur in the middle of a project.
The project doesn’t produce results
You’ve heard the refrain in many forms:
- “… the results of the A/B test were inconclusive”
- “… we didn’t find a correlation between foo and bar”
- “… the data was too messy to make a reliable conclusion”
This is often an early indicator of a “wrong requirements” problem. When you have clear requirements and a manageable project scope, you should not fail to produce results.
If you find your project in this state, it’s time to revisit your requirements and unpack some of the vague statements. You’ll often find that your assumptions were wrong because you were either given ambiguous guidance or didn’t understand the problem well enough before you started implementing a solution. Instead of focusing on whose fault that is, try to focus on how to get clarity necessary to move the project forward.
The project produces results, but it’s too expensive (time, money, maintenance)
Every organization, either implicitly or explicitly, must define its patience for a particular outcome. It’s better to be explicit than implicit, but there is no project for which time and money budgets are unlimited.
When a project grows too expensive (or moves too slowly), this is an indication of a “wrong technology” problem. It’s therefore time to revisit your technology stack and reevaluate the associated costs of each component. As you balance these priorities, you’ll often find that time and money are on opposite sides of the equation: You can make a component cheaper if you’re willing to tolerate a longer latency, and you can make a component faster if you’re willing to pay for it.
The project products results, but we don’t like the results
Any organization embarking on a data warehouse project has a desire to be more “data-driven.” In simple terms, this means making decisions about the future of the business which are grounded in analysis of its data rather than individual people’s opinions and assumptions.
It’s far easier to “talk this talk” than to “walk this walk.” Sometimes the findings of our analysis do not align with our hypotheses or gut-feel. Though it can be frustrating to discover that one of your core assumptions is not grounded in factual reality, this is not a failure. Failure comes when you reject the evidence you’re presented with.
There is a kind of Socratic wisdom that arises when you realize that your mental model is incomplete. You thought you knew something, but you observed a different set of facts in the world. This is the power of data. Data is objective (unlike humans!). When we are confronted with data that conflicts with our world view, we need to adapt our world view, not reject the findings.
Not every organization or team can tolerate these difficult moments of aporia.
Therefore, when an organization doesn’t “like” the results of a project, despite the fact that the project followed a rigorous methodology, this directly points to the “wrong people” problem.
How to mitigate failure?
That there are many ways for you data warehouse project to fail, but there is (generally) only one path to a successful outcome:
Get the RIGHT people working with the RIGHT technology on the RIGHT (well-defined) set of problems.
When phrased in this context, it seems like a tough proposition. And yet, I’ve also seen many companies (and met many data engineering leaders) who have built strong teams, with great technology architecture, producing rich and powerful products! How do they do it? What’s the recipe?
One piece of (timeless) wisdom from Peter Cohan is: “Do the last thing first.” You want to start not with the technology, not with the people, but with the requirements. Make sure you’ve defined a clear set of requirements that map directly to problems that (when solved) add value to the business. That entire picture should be clear before any choices are made about technology, team composition, or implementation.
Let’s take the same (example) use case from earlier:
We need to understand who our power users are, what actions they perform in our app, and how much they spend.
Here’s how we might turn this sentiment into a clear set of requirements for an analytical project:
- For every end user in our app, they need to be labeled as a power user or not a power user.
- The power user label has a behavioral definition: performed three actions in the last week.
- An action is one of a set of events (“comment,” “subscribe,” etc.).
- “In the last week” is a calendar-based measurement; the “week” starts on Sunday.
- We need the behavioral definition to be flexible enough to experiment with different numbers of actions, different sets of actions, and different timeframes for this definition.
- We need to compare the number of power users changing over time as a metric.
- For every power user, we need to calculate the following metrics.
- Time spent by this user in our application
- This will be defined as the delta time between session start and session end.
- We need to exclude “time inactive” from this calculation (somehow).
- Money spent by this user in our application
- This will be defined as the sum of all purchases over the last three months for each user.
- We need to standardize currency (somehow) because we sell products in different currencies.
- Users touched by this user in our application
- This will be defined as the sum of all comments, likes, shares, and other “social” activities over the last three months for each user.
- Time spent by this user in our application
And here’s how we might map those requirements’ business value that everyone can understand:
- We want to grow power users because more power users will build revenue and sustainability for the business.
- We need to measure power users before we can hope to grow them.
- Once we are measuring power users, we can enable specific journeys:
- For power users who became power users for the first time ever today
- For power users who became power users for the Nth time ever today
- For regular users who were power users yesterday
- For regular users who are likely to become power users tomorrow
Most importantly, we take extra time to bring clarity and specificity to requirements. We’re rigorous about unpacking terms that are vague, and we used prior experience and data we’ve already collected to validate your assumptions about what need to get built.
But reality often stands in stark-contrast to the best practice. If you’ve read this far, there’s a good chance you’ve been nodding your head but also saying to yourself, “Requirements-gathering takes time and resources. And often we need data to look at before we can finalize requirements!”
Mixpanel can help you gather requirements. Last quarter, we shipped several data warehouse connectors (BigQuery, Snowflake, Redshift). These tools make it possible to “mirror” your analytical data warehouse in Mixpanel.
Mixpanel’s UI also makes this pretty simple to do. In fact, nearly every one of the requirements we mapped above are out-of-the-box reports:
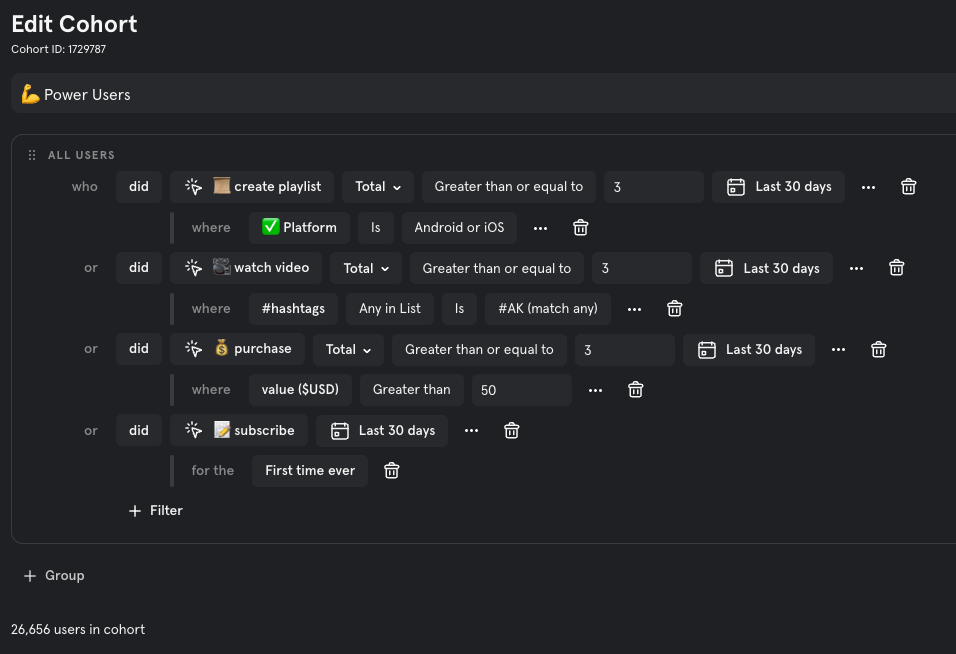
(Check out our Docs for more on how to get started.)
Once you have your requirements mapped out according to your business and data needs (thanks to help from Mixpanel or not), the rest of your warehouse journey can begin in earnest. You’ll have a much better understanding of the specific technology you should be targeting and what people (or players) are required to pull it all together.
Onward!
Get fast access to product, marketing, and company revenue insights for your whole team with Mixpanel’s powerful, self-serve analytics. Try it for free.