
OpenView Partners is a Boston-based expansion stage venture capital firm. They have a portfolio of SaaS investments that consists of over 60 companies. 24 have been acquired (Exact Target, Lessonly) and two have gone public (DataDog & Instructure). OpenView is a huge proponent of the Product Led Growth (PLG) movement. They publish the PLG Index of public SaaS companies that embrace the PGL approach. They also regularly publish financial and operating benchmarks for SaaS companies, including product led growth companies. In November they published the 2021 version of the report. It includes 17 financial and operating metrics, many segmented by company revenue size.
The OpenView Report
OpenView regularly publishes benchmarking reports about SaaS companies, especially product led growth companies. You can download their latest report SaaS Financial & Operating Benchmarks 2021 here
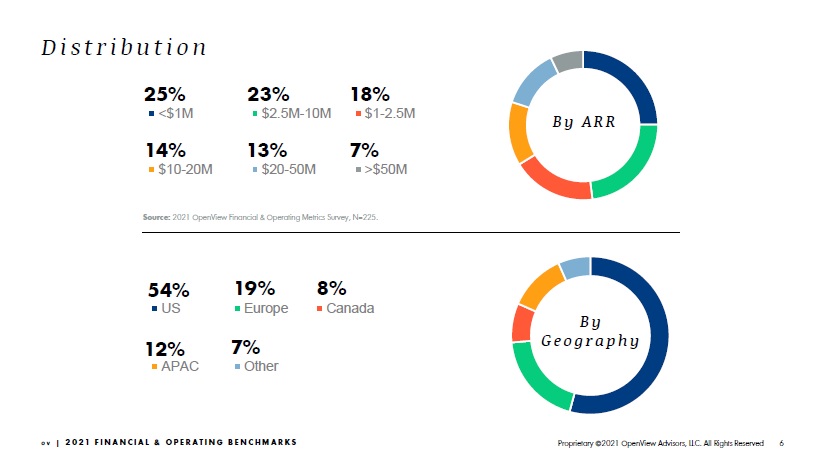
The 2021 report incorporates data from more than 2,400 respondents aggregated across prior surveys as well as almost 600 this year alone. The demographics of the report include:
OpenView SaaS Financial & Operating Benchmarks 2021

OpenView SaaS Financial & Operating Benchmarks 2021
We have excerpted 16 key benchmarks from the OpenView report:
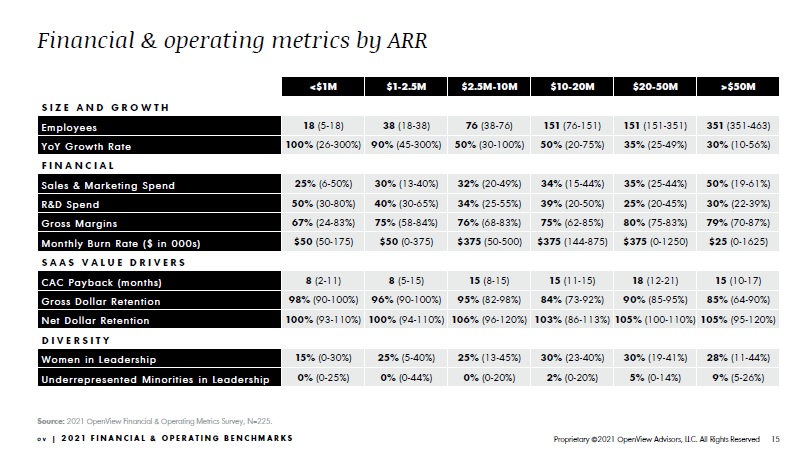
- 2021 SaaS Financial & Operating Metrics by ARR Scale
- SaaS Financial & Operating Metrics by ARR Scale 2021 vs 2020
- 2021 Subscription Revenue Gross Margin by ARR Scale
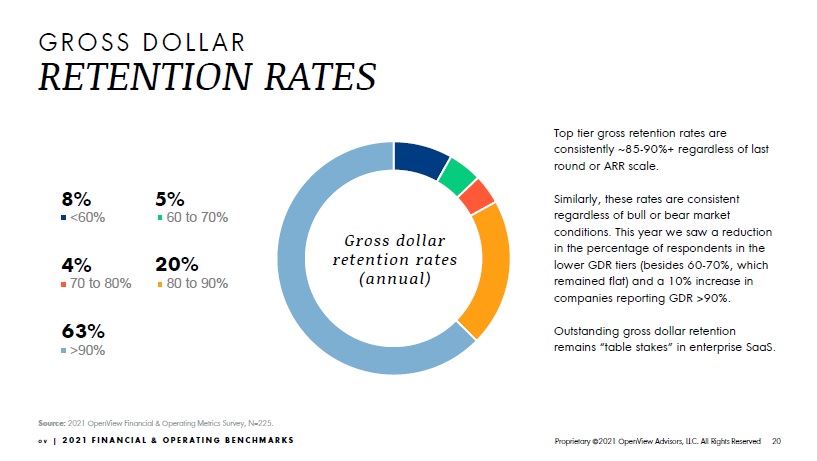
- 2021 Annual Gross Dollar Retention Rates
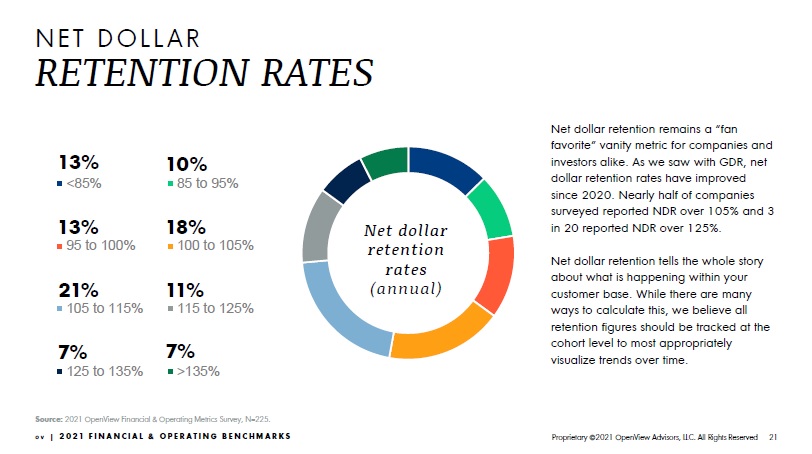
- 2021 Annual Net Dollar Retention Rates
- 2021 Gross & Net Retention Rates by ARR Scale
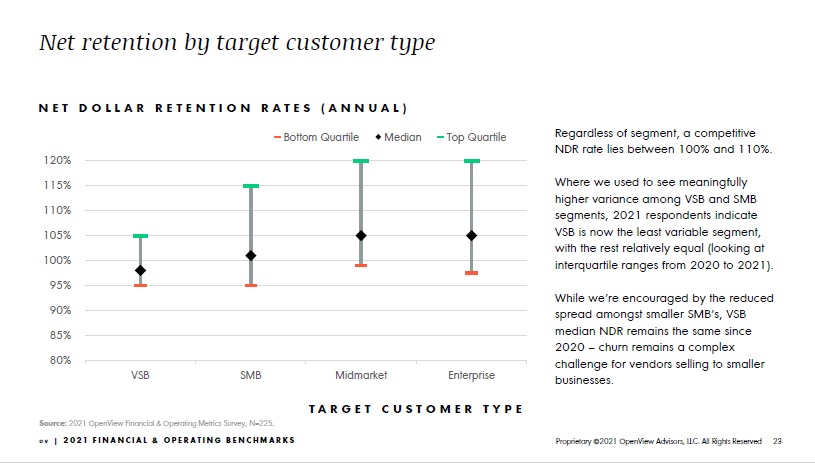
- 2021 Net Dollar Retention by Customer Type
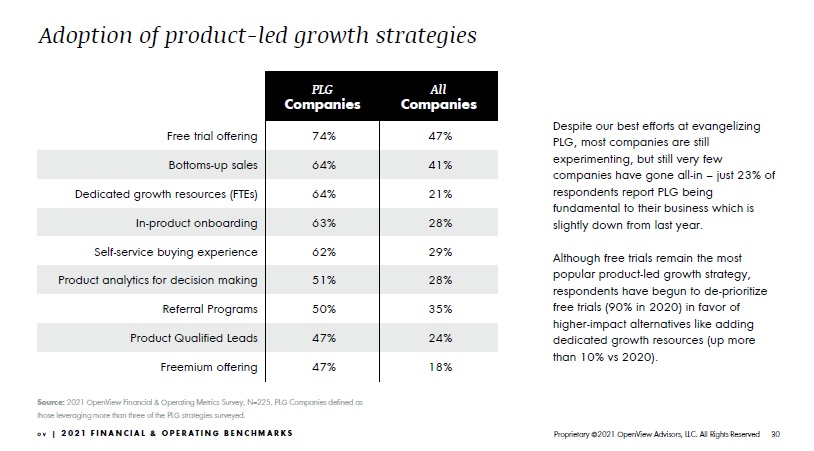
- 2021 Adoption of Product Led Growth Strategies
- 2021 Product Led Growth by Customer Segment
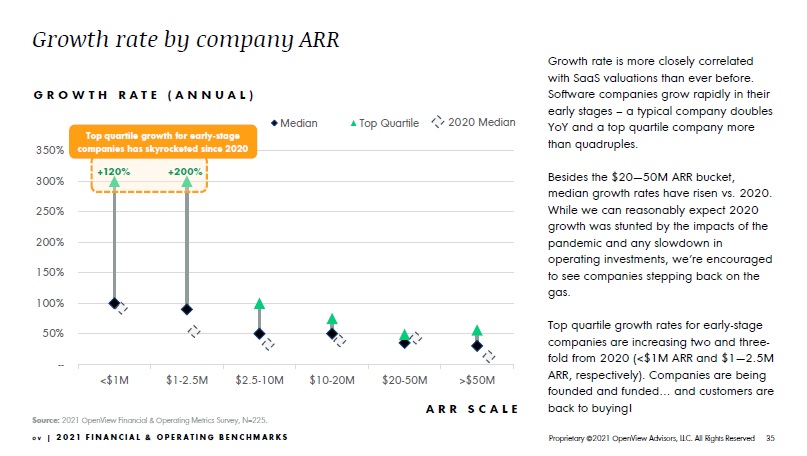
- 2021 Growth Rate by ARR Scale
- 2021 Sales & Marketing by ARR Scale
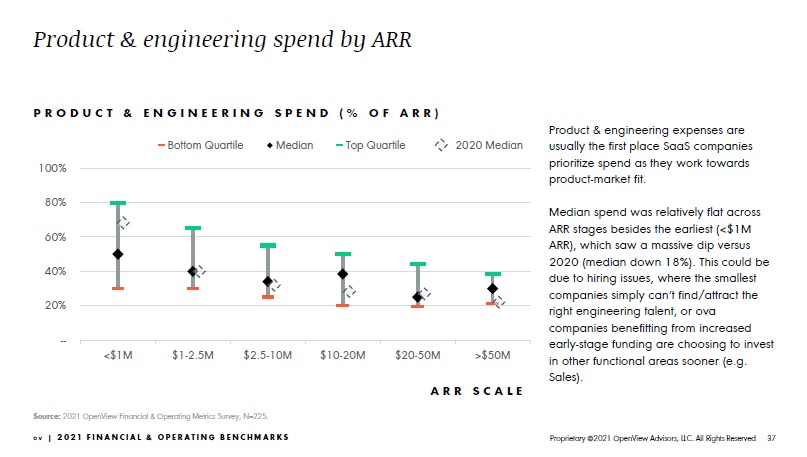
- 2021 Product & Engineering Spend by ARR Scale
- 2021 General & Administrative Spend by ARR Scale
- 2021 Sales & Marketing vs Product & Engineering Spend by ARR Scale
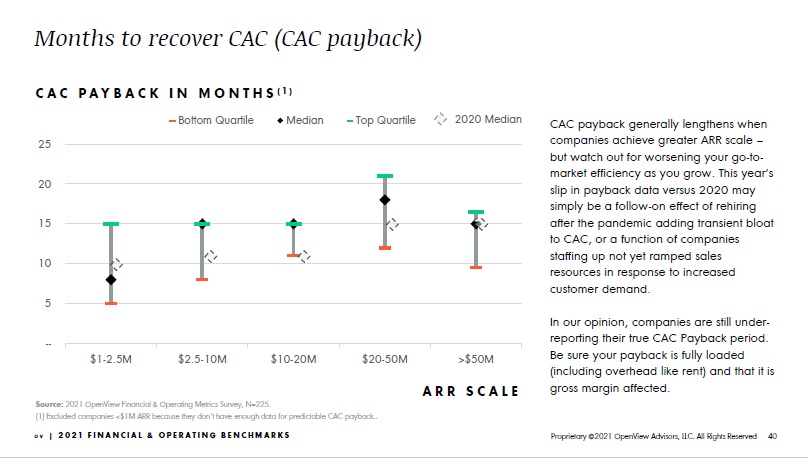
- 2021 Months to Recover CAC by ARR Scale
- 2021 Mix of Employees by ARR Scale
2021 SaaS Financial & Operating Metrics by ARR Scale
OpenView SaaS Financial & Operating Benchmarks 2021
SaaS Financial & Operating Metrics by ARR Scale 2021 vs 2020

OpenView SaaS Financial & Operating Benchmarks 2021
2021 Subscription Revenue Gross Margin by ARR Scale

OpenView SaaS Financial & Operating Benchmarks 2021
2021 Annual Gross Dollar Retention Rates
OpenView SaaS Financial & Operating Benchmarks 2021
2021 Annual Net Dollar Retention Rates
OpenView SaaS Financial & Operating Benchmarks 2021
2021 Gross & Net Retention Rates by ARR Scale

OpenView SaaS Financial & Operating Benchmarks 2021
2021 Net Dollar Retention by Customer Type
OpenView SaaS Financial & Operating Benchmarks 2021
2021 Adoption of Product Led Growth Strategies
OpenView SaaS Financial & Operating Benchmarks 2021
2021 Product Led Growth by Customer Segment

OpenView SaaS Financial & Operating Benchmarks 2021
2021 Growth Rate by ARR Scale
OpenView SaaS Financial & Operating Benchmarks 2021
2021 Sales & Marketing by ARR Scale

OpenView SaaS Financial & Operating Benchmarks 2021
2021 Product & Engineering Spend by ARR Scale
OpenView SaaS Financial & Operating Benchmarks 2021
2021 General & Administrative Spend by ARR Scale

OpenView SaaS Financial & Operating Benchmarks 2021
2021 Sales & Marketing vs Product & Engineering Spend by ARR Scale

OpenView SaaS Financial & Operating Benchmarks 2021
2021 Months to Recover CAC by ARR Scale
OpenView SaaS Financial & Operating Benchmarks 2021
2021 Mix of Employees by ARR Scale

OpenView SaaS Financial & Operating Benchmarks 2021
Summary
Thanksgiving marks a key milestone in most companies’ annual planning process. Targets are set for the next year during this time. Benchmarks are extremely valuable as a company grows. Understanding where your company’s performance ranks against your peers and competitors is critical. OpenView partner’s 2021 SaaS Financial & Operating Benchmarks is a great tool to use to assess your company’s progress and set goals for the future.
Also published on Medium.