Cohort Analysis: A Comprehensive Guide on How to Reduce Churn Rates

Cohort analysis is one of the most useful kinds of product analytics.
In our guide to cohort analysis, we discuss:
- What is cohort analysis?
- How it can help you improve your KPIs.
- Main types.
- How to conduct cohort analysis and interpret cohort tables.
- Best tools for analysis.
TL;DR
- Cohort analysis involves tracking and analyzing how different groups of users with common characteristics behave inside the product.
- User acquisition cohorts consist of customers who signed up for the product or purchased a subscription within the same period, for example, a week.
- Analyzing acquisition cohorts can help you find out when users churn, how long they stay engaged, or the impact of product changes on your metrics, like the retention rate.
- Behavioral cohorts are made up of users who similarly interact with the product. For instance, all users could have completed an event or used a feature.
- Behavioral cohort analysis helps you identify patterns in user behavior that affect your KPIs.
- Combining the two types of analysis can make the product more sticky and improve conversion rates and user retention. This translates into high customer lifetime value.
- Start cohort analysis by setting clear goals, and choosing the metrics to track.
- Based on your goals, decide which cohorts to analyze. For example, acquisition cohorts or users who engaged/didn’t engage with a feature.
- Finally, use an analytics tool to generate the cohort analysis reports. More complex use cases normally require multiple reports.
- The vertical axis in the table shows you the cohorts while the horizontal one – the time.
- The cells contain information on retention for each period relative to the previous one. When you click on them, it will give you more granular data about the retained or dropped users.
- Unlike Heap and Google Analytics, Userpilot offers teams tools to act on the insights from their cohort analyses.
- If you want to learn more about Userpilot cohort retention analytics, book the demo!
![]()
Try Userpilot and Take Your Cohort Analysis to the Next Level

What is cohort analysis?
Cohort analysis is a kind of behavioral analytics that involves tracking the behavior of user groups sharing certain characteristics.
This type of analysis allows product teams to better understand user interactions with the product and make data-driven decisions to improve customer satisfaction and retention, and drive revenue.
Types of customer cohort analysis
There are two main types of cohorts: user acquisition cohorts and behavioral cohorts.
Let’s see how they’re different and what they’re best for.
User acquisition cohorts
User acquisition cohorts are based on the signup date.
For example, an acquisition cohort may consist of users who sign up for the product in a particular week or month. You can then analyze how many of the users return to use the product again, day-on-day, week-on-week, or month-on-month.

Acquisition cohort analysis
This type of cohort is most suitable for tracking user retention and churn over some time. In other words, they can tell when users churn.
You could use acquisition cohort analyses to track the success of new products after the launch or the impact of changes to the product.
Behavioral cohorts
Behavioral cohorts are groups made up of users sharing specific behaviors or characteristics.
For example, you could create a behavioral cohort of users who have engaged with a particular feature or completed an event, like a purchase. Or you could group them based on the user persona, the acquisition channels, or the subscription plan they’re on.
What’s the use of behavioral cohorts?
Teams use behavioral cohorts to analyze which user behavior patterns lead to higher churn or retention, or the why behind them.
For example, they can help you identify the features that drive engagement or the kinds of users that benefit from the product the most.
The benefits of cohort data analysis
There are several ways product and marketing teams can leverage cohort analysis to make better-informed decisions and drive their KPIs.
Improve your retention rates among existing customers
Cohort analysis and retention analysis are often used interchangeably because many teams use them to boost their retention figures.
How exactly?
First, you can use it to understand when users tend to churn and then identify behavior patterns linked to higher churn and retention.
You then double down on promoting the successful behaviors to users behaving as if they might be at risk of churning.
Identify patterns and trends in your customer behavior
Thanks to churn analysis, you can also identify successful and unsuccessful patterns in user behavior. So rather than looking at churn rates across all users, this will let you see when users churn in relation to the customer lifecycle.
For example, you may be able to identify the features the churned users don’t engage with or the features that drive increased conversions.

When paired with data from time-based cohorts, these insights can help you engage your users to promote the desired behaviors and improve relevant metrics.
Understand drop-off and average engagement time
By analyzing time-based cohorts, you can learn how long your customers stick around and when they’re most likely to churn.
Thanks to such insights, you can engage users at the right time.
For example, if users tend to churn at the beginning of the journey, just after signing up, you will be looking at improving your onboarding. If it’s later, you need to drive user engagement and help them find repeated value.
Improve product stickiness and customer lifetime value
Having identified when your users drop off and what they do or don’t inside the product, you are able to improve product stickiness and customer lifetime value.
For example, you can use in-app messages to help users discover relevant features and prompt them to engage with them regularly.
Once users start realizing the value of the product and adopt it as a go-to solution to their problems, they’re more likely to stick around for longer. And that means more cash flowing into your chest.
How to perform an insightful customer cohort analysis
Now that you know the benefits of cohort analysis, you’re probably wondering how to conduct it to gain actionable insights.
Here’s a step-by-step guide.
Step 1: Start by setting a clear goal
To make your cohort analysis productive, always start by defining the problem you’re trying to solve.
For example, this could be reducing churn for a specific user group, improving trial-to-paid conversions for new users, or boosting account expansion efforts through upsells.
Whenever you’re deciding on the goals, it’s a good idea to check them against a goal-setting framework like SMART and Lock and Latham’s. In this way, you will make sure that they are relevant, clear, and specific.
An example goal could be to improve customer retention by 10% by January 2024.
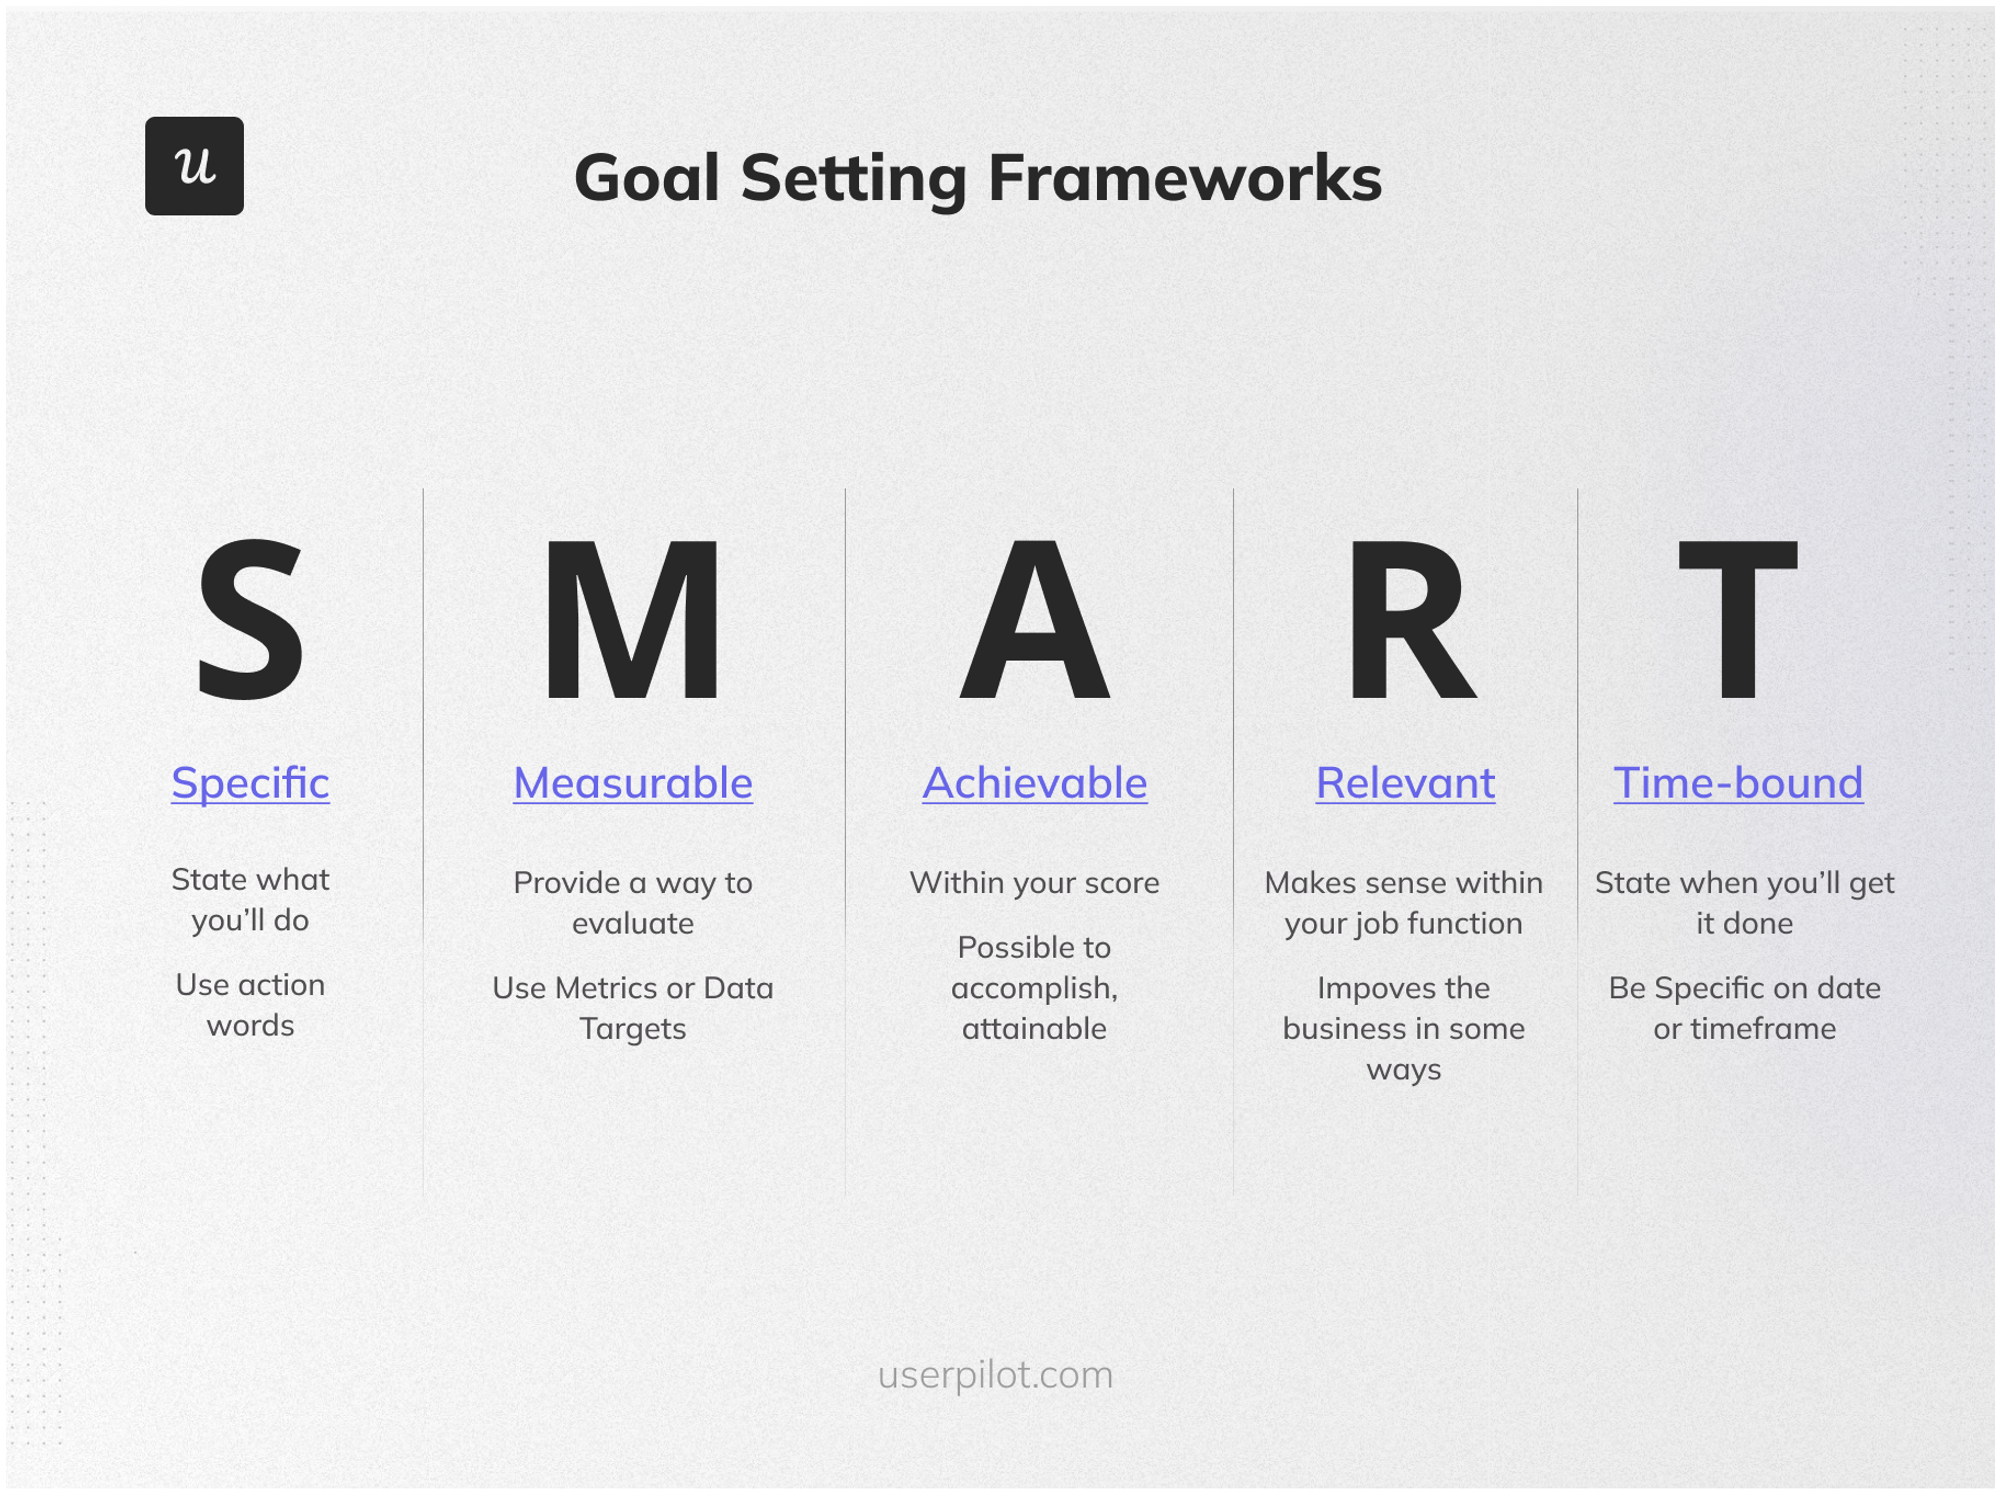
SMART goal-setting framework
Step 2: Define the cohort metrics you need to track
Another advantage of using a framework like SMART is that it forces you to think about how you’re going to measure progress. However, if you haven’t done it yet, this is the time to choose relevant metrics to track for your cohort analysis.
Let’s imagine that you want to improve customer retention.
In this case, the basic metrics to track will be the retention rate and churn rate. If you want to improve conversions at any particular stage of the funnel, you will be looking at the conversion rates.
You get the drift.
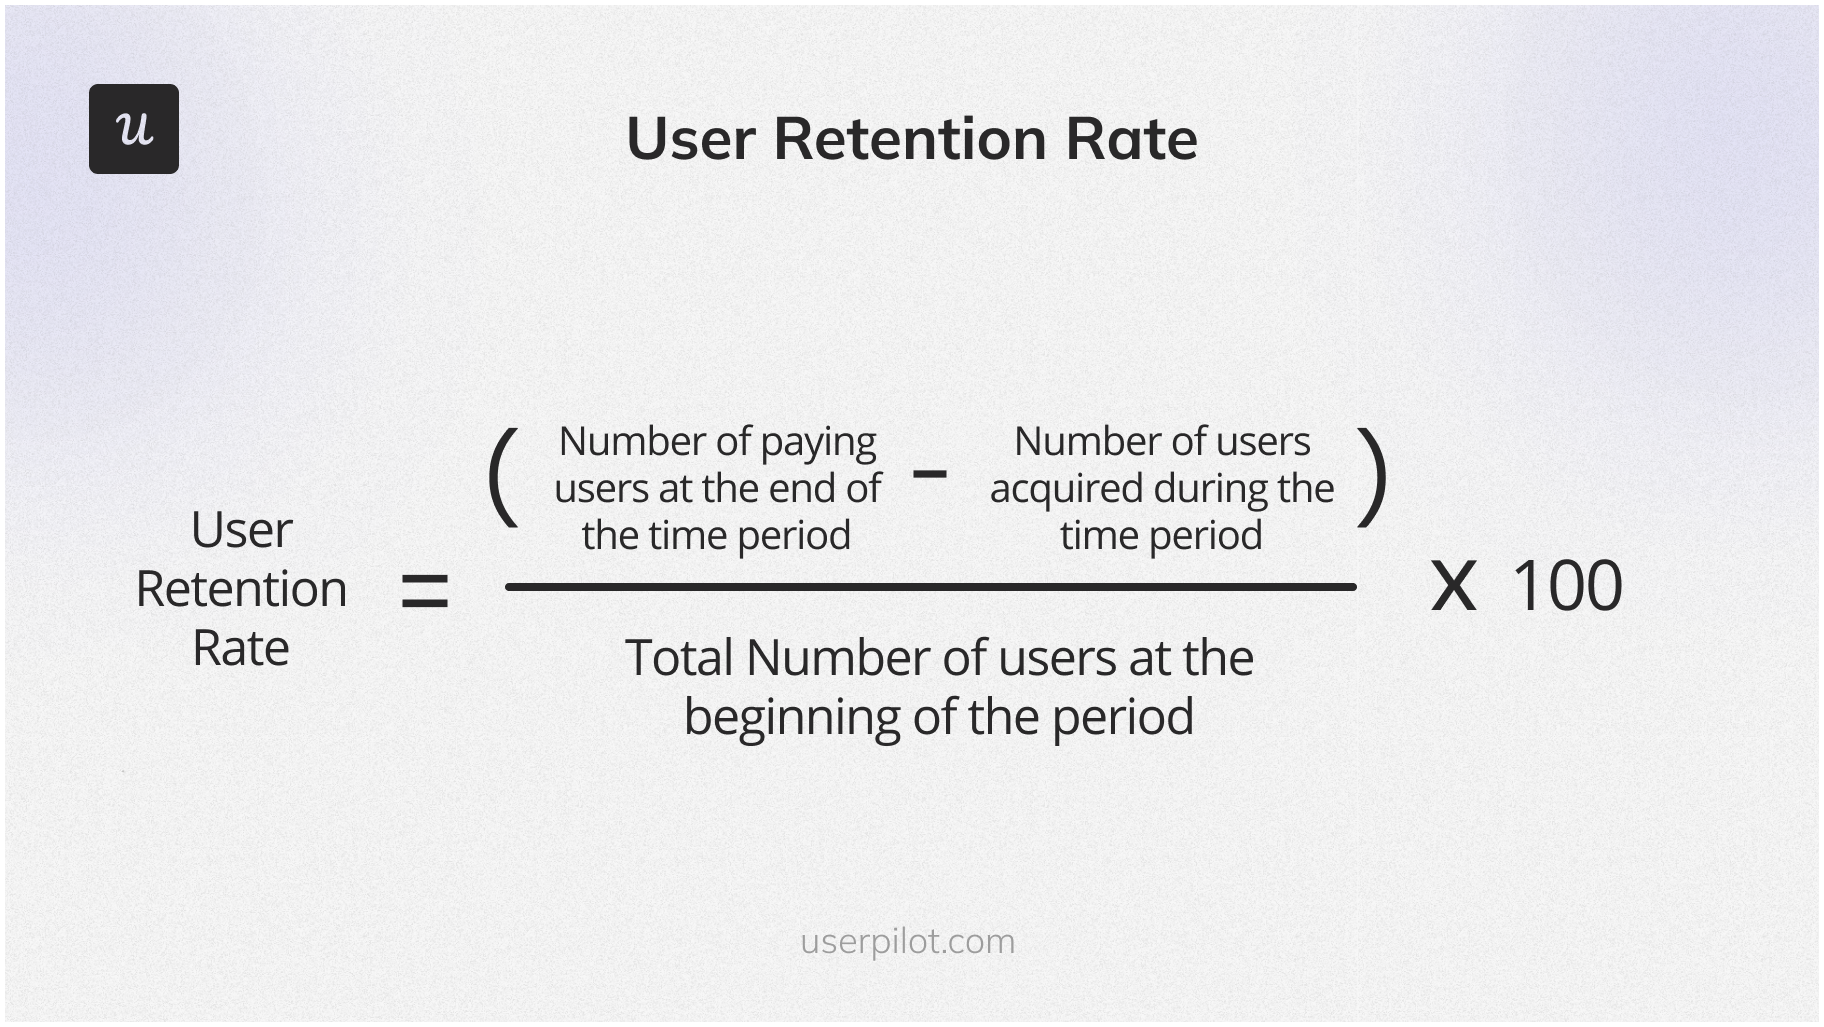
Customer retention rate formula
Step 3: Define user groups and cohorts
Now that we have the goal and the metric locked in, select the user cohorts to analyze.
For instance, if the objective is to identify ways to improve retention, you can start with time-based cohorts to find the moment when users tend to drop off and who they are.

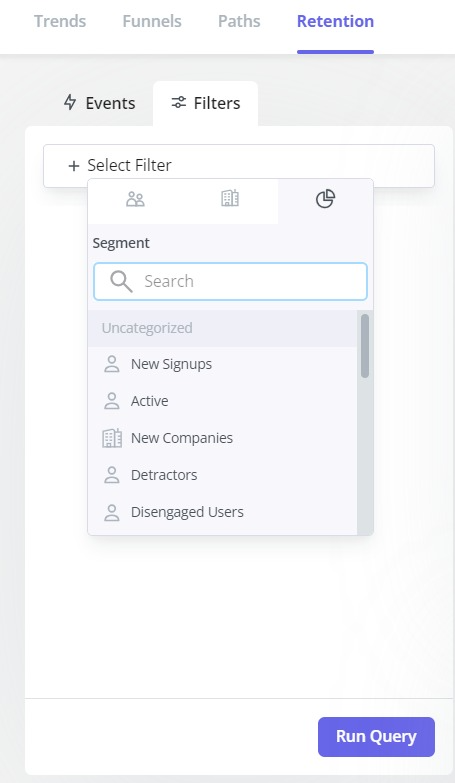
Acquisition cohorts
Next, you can use behavioral cohorts to spot patterns in user behavior and test hypotheses. For example, you can group your users into those who have completed your onboarding flows or engaged with a particular feature.

Behavioral cohorts
Step 4: Use a tool to build your cohort analysis report
Finally, it’s time to generate your cohort analysis report or cohort chart.
You’re not likely to get away with just one. That’s because your metrics are normally affected by multiple behaviors.
For example, there could be several variables impacting your retention, and you have to create user cohort reports for each of them.
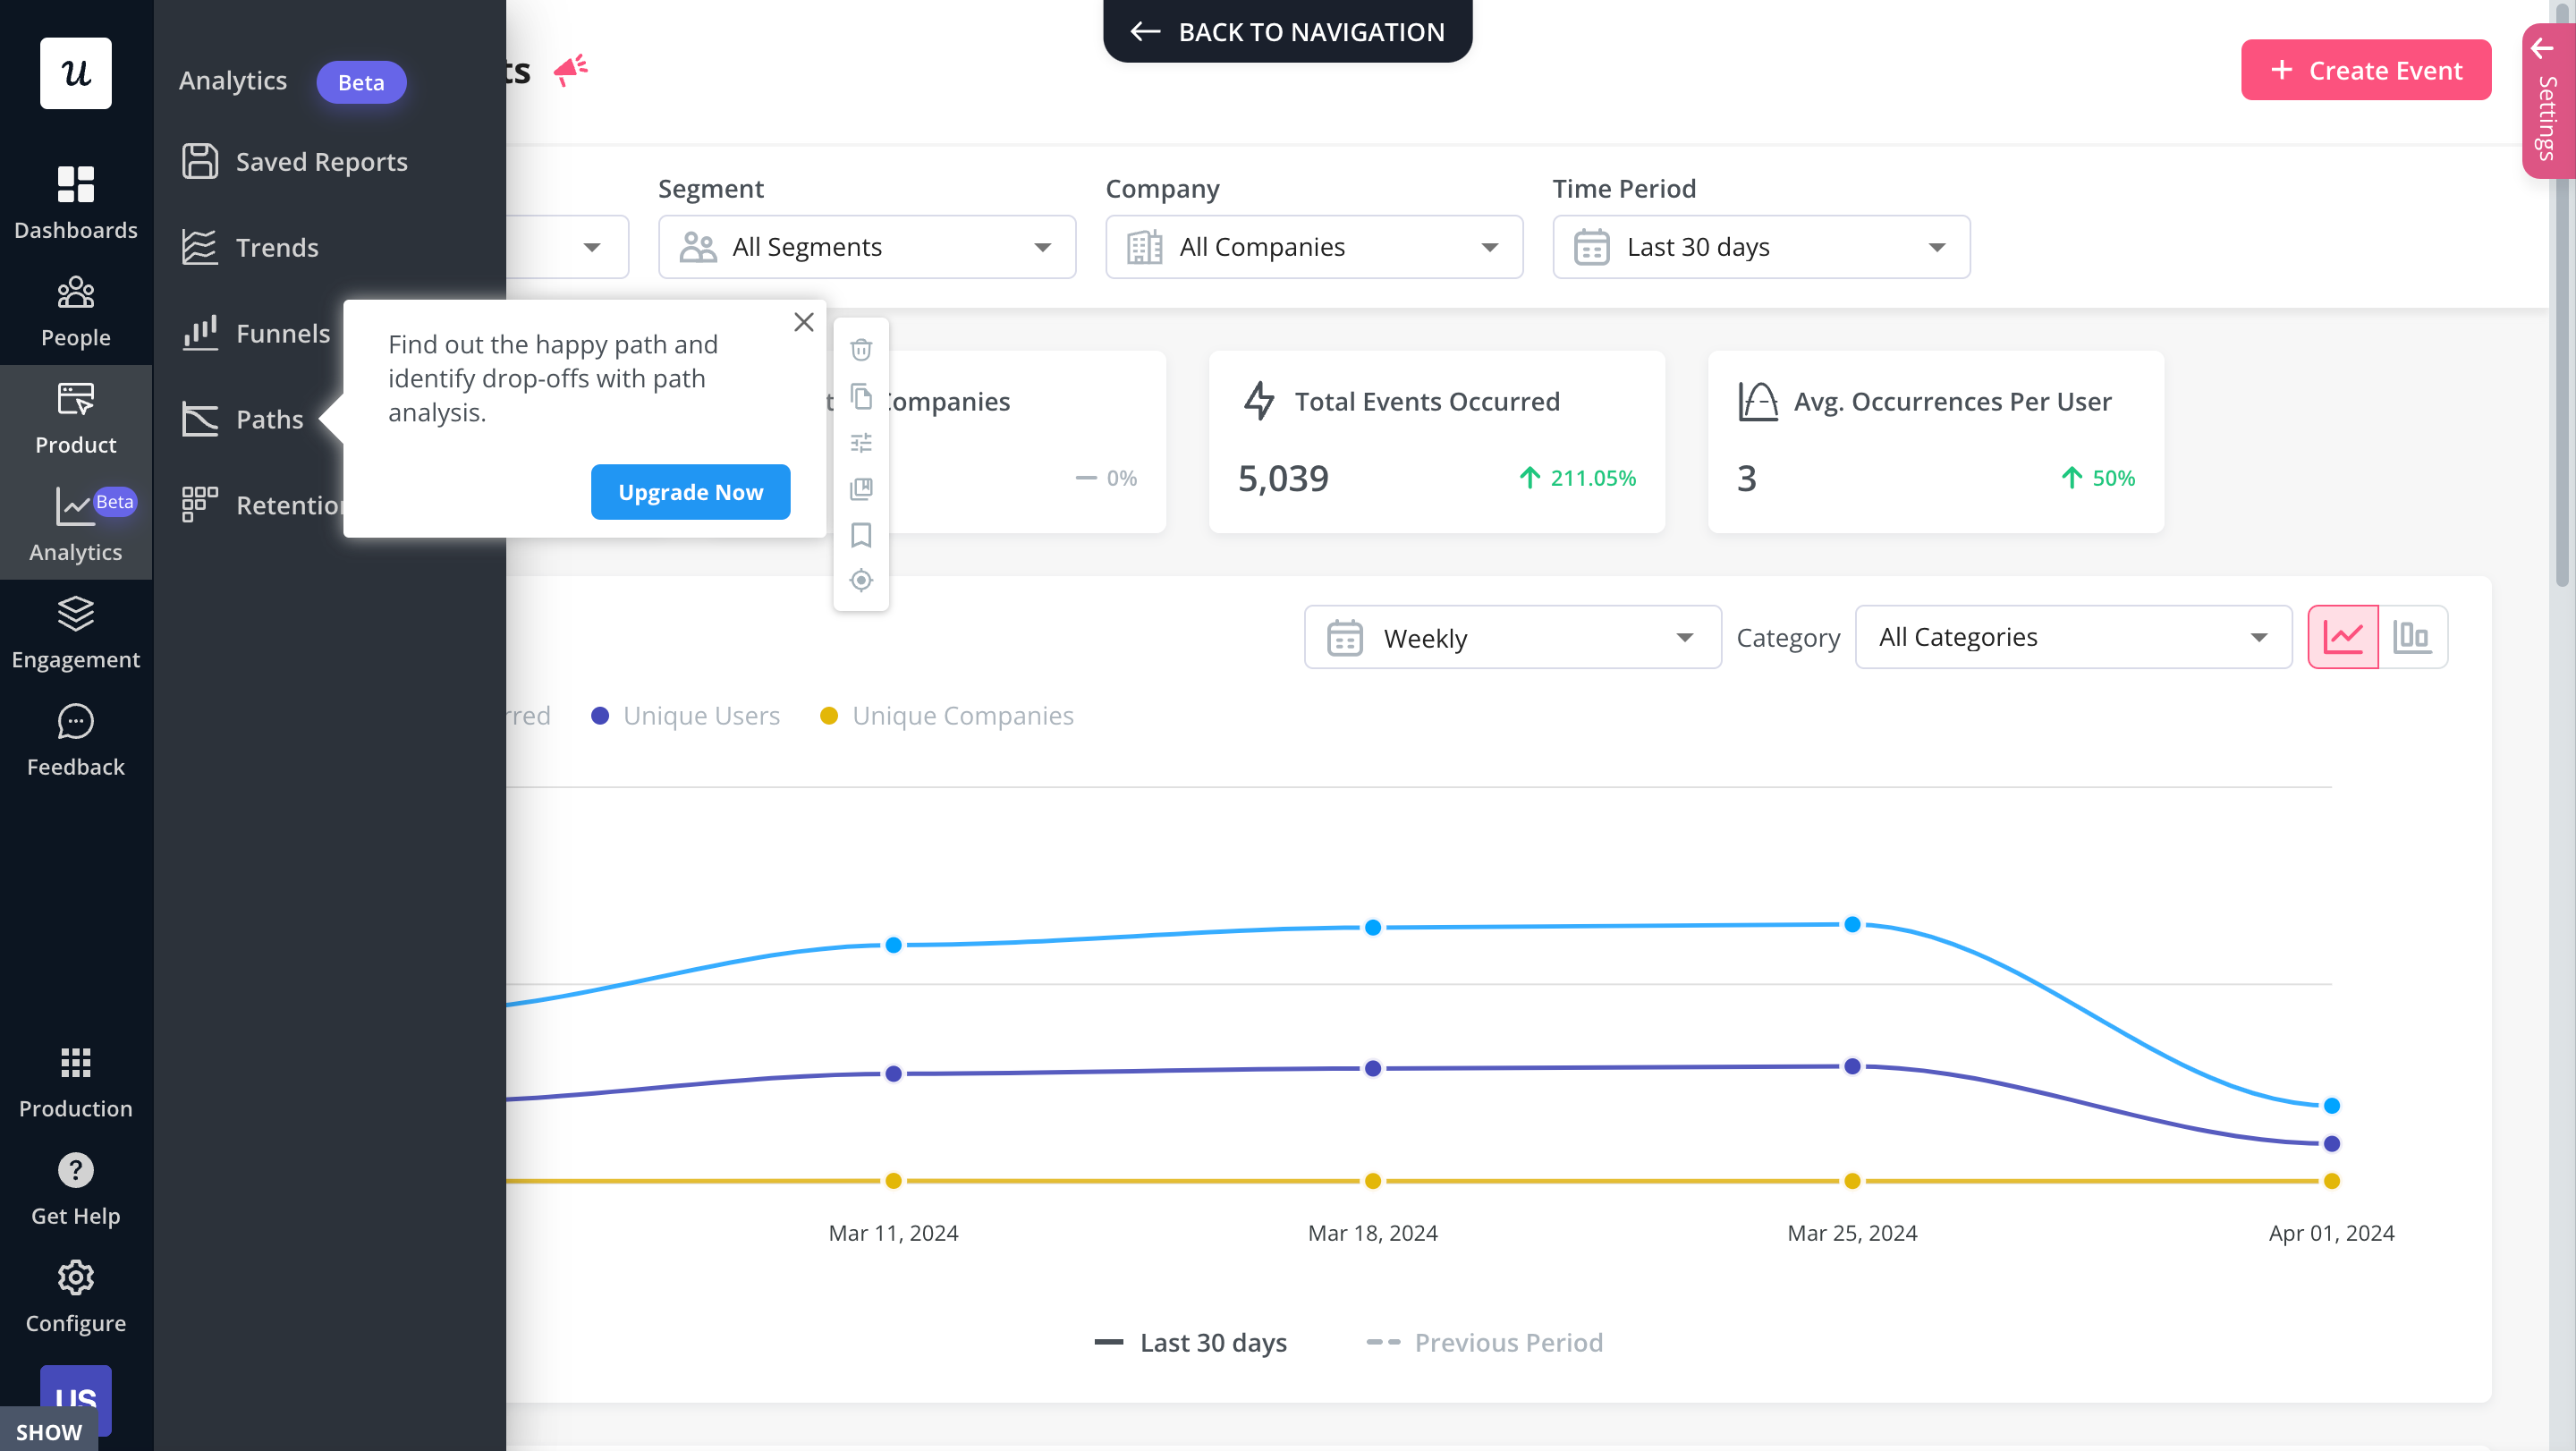
Apart from the table-style chart, some tools also enable you to visualize the data as a trend.

Line graph showing average retention data
![]()
Perform Cohort Analysis with Userpilot
Cohort analysis chart examples
Now that we have covered the basics, let’s look at examples of how to perform cohort analysis.
We’re particularly interested in two different analyses: acquisition cohort analysis and customer cohort analysis.
Acquisition cohort analysis example
Acquisition cohort analysis examines how groups of customers who were acquired during the same period behave over time.
Let’s imagine you’re a marketing manager for a fitness and weight-tracking app and you want to assess how seasonality affects customer behavior to optimize your marketing efforts.
To do so, you decide to analyze user behavior in 4 cohorts, Q1-Q4.
Having visualized the data for the 4 cohorts, you can see that users who signed up in Q1 tend to be way more engaged than users from other cohorts. Their retention, however, drops dramatically after 2 months, when they start churning en masse.
Users acquired in the other quarters tend to be less active, with the Q3 cohort having the fewest daily active users. These cohorts tend to be smaller as well.
However, the retention rates for these cohorts are higher than for Q1. Users who complete user onboarding and don’t churn in the first couple of weeks, tend to stick around for longer.
There are 3 main areas for improvement here:
- Retention of Q1 users.
- Acquisitions in Q2-Q4.
- User engagement in Q2-Q4.
To improve the retention of the Q1 cohort and increase engagement of the Q2-Q4, you decide to introduce elements of gamification to keep users motivated.
At the same time, you divert some of your marketing resources to Q2-Q4 and experiment with different acquisition channels.
As you start introducing the changes, you follow up with more cohort analyses to assess their impact.
Customer retention cohort analysis example
Customer retention cohort analysis is often used to improve user retention by identifying the causes of customer churn.
Here’s our hypothetical scenario:
As a product manager of an instant messaging app, you’re trying to boost your retention figures.
You start by conducting an acquisition cohort analysis just like the one below in order to find out when users stop engaging with the core feature of your app. We are looking at repeat engagement of the same feature here.

Example of cohort retention analysis report built with Userpilot. Check out Userpilot Analytics!
The chart reveals that most users churn between days 2 and 3 of engaging with the feature for the first time. There could be multiple reasons for that, so you work with your team to create a couple of hypotheses:
- Users who complete the onboarding checklist, have better retention.
- Users who don’t invite at least 3 teammates within the first 2 days, tend to churn.
To test the hypothesis, you create behavioral cohorts:
- users who complete and don’t complete the onboarding checklist.
- users who invite 3 or more teammates in the first two days and those who don’t.
For each, you create the report and compare the trends. This reveals that completing the checklist doesn’t affect retention dramatically. However, inviting 3 teammates does.
Based on that, you decide to optimize the checklist so that it drives the desired behavior (teammate invites).
After updating it, you follow up with another cohort analysis where you compare the before and after retention figures.
The new checklist has improved your retention but there’s still room for improvement, so you keep iterating on it to optimize it even further.
Data analytics tools for an actionable cohort analysis
You can perform cohort analysis with a spreadsheet.
The question is:
Why would you do that if there are brilliant analytics tools that will save you a lot of time and effort?
Let’s look at a few strong options to consider.
| Features | Userpilot | Heap | Google Analytics |
|---|---|---|---|
| Cohort Creation | Easily create cohorts based on user actions, demographics, and custom attributes. | Cohorts can be created based on events, properties, and user behaviors. | Limited cohort creation capabilities, primarily event-based cohorts. |
| Analysis Depth | Provides in-depth analysis with detailed cohort segmentation and visualization. | Offers robust analysis with detailed segmentation options and visualization tools. | Limited cohort analysis features, primarily focused on basic segmentation. |
| Behavioral Tracking | Tracks user behavior within the product to identify patterns and trends within cohorts. | Captures user interactions on the website or app for cohort analysis. | Limited behavioral tracking capabilities, mainly focused on website traffic analysis. |
| Automation | Allows for automated messaging and engagement based on cohort insights. | Limited automation features for cohort-specific actions. | No automation features specifically tailored for cohort analysis. |
| Integration | Integrates with various platforms and tools for data enrichment and seamless workflow. | Integrates with a wide range of tools and platforms for data enrichment and analysis. | Native integration with other Google products, limited third-party integrations. |
| Ease of Use | User-friendly interface with intuitive cohort creation and analysis workflows. | Generally intuitive interface, but may require technical knowledge for advanced analysis. | Steeper learning curve, especially for advanced cohort analysis features. |
| Pricing | Subscription-based pricing model, with tiered plans based on features and usage. | Custom pricing based on usage and specific needs. | Free to use, with premium features available in Google Analytics 360. |
Userpilot: for in-depth behavioral analytics and cohort analysis
Userpilot is a product adoption platform with advanced analytics features, including cohort analysis.
This puts it on par with dedicated analytics tools.
The thing is platforms like Amplitude or Mixpanel don’t give you any tools to act on the insights you gather and Userpilot does.
What exactly can you do with Userpilot?
Collect user behavior data
For starters, Userpilot allows you to collect accurate data on user behavior inside web apps without any coding.
Thanks to its Chrome extension, you can easily tag features and create custom events to track with a few clicks.

Custom events in Userpilot.
Build cohort retention tables
Once you have the data, you can use it to build the cohort analysis table.
Userpilot allows you to
- create cohorts on the user and company level.
- choose the start and return events defining retention in your product, like ‘Signed in’ and ‘Invited teammate’.
- filter the events by events, user, and company properties.
- choose the interval by which you view the data (days, weeks, months) and date range (e.g. last 2 weeks, or last 180 days).

Cohort analysis report in Userpilot.
Clicking on each cell reveals data on specific users that were retained.
You can also visualize the average retention as a line graph, both linear and cumulative.

Cohort trends graph in Userpilot.
Cool isn’t it?
It gets even better!
You can enhance the insights from cohort analysis by pairing it up with other analytics features:
- Heatmaps – to analyze user clicks, hovers, and text infills on a page.
- Funnel analysis – to visualize user conversions and drop-offs at key stages in the journey.
- Trends analysis – to track key metrics over time.
- Paths – to visualize all the events leading up to or following a conversion (coming in Q1, 2024).

![]()
Book Your Demo Today!
Heap: for collecting and analyzing product data
Heap is a product analytics platform with powerful functionality.
As a dedicated analytics solution, it allows you to collect granular data on how users behave at all touchpoints in the customer journey.

Cohort analysis in Heap.
The process of creating Retention reports is very similar to that in Userpilot. You set the:
- Start and Return event
- Filters
- Date range and granularity (by hour, day, week, etc)
- Whether to count every time the user completes the return event (default) or only the first time
Just like Userpilot, Heap allows you to present the data in a line graph. However, the data is more granular as you can see the trends for each cohort, not just the average.

Cohort trends graph in Heap.
Other analytics features that Heap offers include:
- Auto capture – collects data automatically without tagging
- Session replay – for UI optimization
- Heatmaps
- Illuminate – to discover friction
- Journeys – visual maps of user interactions
- Funnel analysis
![]()
Considering Heap? Try a Better Alternative!
Google Analytics: for basic cohort analysis charts
Google Analytics is the go-to solution for marketers. Traditionally, it used to be only a web analytics solution but its latest iteration, GA4, tracks events inside mobile and web apps.
GA allows you to carry out basic types of analysis, like funnel and cohort analysis.
To conduct cohort analysis, choose
- Dimension/cohort type (like acquisition date)
- Size of cohorts (e.g. day, week, or month for acquisition cohorts)
- The metric to evaluate (e.g. retention)
- The date range and number of cohorts

Cohort analysis in Google Analytics.
The visualization consists of 2 parts: the graph and the table.
For more granular insights, GA allows you to break down the data by segments. For example, you can view only mobile traffic and events.
Conclusion
Cohort analysis is a powerful tool that allows you to track user retention over time and analyze how the behavior of different user groups affects your key performance metrics.
When combined with other analytics tools, like funnel analysis, it can offer actionable insights that teams can use to improve product performance and customer experience.
If you want to learn more about cohort retention analysis in Userpilot, book the demo!
![]()
Try Userpilot and Take Your Cohort Analysis to the Next Level

