Best Amplitude Alternatives for SaaS

Exploring alternatives to Amplitude? With plenty of choices available, it’s difficult to decide which one will be the right fit.
The crux of the issue is – to make the right choice, you need to account for your priorities: your different jobs to be done, your budget, and the size of the company. But don’t worry – we’re coming to help!
In this post, we’ll discuss exactly that – which Amplitude competitor is best depending on the different use cases.
Let’s dive in!
TL;DR
- Amplitude is a powerful analytics tool that gives organizations in-depth, real-time insights into product usage and user behavior. It offers various features, including event segmentation, funnel analysis, user cohorts, and retention analysis.
- With Amplitude, you can create a custom dashboard to collate multiple charts and reports on a single page. Amplitude’s robust behavior analytics help product and growth teams improve product adoption, identify new monetization opportunities, and maximize customer lifetime value.
- Are you wondering if Amplitude is the right product analytics tool for you? Here are a few scenarios where it may not be the ideal fit:
- You’re on a budget – Amplitude’s Growth and Enterprise plans are costly. User reviews reveal that the Growth plan starts at $995 per month. Also, the pricing models are complex because you don’t pay based on the number of monthly users but by monthly events. It can be a hefty investment for early-stage startups and small businesses.
- You want to act on product data – Despite its sophisticated analytics features, Amplitude doesn’t have built-in functionalities to turn product data into actions. You’ll need a product adoption platform like Userpilot to drive user engagement based on Amplitude’s analytics.
- You lack in-house expertise – Amplitude isn’t the simplest product analytics tool out there. You’ll need a smidge of coding knowledge to set up your dashboard and track events. If you don’t have an in-house data analytics team with a technical background, you might be better off looking for alternatives.
- Here are the top Amplitude alternatives you can consider:
- Userpilot is a product growth platform that drives user activation, feature adoption, and expansion revenue. It also helps product teams collect user feedback, streamline onboarding, and gather actionable insights from analytics. With Userpilot, you’ll be able to track both product usage and user behavior to get a holistic view of how customers use your product — which will guide future development, improve the user experience, and inform your growth efforts.
- Mixpanel is a simple and powerful product analytics tool that allows product teams to track and analyze in-app product engagement. It allows your team to see every moment of the customer experience clearly, so you can make changes that work. In addition, it lets you explore data freely without using SQL. Set up your metrics to measure growth and retention. Slice and dice data to uncover trends and see live updates on how people use your app.
- Heap is a robust product analytics platform that provides users with a plethora of in-depth insights into customer behavior and needs. With Heap, you can track user interactions in real time across all touch points within your product. Insights from Heap help you dig deeper into the paths users take when navigating your product and identify precise points of friction. Plus, the platform uses sophisticated data science capabilities to help you make better-informed, data-driven decisions to improve user experience.
- Google Analytics is a web analytics service offered by Google that tracks and reports website traffic and mobile app traffic and events, currently as a platform inside the Google Marketing Platform brand.
- Interested in driving product growth without coding? Book a demo to see how we can help!
![]()
Try Userpilot and Drive Product Growth with Actionable Insights

What is Amplitude?
Amplitude is a powerful analytics tool that gives organizations in-depth, real-time insights into product usage and user behavior. It offers various features, including event segmentation, funnel analysis, user cohorts, and retention analysis.
With Amplitude, you can create a custom dashboard to collate multiple charts and reports on a single page. Amplitude’s robust behavior analytics help product and growth teams improve product adoption, identify new monetization opportunities, and maximize customer lifetime value.
What are the main use cases for Amplitude?
Understanding the core functionalities and use cases of Amplitude is crucial for deciding whether or not it’s the right choice for you.
Without further ado, let’s see the primary scenarios where Amplitude is useful for your SaaS business!
Amplitude for product analytics
As a digital analytics platform, Amplitude is designed to provide you with a plethora of useful product-related insights. Whether you want to assess feature adoption or track conversions, Amplitude’s powerful analytics eliminate guesswork from the process. You can share these real-time analytics among different teams to facilitate collaboration.
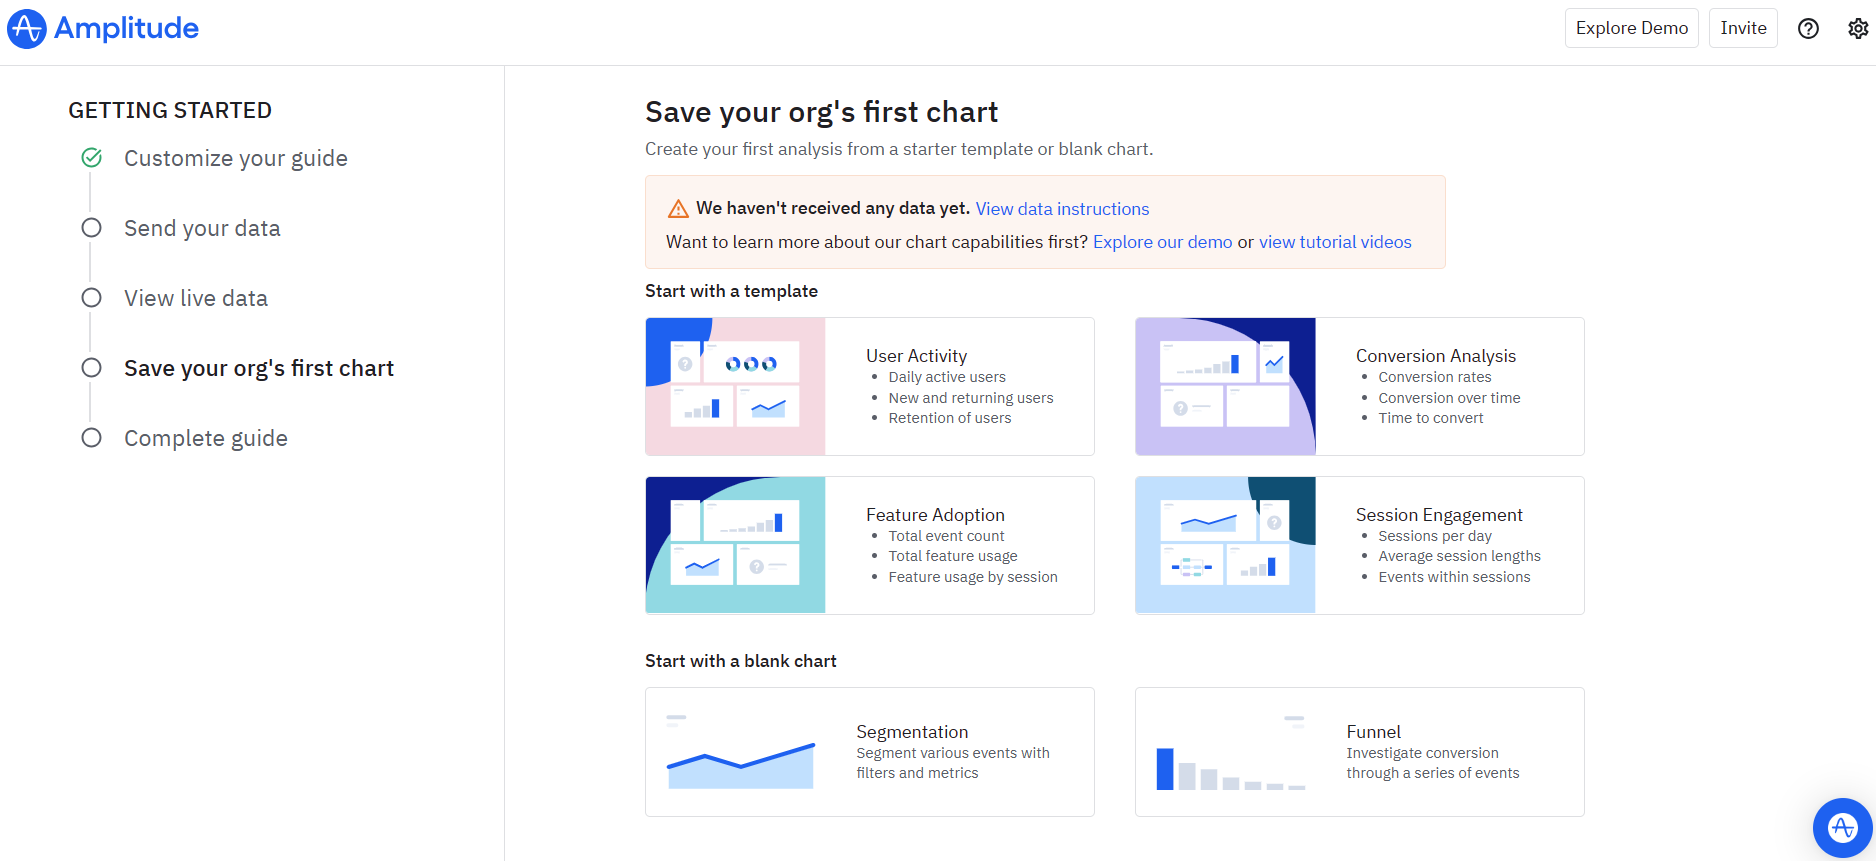
The features that facilitate seamless access to product analytics include:
- Automated report generation (with actionable insights).
- Instant visualizations (to map user journeys and understand product usage).
- Event recommendation (so you know what events and metrics to track).
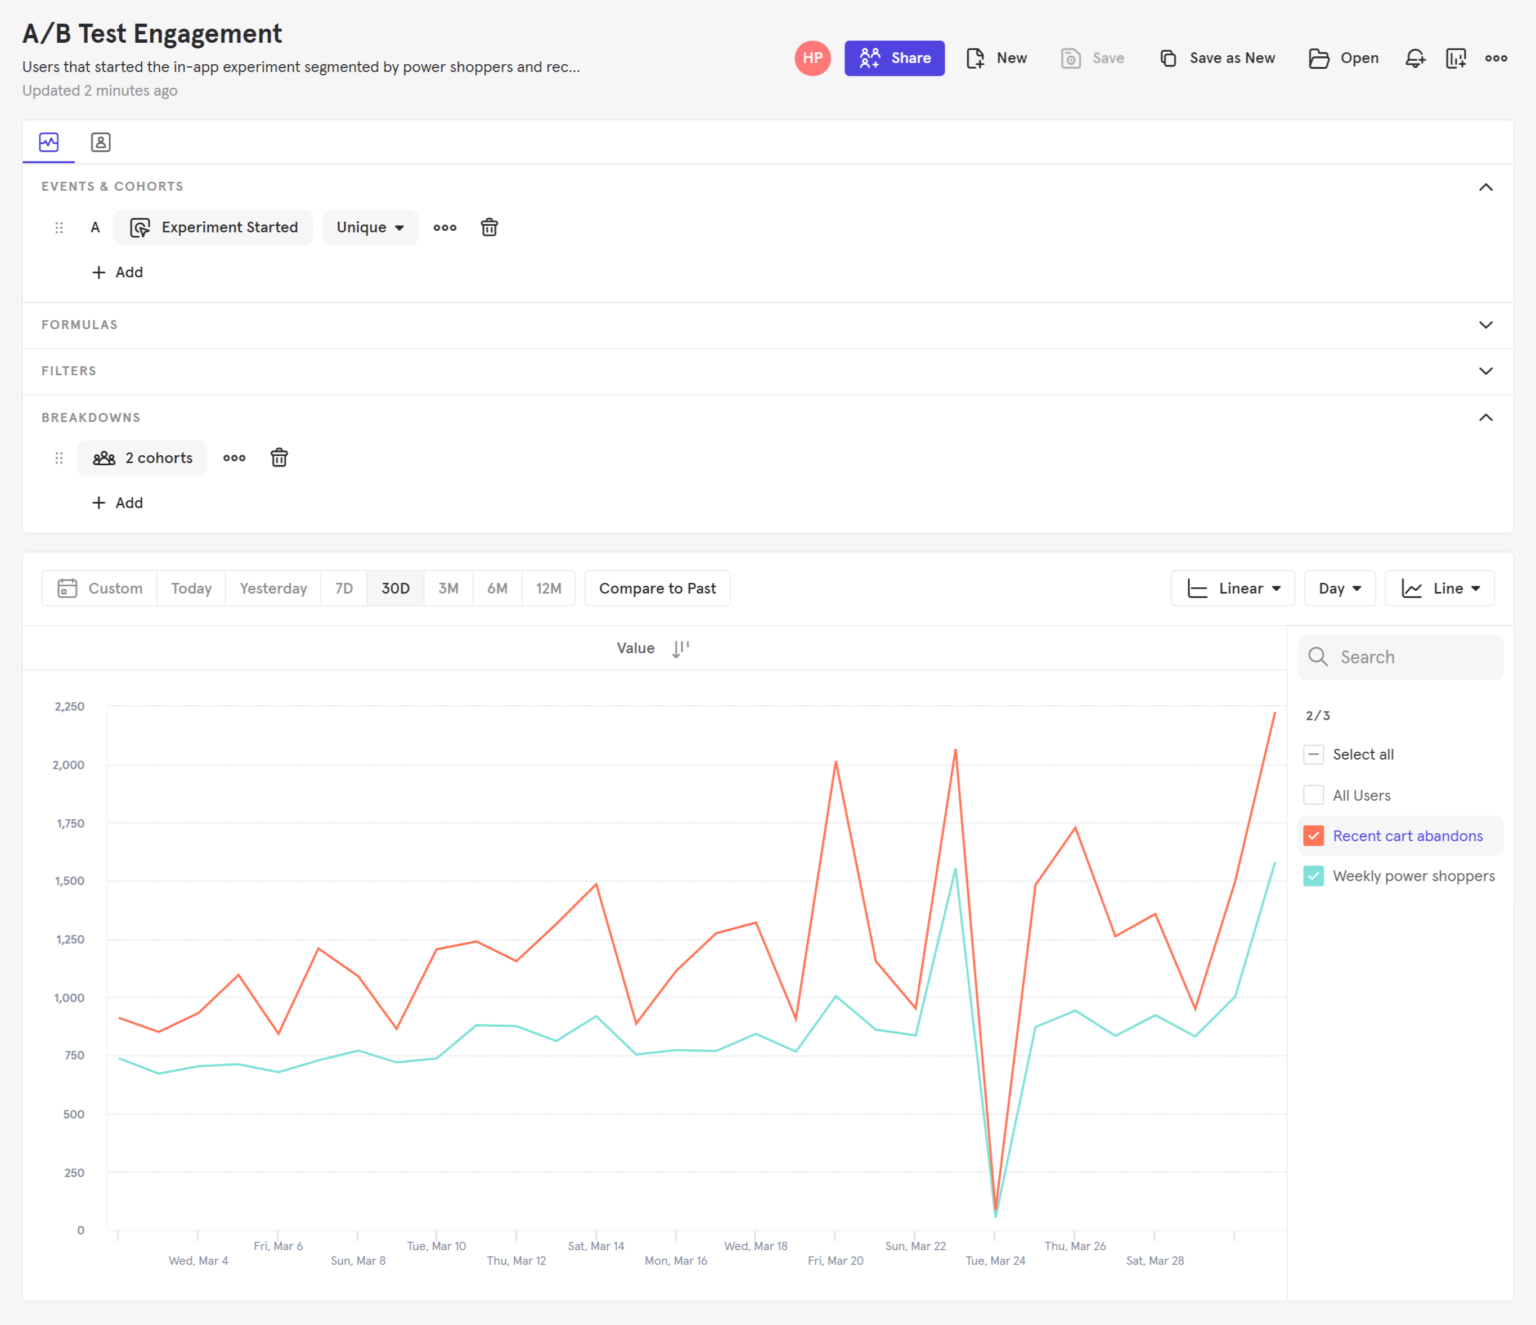
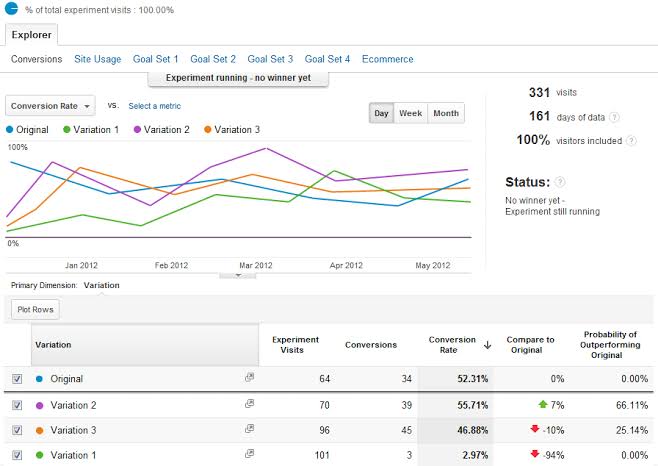
Amplitude for A/B testing
Whether you’re rolling out a product update or releasing new features, Amplitude’s A/B testing capabilities can be of great help. They eliminate the need for multiple tools to implement tests and track results at scale.
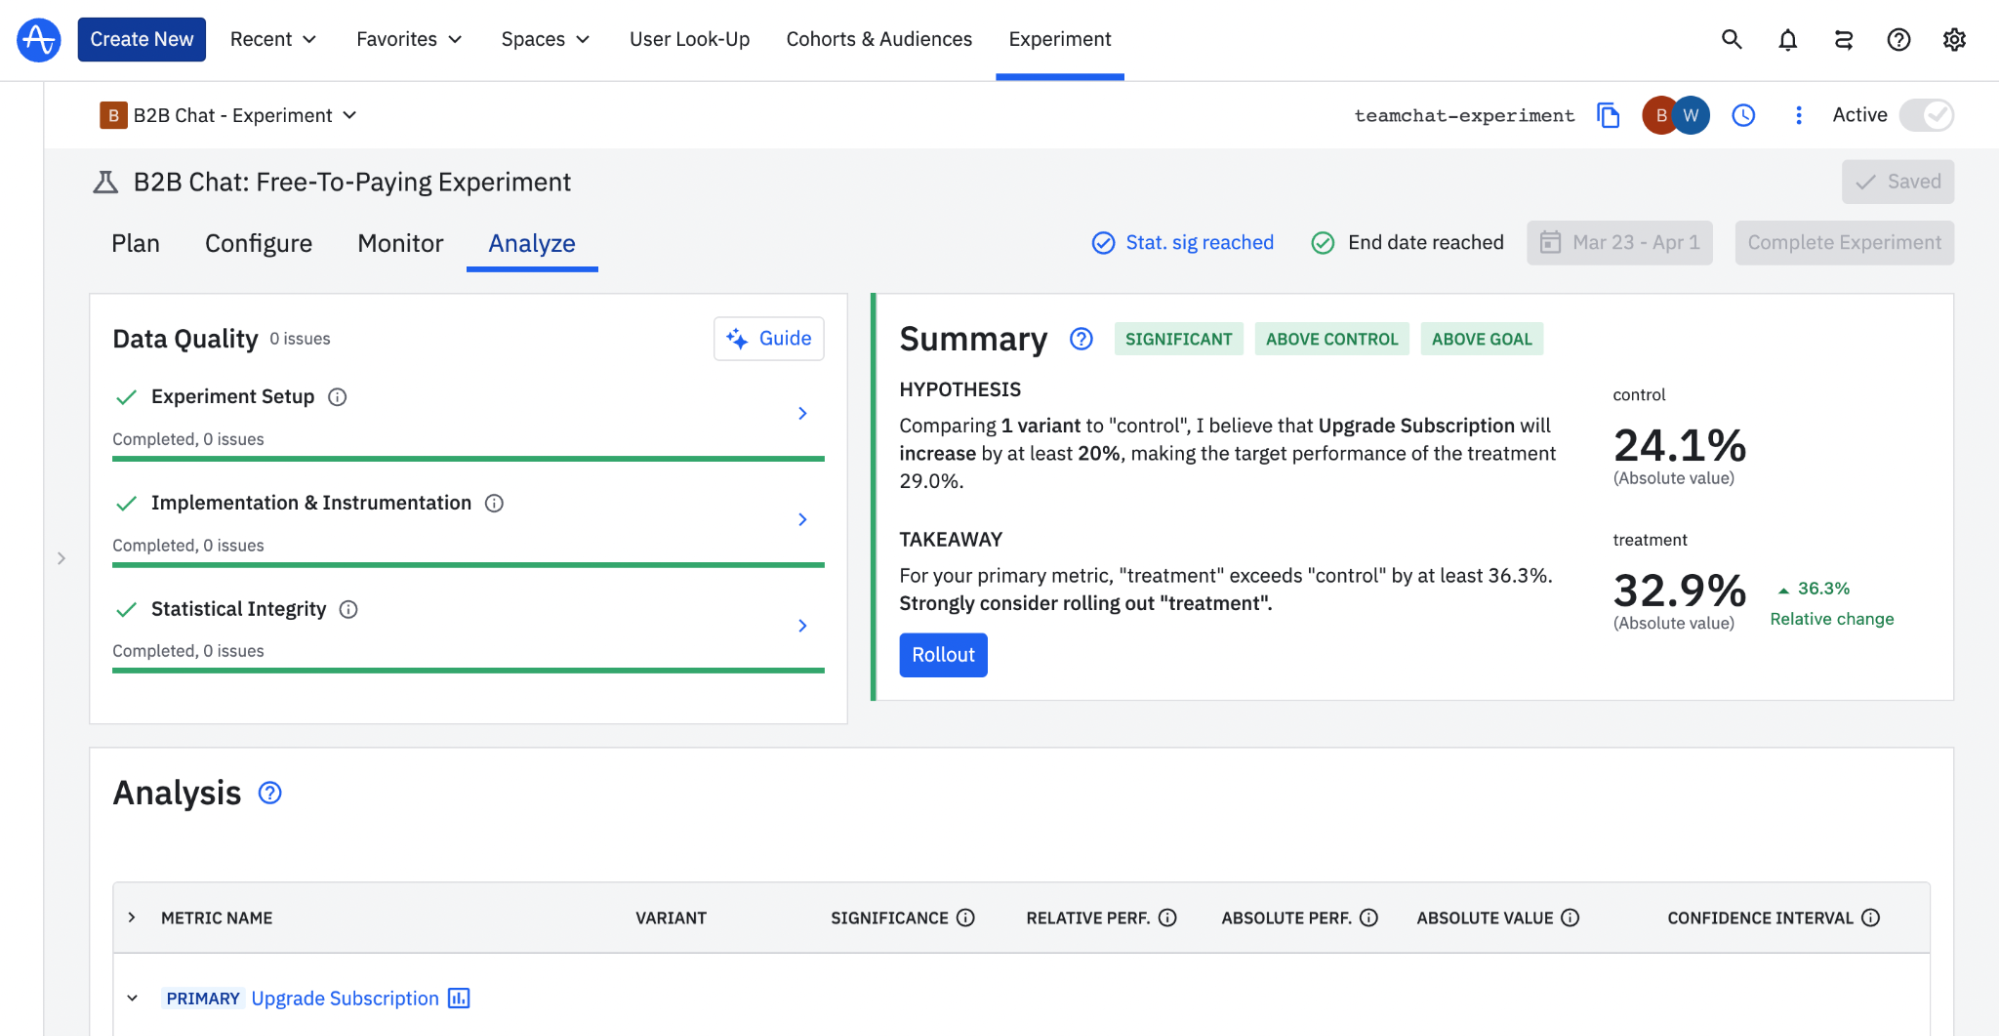
A/B testing feature on Amplitude.
With Experiments (Amplitude’s A/B testing feature), you can:
- Set up and implement A/B tests by defining control groups and variant groups.
- Select the metrics/events/goals you want to track for an A/B test.
- Collect and analyze user behavior data to evaluate different product/feature variations.
- Generate meaningful reports to interpret the results of A/B tests.
But that’s pretty much it. You can’t act on the data using Amplitude. If you’re looking for a platform that lets you act based on A/B testing data, Userpilot would be a better choice. Amplitude also lacks the ability to run multivariate tests.
Amplitude for behavioral analytics
With Amplitude, you can take a deep dive into user activity and behavior. You can generate relevant reports to identify patterns and actionable insights based on user data.
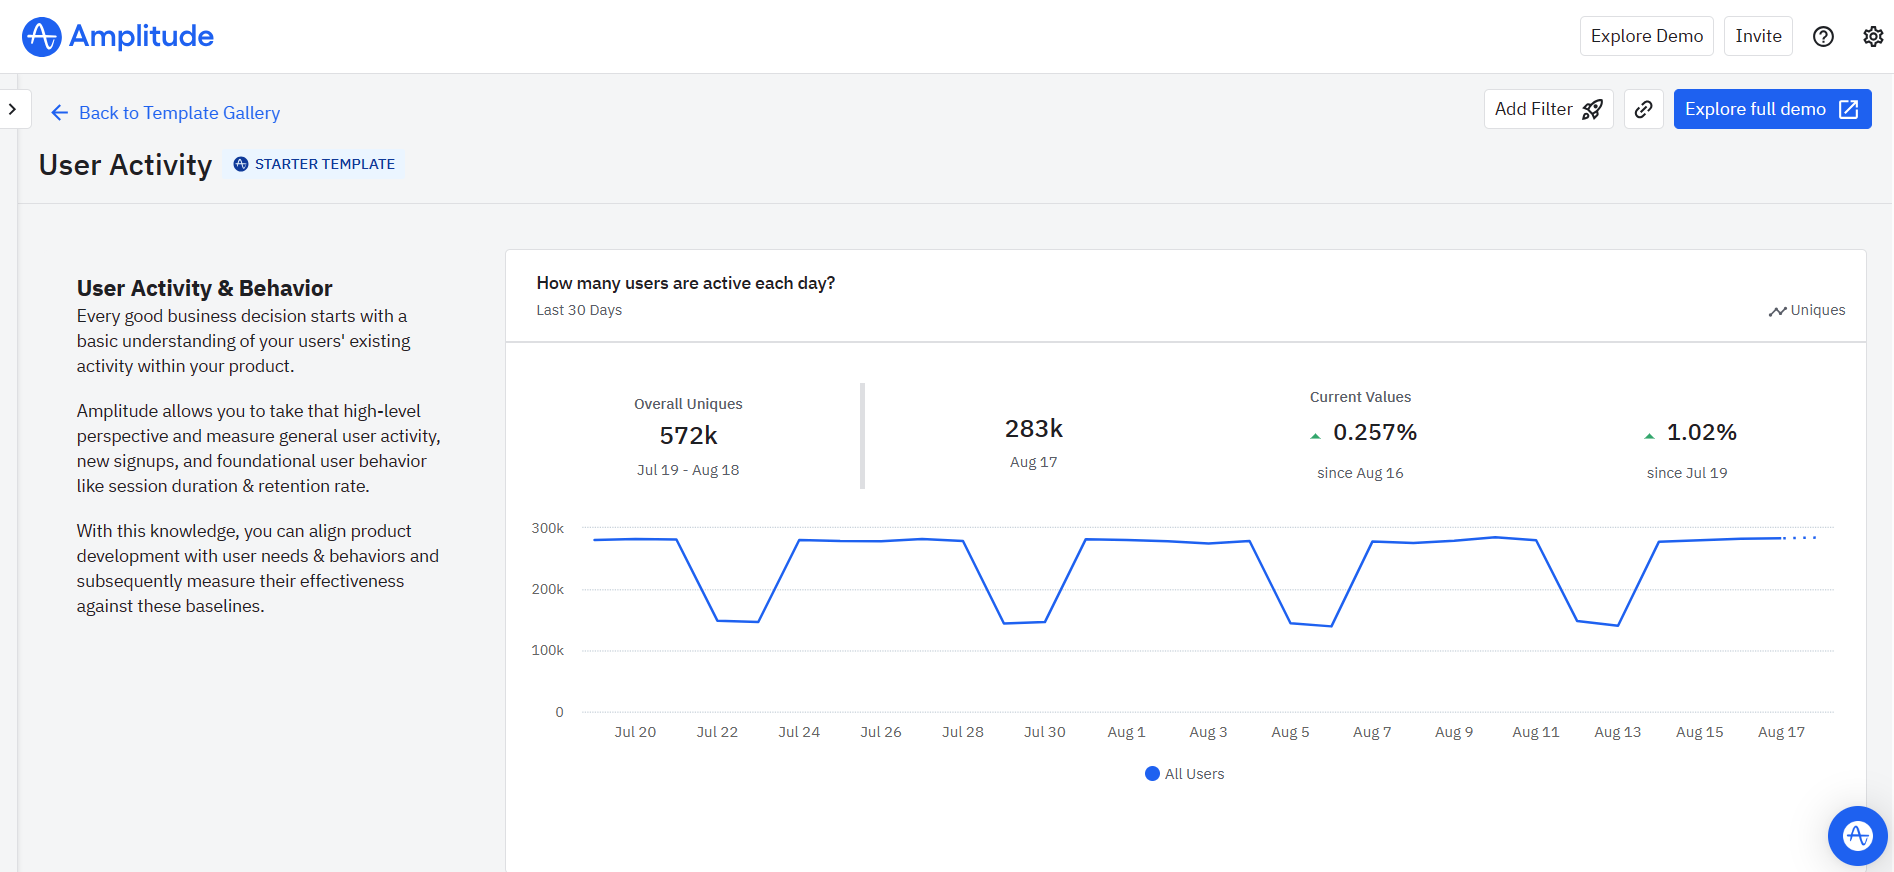
Amplitude user activity report.
Besides tracking user activity, the following functionalities of Amplitude help you conduct advanced behavioral analytics:
- Retention and stickiness analysis.
- Predictive analytics.
- A/B testing.
- Funnel analysis.
With detailed reports available for each, you can understand your users better and provide them with exactly what they want, leading to a better user experience.
What are the pros and cons of Amplitude?
Pros of Amplitude?
Amplitude is one of the most feature-packed stand-alone product analytics platforms for digital products at the moment. It’s designed to meet the needs of modern product and growth teams that want to embrace data-driven decision-making.
Let’s take a closer look at the benefits of Amplitude:
- Advanced product analytics – Amplitude enables you to dig deep into user behavior, including how they interact with your product and where they convert or drop off.
- Cross-platform analytics – Amplitude lets you track product usage across native apps, web apps, and web pages. It can help you understand how users move between these platforms.
- Designed for collaboration – It enables you to easily share dashboards and reports with other team members. Amplitude also facilitates collaboration among different teams, including product, marketing, and customer success.
- Powerful integrations – Amplitude connects with more than a hundred platforms, including data warehouses, marketing automation tools, ad networks, and customer data platforms. This helps you harness the full potential of product and user behavior data.
- Customer education – Amplitude offers an extensive resource center and a community where you can connect with product analytics experts. Moreover, you get easy access to a chatbot and help center from your dashboard.
Cons of Amplitude?
Despite its impressive suite of features, Amplitude comes with a few drawbacks. These include:
- Steep learning curve – Amplitude’s fully customizable dashboards can be intimidating for new users. You’ll need basic technical knowledge to set up and track events using Amplitude. It may not be particularly suitable for teams without in-house analysts.
- No user engagement functionalities – While Amplitude offers a ton of user behavior data, it doesn’t provide any tools to act on these insights. In contrast, a product adoption platform like Userpilot lets you harness usage and behavior data to optimize in-app experiences.
- Lack of automated event tracking – Amplitude doesn’t automatically track events like clicks, page views, and swipes. You have to define the events you want to track before getting started.
What do users say about Amplitude?
Amplitude is a favorite among users, with a rating of 4.5 (out of 5 stars) on G2 and 4.6 stars (out of 5) on Capterra. Most users praise the diversity of reports, the wide range of integrations, and prompt customer support.
Here’s what a happy Amplitude user had to say:
“A complete Analytics ecosystem developed with an agile and fast iteration in mind”
Unlike other analytics frameworks, Amplitude is data-centric, not project-centric. Amplitude gives complete control to users to create custom charts with custom data. Amplitude is easy to integrate into Android, web, and Unity without much hassle. Amplitude has a user-lookup feature where users can test live data without much delay. The strong feature of Amplitude is flexible data filtering. Consider a scenario where a project needs to analytics player who has restarted the level with a certain number of coins and XP. Users can easily create charts to analyze the data in real-time. Amplitude gives users full ownership of the data and a wide range of tools to give meaningful relationships amongst them. Amplitude does have a free plan that has a promising number of features for a startup product analytics. Amplitude project is fully open source, so If there is an issue with the library itself developers will try to resolve it.
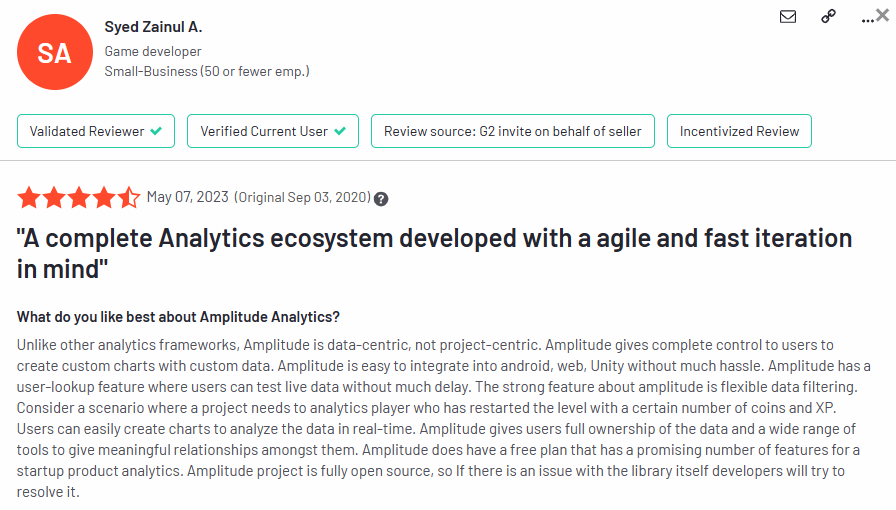
Positive G2 review of Amplitude.
While most users are satisfied with Amplitude’s features, a few have complained about the steep learning curve and higher price point. They’ve also pointed out how the company rolls out updates that render certain existing features obsolete.
Here’s what an Amplitude user had to say about their experience:
“Unrivaled analytics tool, though pricing may discourage small business adoption.” My primary gripe with Amplitude has always been its documentation, which was scattered across 2 or 3 websites, leading to fragmented content. Although they’ve made strides in improving this issue recently, it remains somewhat disorganized. Another shortcoming is the lack of practical, real-life examples or use cases. Much of this content is housed within their community site, which was not well-promoted until recently. For instance, I never received updates about products and features and only discovered that I needed to register with the Community to receive them—a major oversight, in my opinion. Lastly, the high price tag poses a challenge for small businesses, early-stage, and even medium-sized startups. – Raphael P., Head of Product (small business)
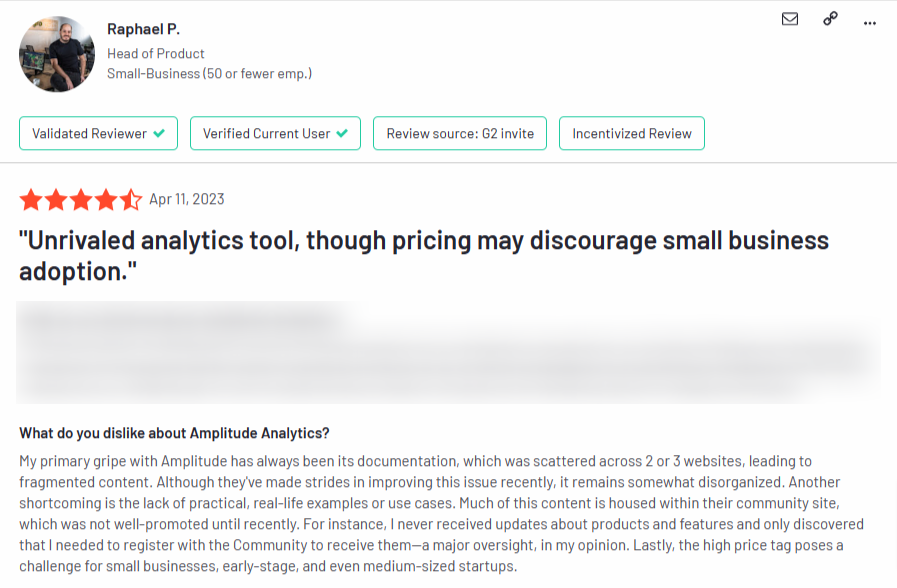
Negative review of Amplitude on G2.
Does Amplitude fit your budget?
Amplitude offers three distinct pricing tiers:
- Starter – A free plan suitable for small teams.
- Plus – Starting from $49 a month if paid annually. It includes everything on the Starter plan plus unlimited product analytics, custom dashboards, and formulas, etc.
- Growth – Include everything on the Plus plan and additional offers such as advanced behavioral analysis, custom metrics for KPIs, etc; pricing is available on request and depends on your requirements.
- Enterprise – Includes advanced governance and security features; pricing is available on request.
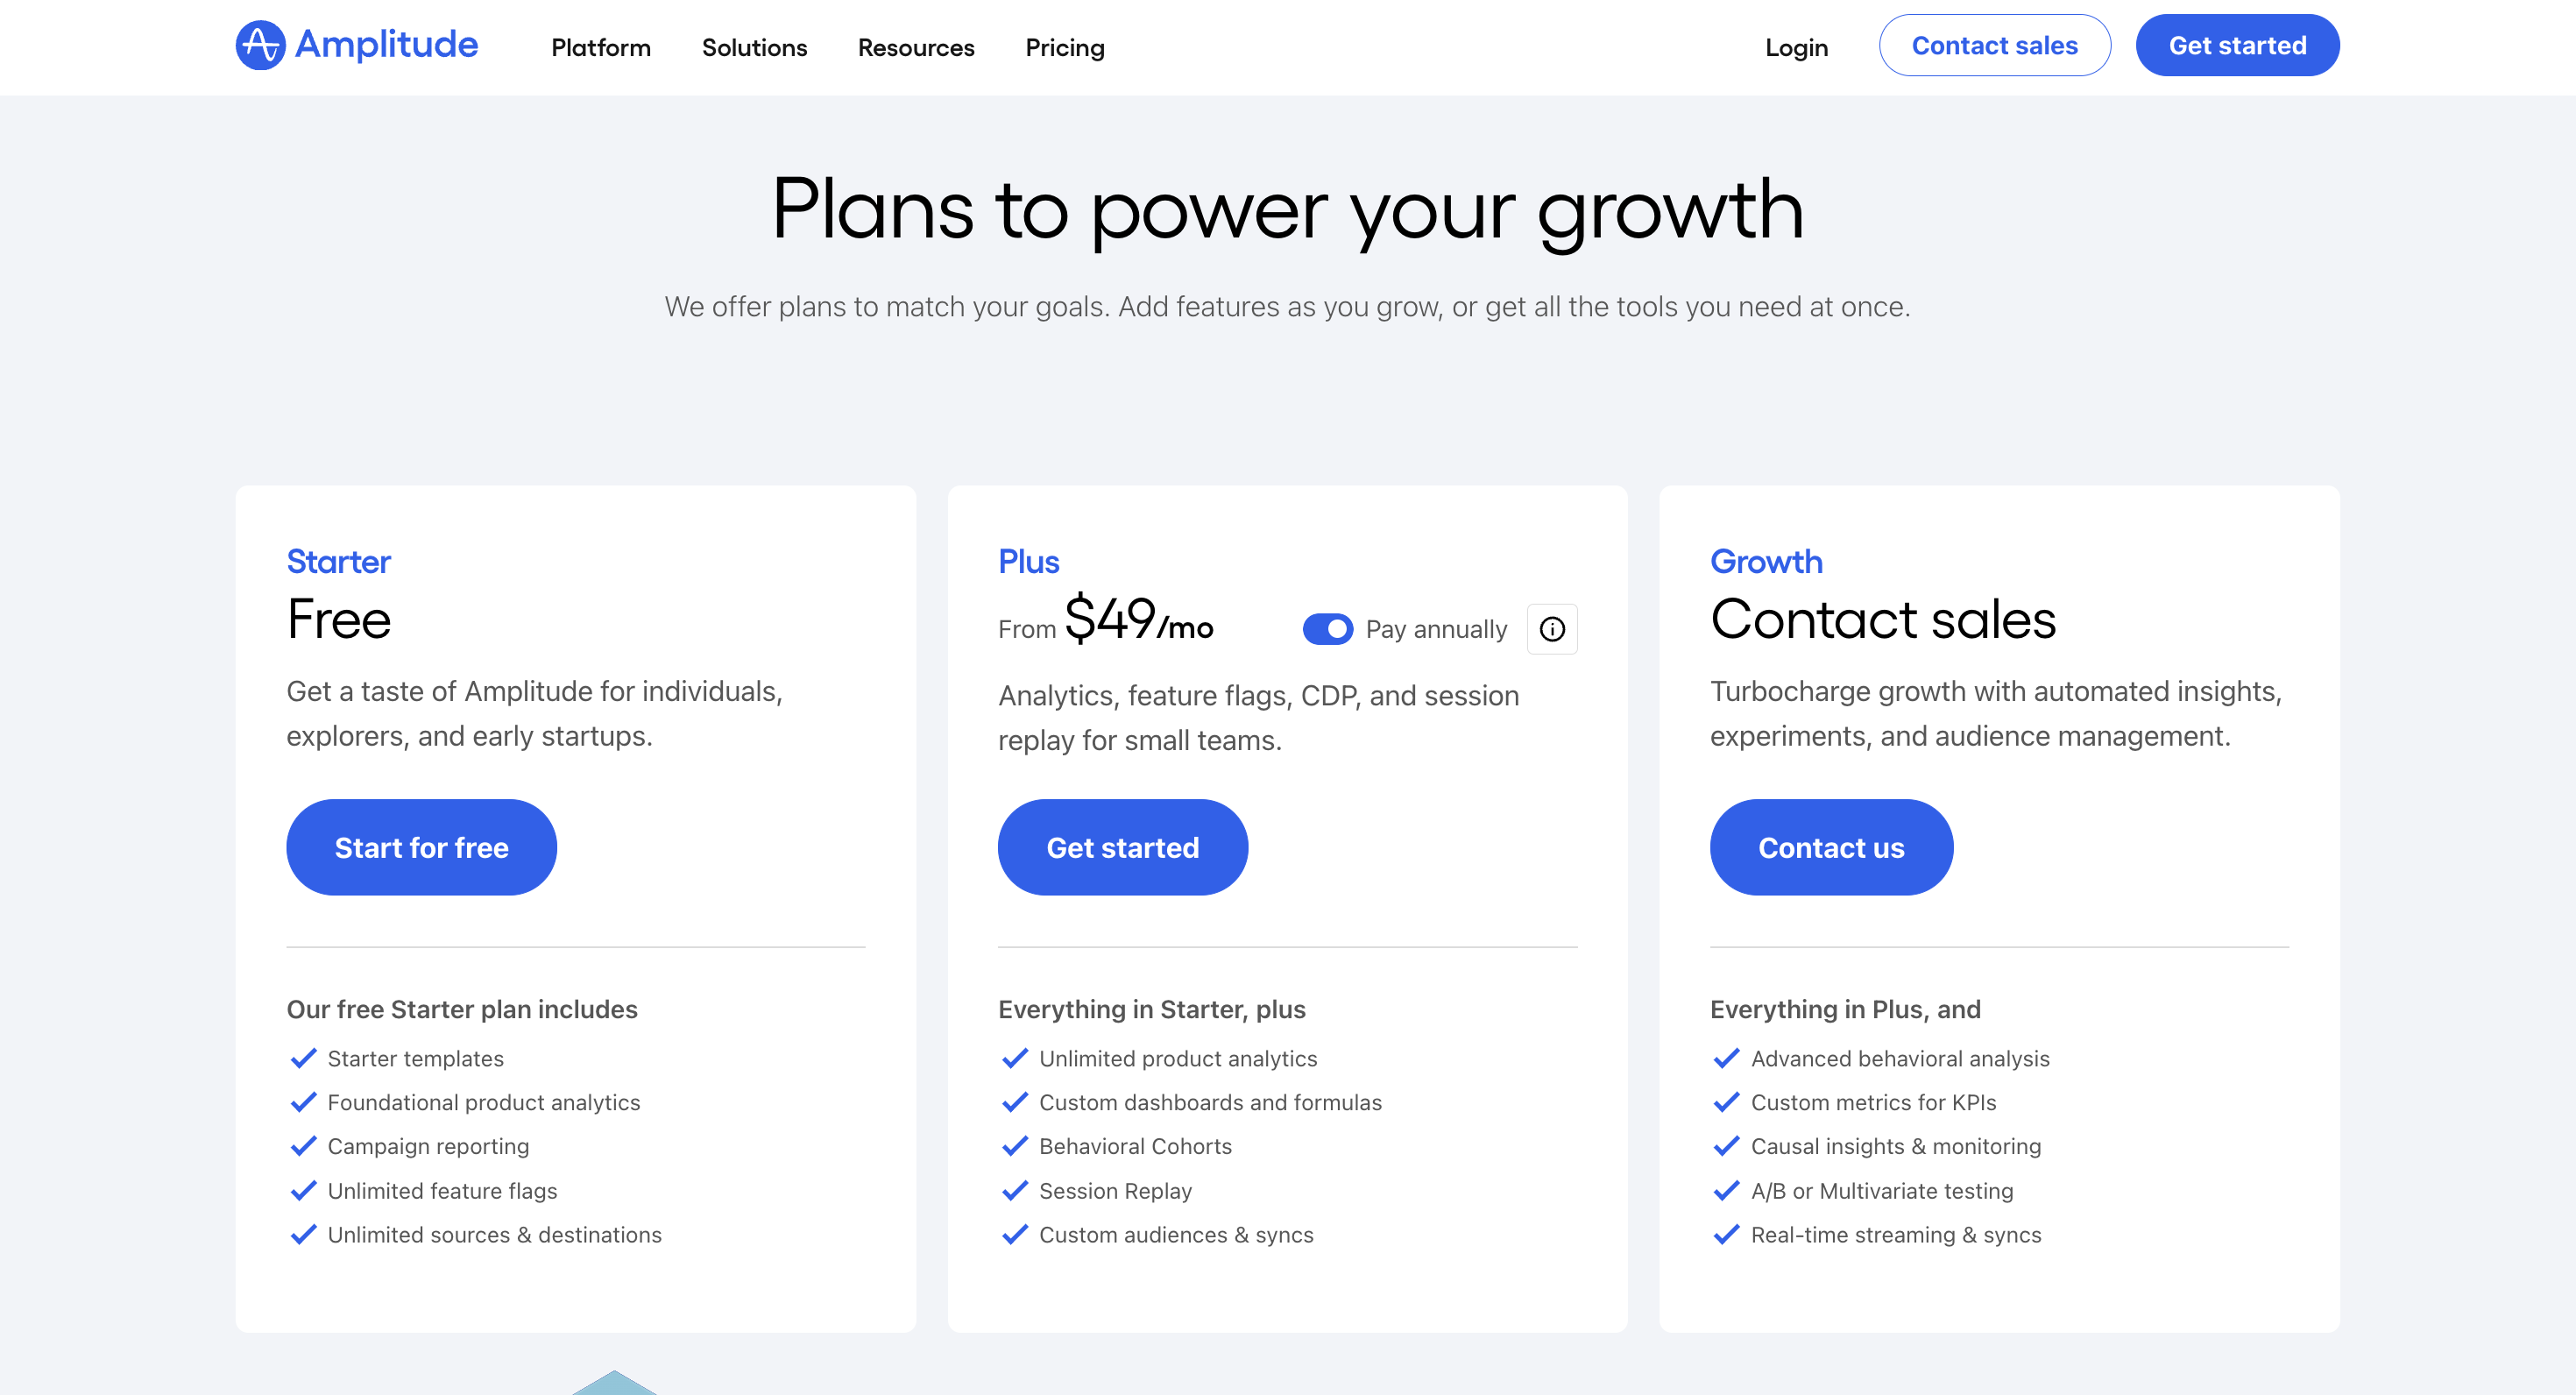
Amplitude also offers a free annual subscription to the Growth Plan for startups with under $5M in funding and fewer than 20 employees.
However, it’s worth noting that Amplitude’s pricing plans are complex because they’re based on the number of monthly events or features. Other tools like Mixpanel and Userpilot offer more transparent pricing based on the number of monthly active users.
3 Reasons why you might need an Amplitude alternative
Are you wondering if Amplitude is the right product analytics tool for you? Here are a few scenarios where it may not be the ideal fit:
- You’re on a budget – Amplitude’s Growth and Enterprise plans are costly. User reviews reveal that the Growth plan starts at $995 per month. Also, the pricing models are complex because you don’t pay based on the number of monthly users but by monthly events. It can be a hefty investment for early-stage startups and small businesses.
- You want to act on product data – Despite its sophisticated analytics features, Amplitude doesn’t have built-in functionalities to turn product data into actions. You’ll need a product adoption platform like Userpilot to drive user engagement based on Amplitude’s analytics.
- You lack in-house expertise – Amplitude isn’t the simplest product analytics tool out there. You’ll need a smidge of coding knowledge to set up your dashboard and track events. If you don’t have an in-house data analytics team with a technical background, you might be better off looking for alternatives.
Better alternatives to Amplitude
Considering alternative options to Amplitude can often lead to discovering more tailored solutions that better suit your needs. Here are the top Amplitude alternatives you can consider:
- Userpilot is a product growth platform that drives user activation, feature adoption, and expansion revenue. It also helps product teams collect user feedback, streamline onboarding, and gather actionable insights from analytics. With Userpilot, you’ll be able to track both product usage and user behavior to get a holistic view of how customers use your product — which will guide future development, improve the user experience, and inform your growth efforts.
- Mixpanel is a simple and powerful product analytics tool that allows product teams to track and analyze in-app product engagement. It allows your team to see every moment of the customer experience clearly, so you can make changes that work. In addition, it lets you explore data freely without using SQL. Set up your metrics to measure growth and retention. Slice and dice data to uncover trends and see live updates on how people use your app.
- Heap is a robust product analytics platform that provides users with a plethora of in-depth insights into customer behavior and needs. With Heap, you can track user interactions in real time across all touch points within your product. Insights from Heap help you dig deeper into the paths users take when navigating your product and identify precise points of friction. Plus, the platform uses sophisticated data science capabilities to help you make better-informed, data-driven decisions to improve user experience.
- Google Analytics is a web analytics service offered by Google that tracks and reports website traffic and mobile app traffic and events, currently as a platform inside the Google Marketing Platform brand.
Let’s see the features and functionalities of these tools for different use cases!
Amplitude vs Userpilot
There are many ways in which Userpilot is different (and in a lot of ways better!) from Amplitude. Let’s explore the features of Userpilot, how it’s better than Amplitude, and how it may fall short too.
Userpilot for product analytics
Product analytics lets you collect and analyze data about how users interact with your product so you can extract actionable insights. Userpilot lets you look at granular product analytics, such as which features have the highest adoption rates, and big-picture insights like trend reports. Here are Userpilot’s top product analytics features:
- Feature tagging: Userpilot’s click-to-track feature tagger lets you view how many times a feature has been used and by how many users to measure its adoption. Users on the Starter plan can add up to 10 feature tags while those on the Growth or Enterprise tier can create unlimited tags.
No-code feature tags in Userpilot.
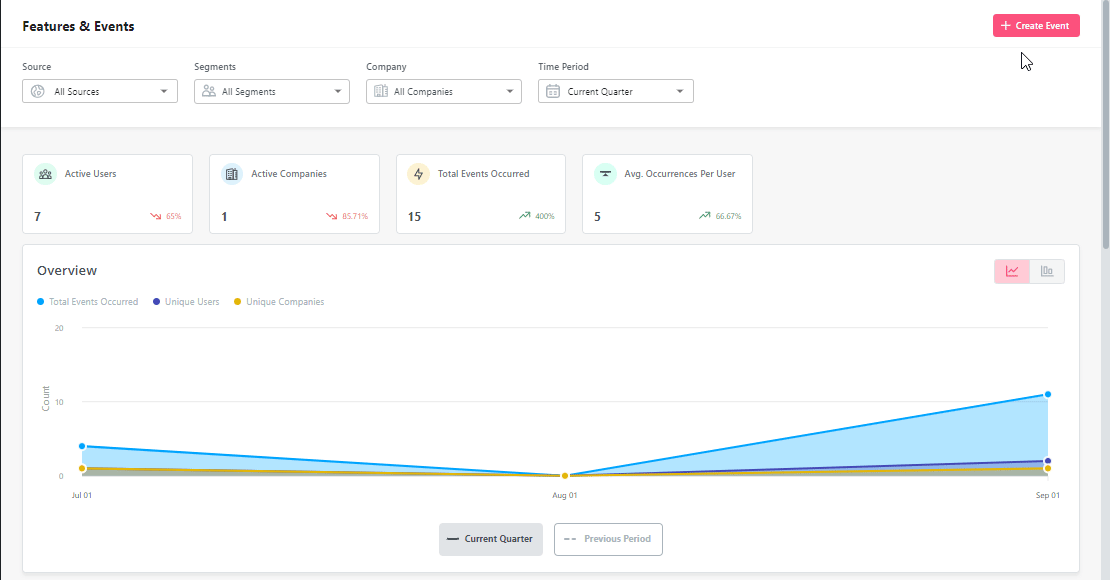
- Event-tracking: Alongside no-code feature tags for feature engagement tracking, you can also track other events unique to your product using event-tracking. You can also create a group of events to track a specific process i.e. onboarding, subscription, etc.
Create tracked events to monitor server-side data.
- Trends and funnels: Userpilot’s trends and funnels report lets you extract actionable insights from big data. You’ll be able to see which stage of an onboarding/conversion funnel most users drop out on and create trend reports with detailed breakdowns by user or period.
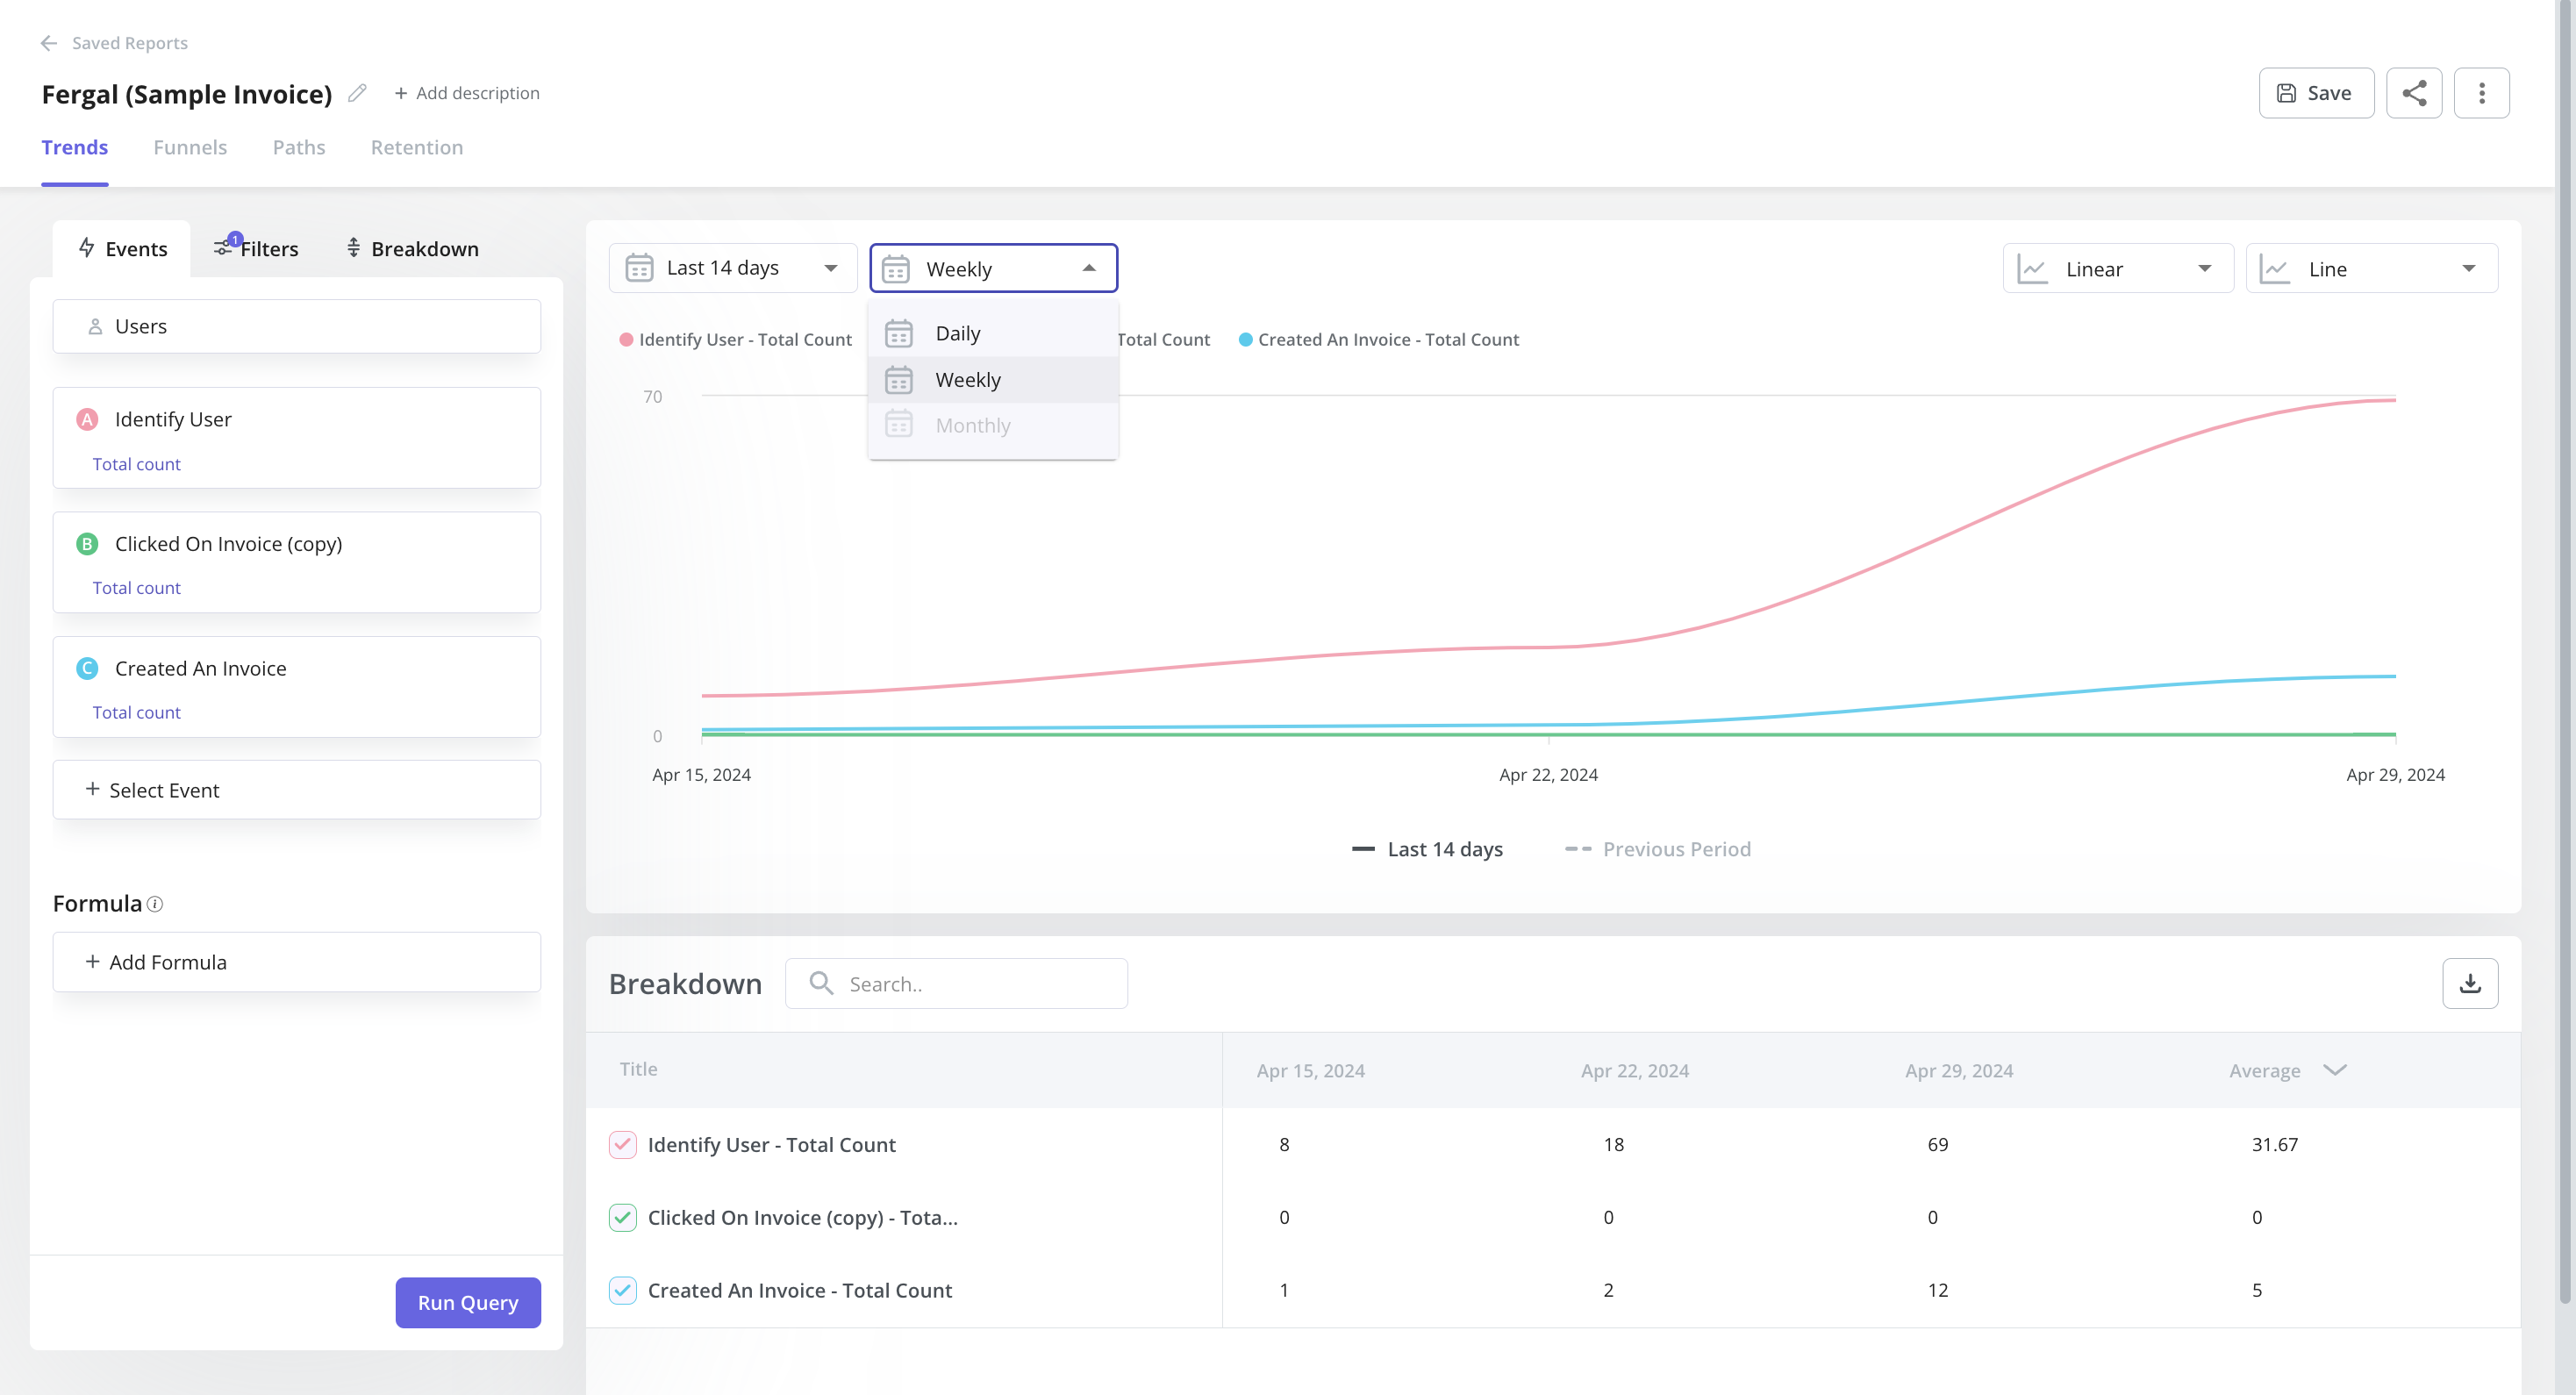 Example of a trend report in Userpilot.
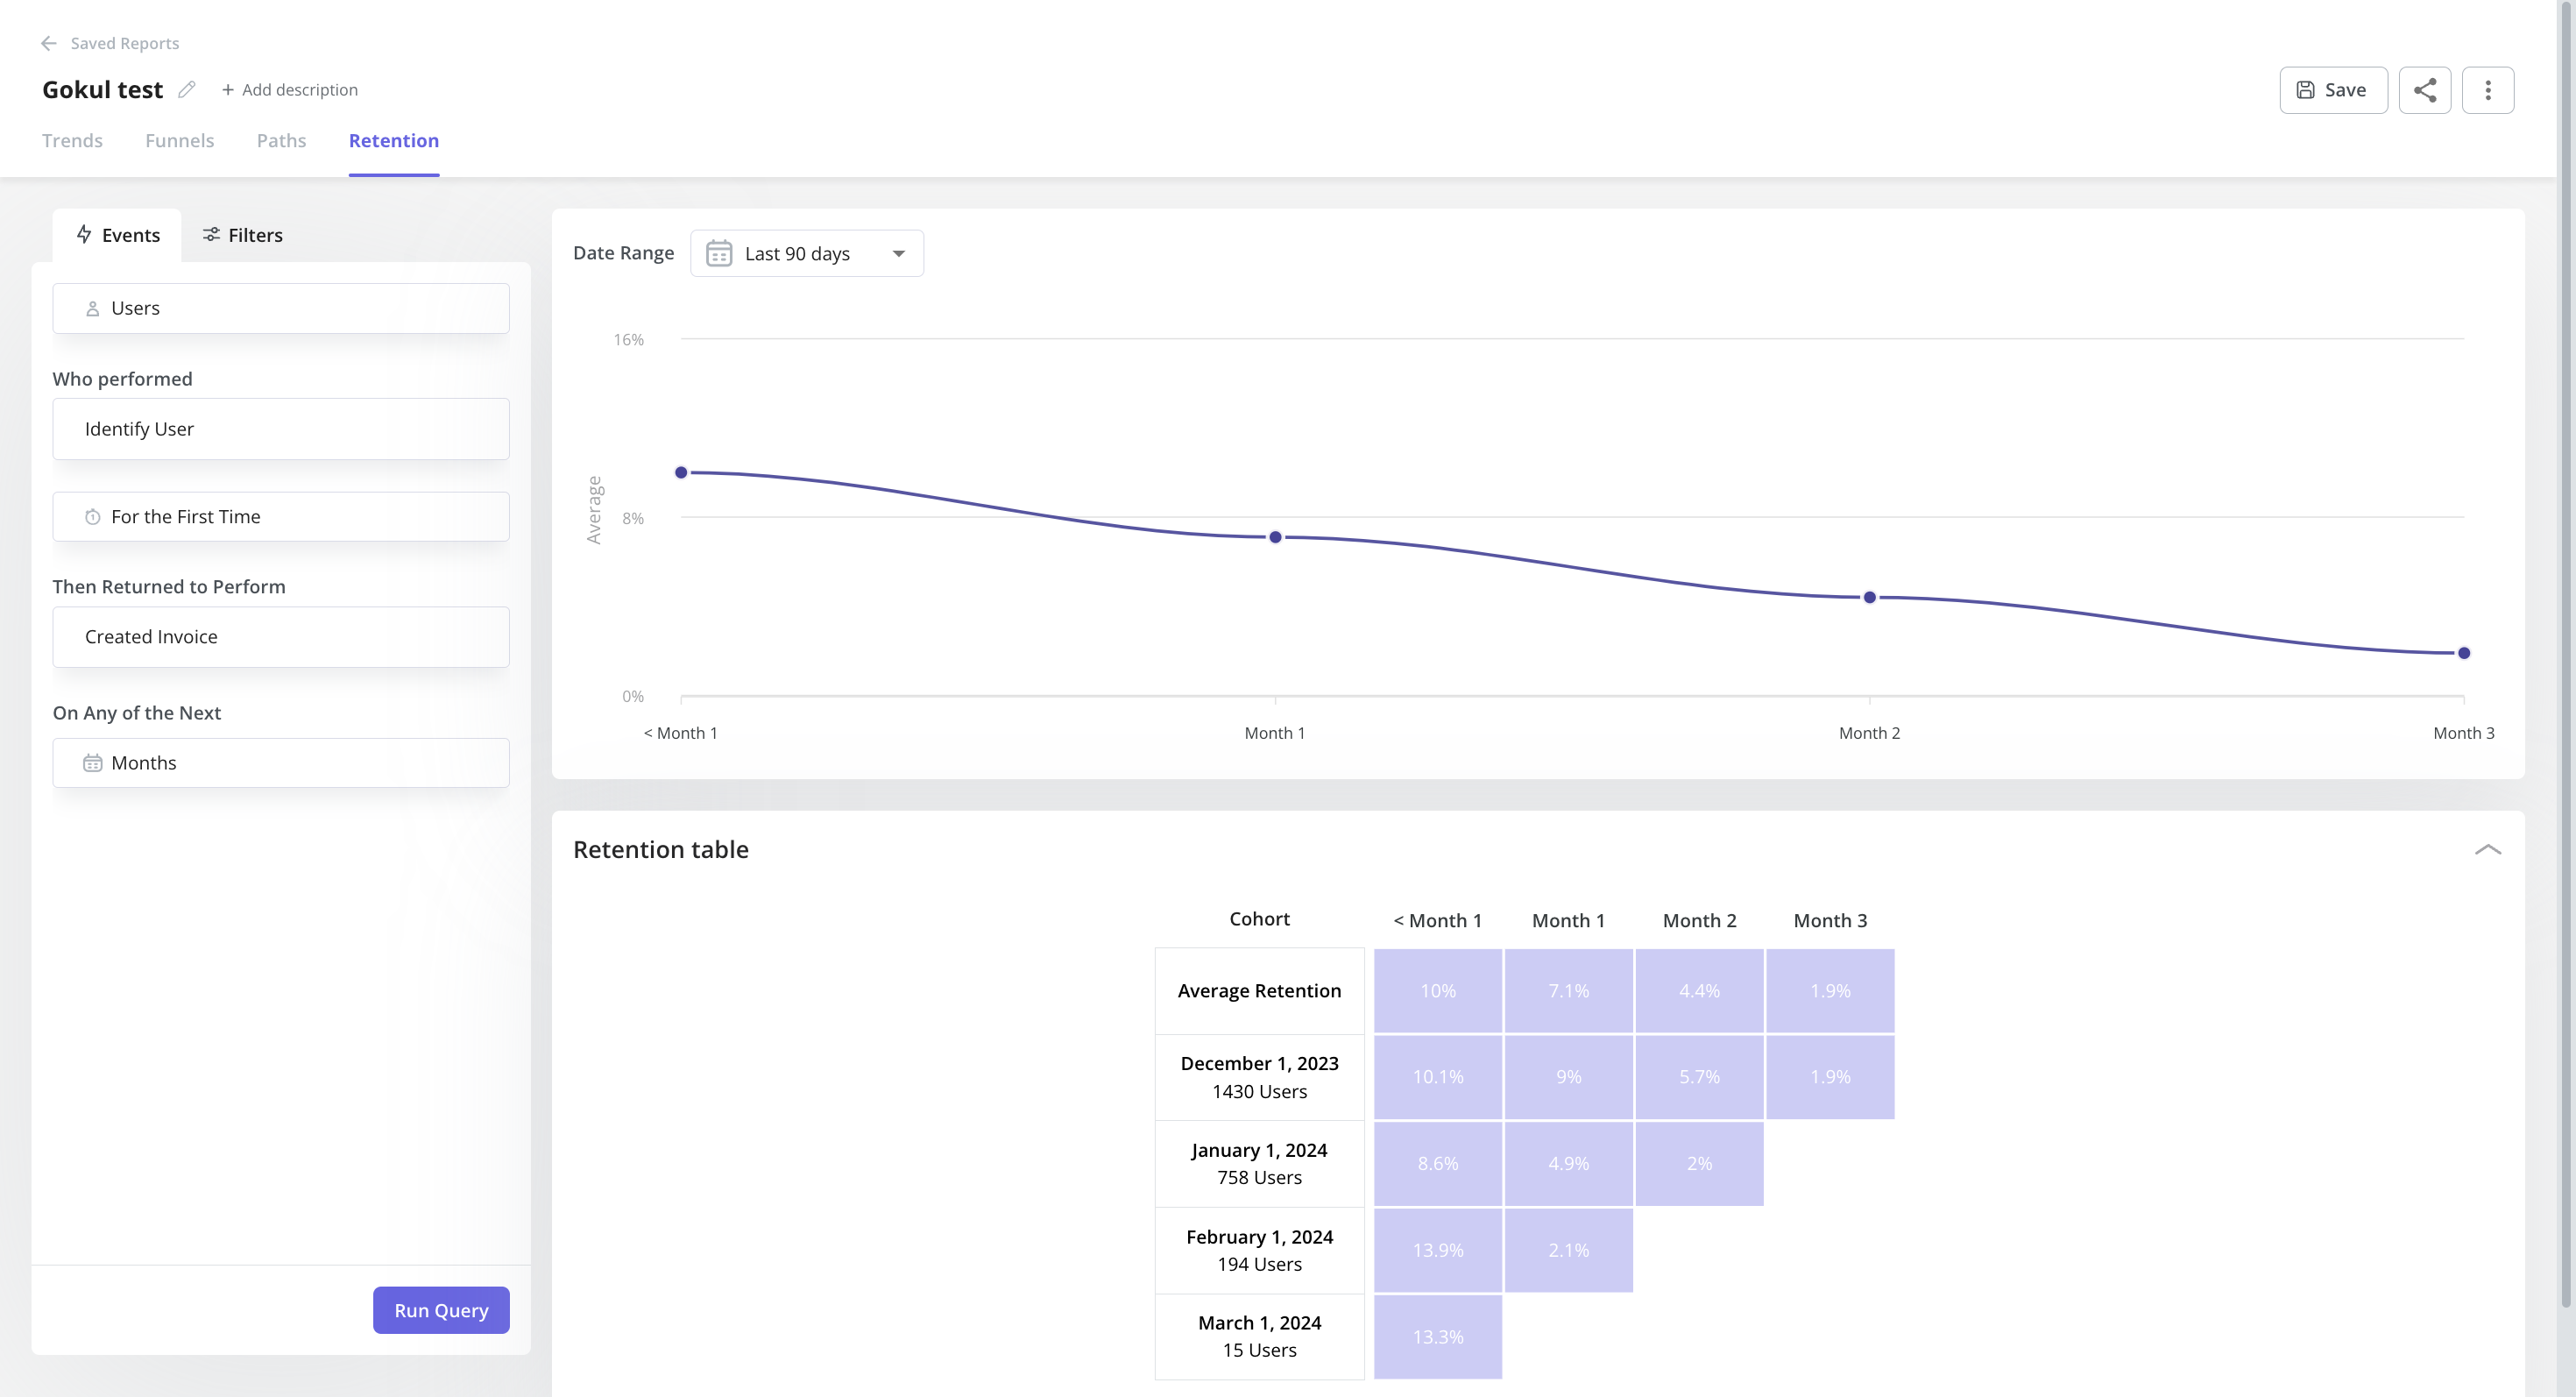
 - Retention tables: This lets you gauge product performance – how effective it is at retaining users using cohort tables and retention curves.
- Paths: You can generate and access path reports directly within the reporting builder in Userpilot, alongside funnels, trends, and retention reports. With Paths, you can have an overview of how users navigate your product features – offering invaluable insights into their interactions with your products.

- User & Company profiles: Here you can view data related to a certain user/company to gain insights into their behavior and improve the overall user tracking experience. This helps you understand how they engage with your product or platform, better identification of areas of improvement, and tailor their offerings more effectively.
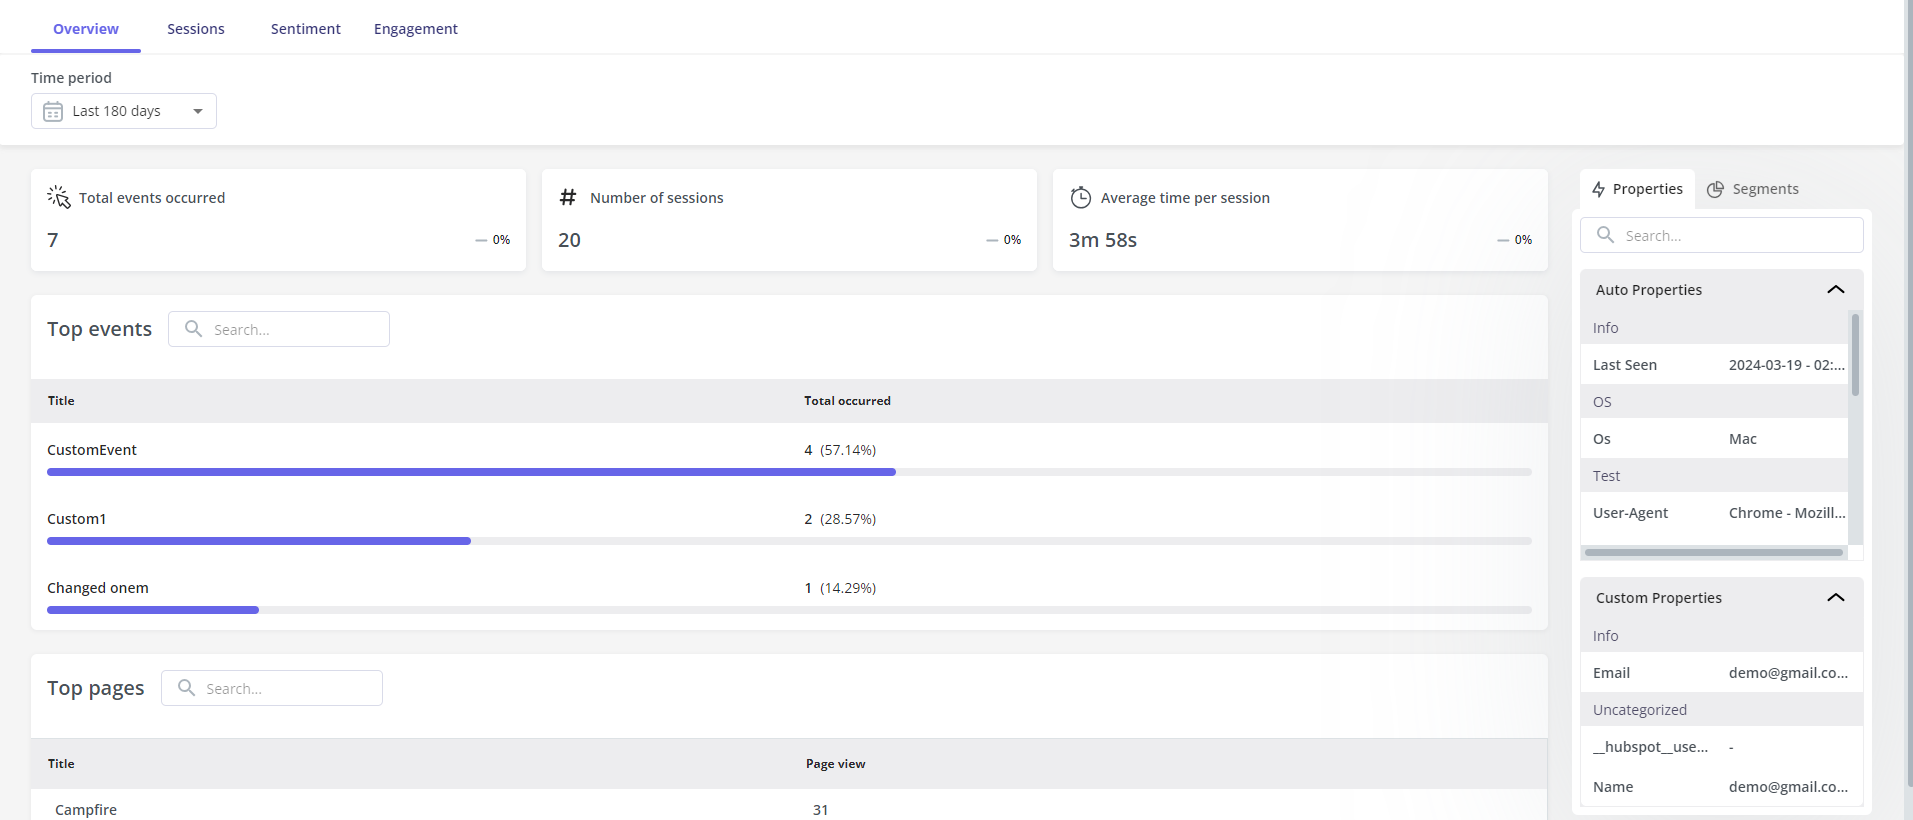 User profile with top event data that provides insights into what feature they regularly engage with.
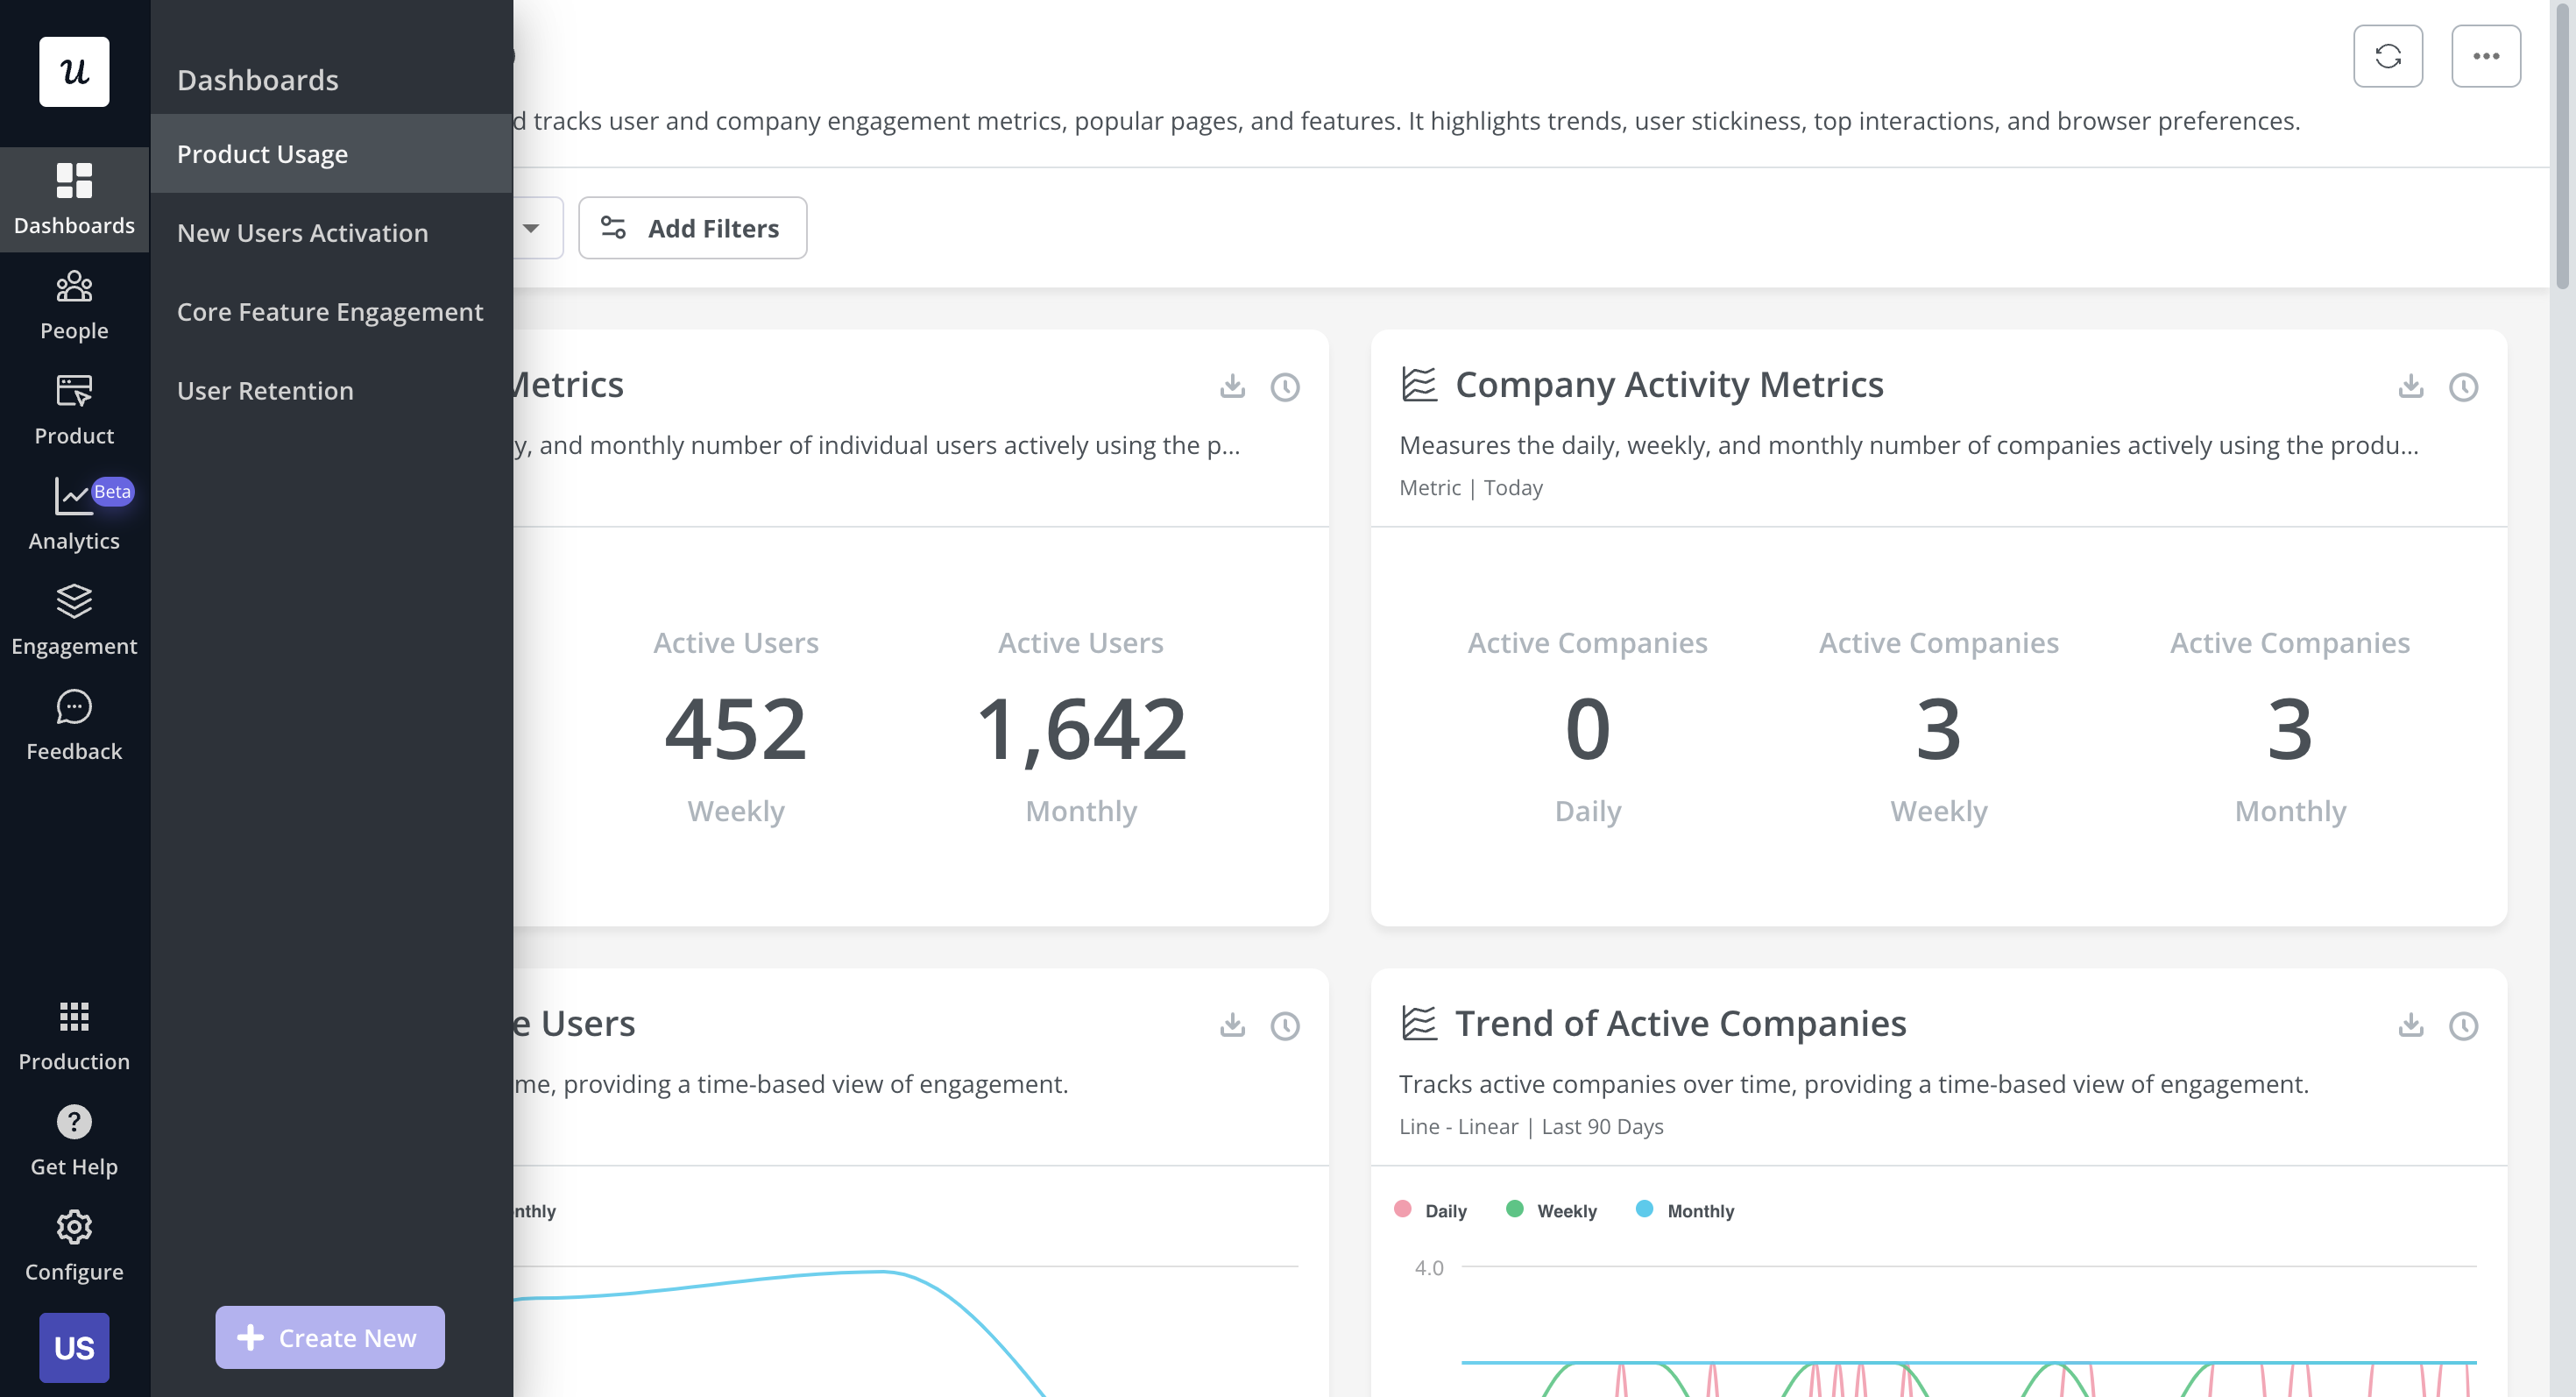
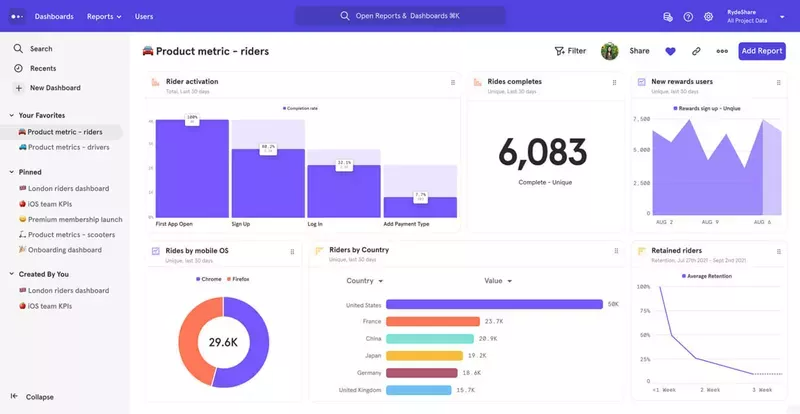
 - Analytics dashboards (Product Usage, New Users Activation, Core Feature Engagement, User Retention, etc.): These dashboards enable you to keep track of your key product performance and user behavior metrics at a glance, without any technical setup required.
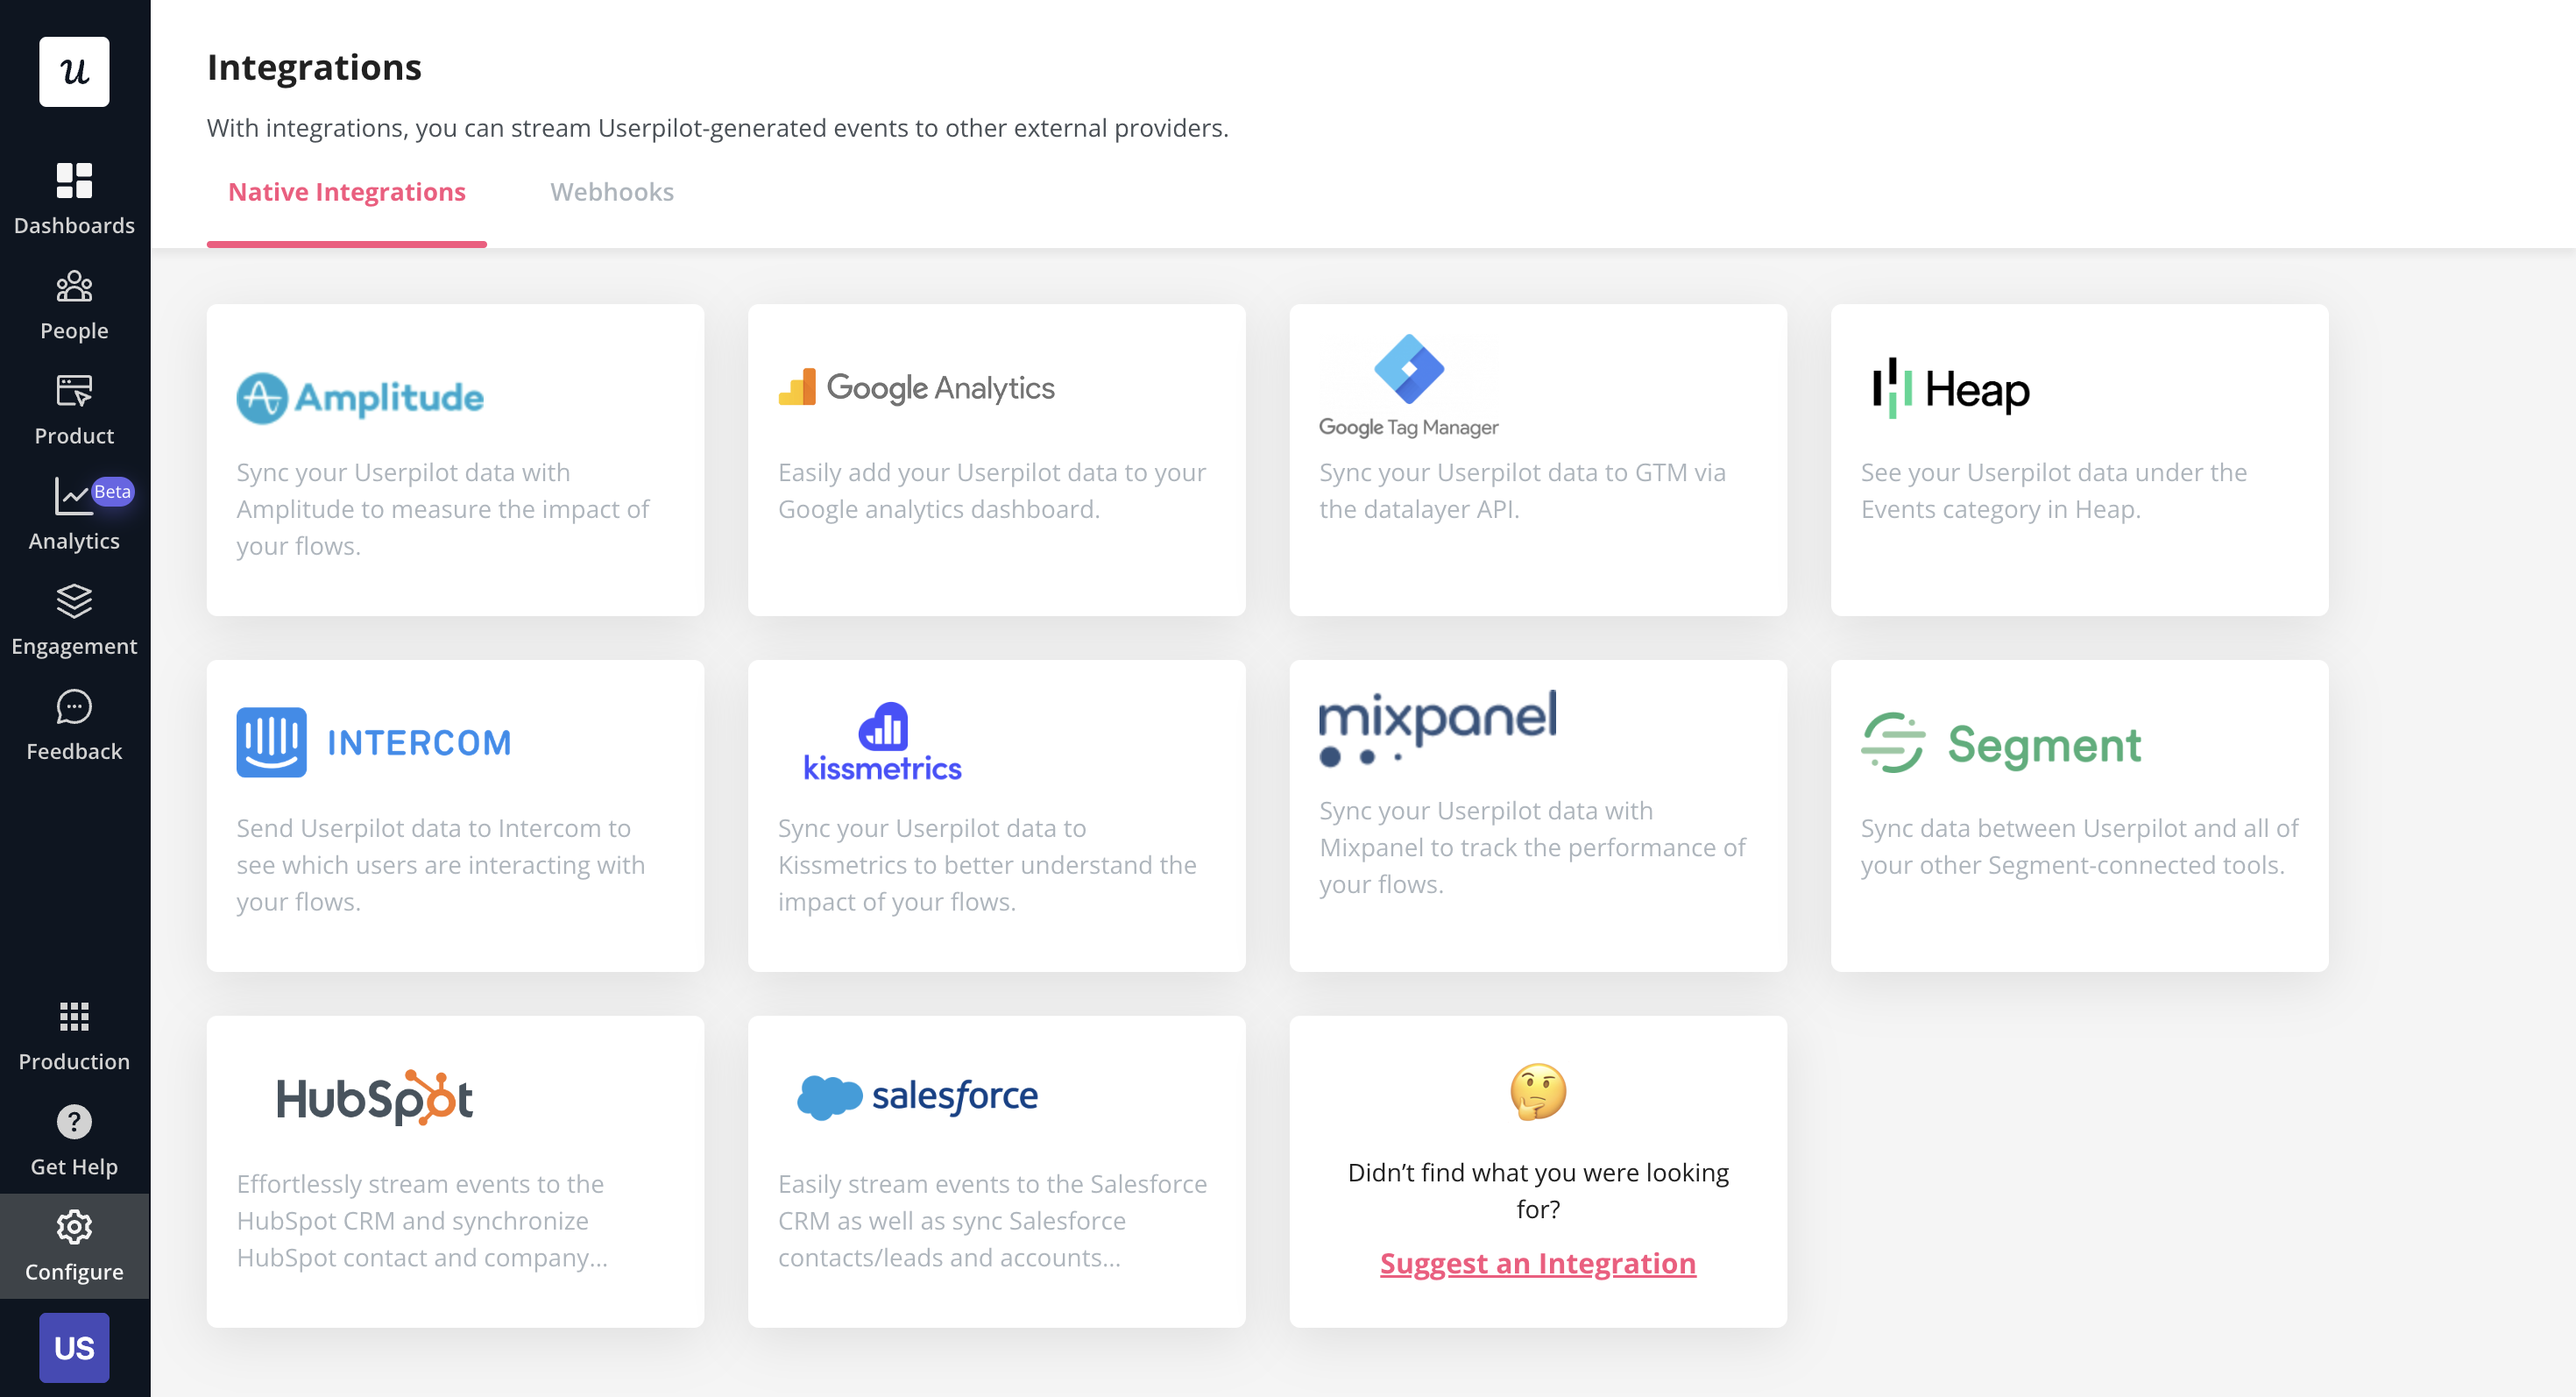
- Analytics integrations: Userpilot integrates with some of the most popular analytics tools like Amplitude, Mixpanel, Segment, Google Analytics, and more. This makes it possible to sync product analytics both ways between the tools in your tech stack (two-way integration is only available for Hubspot at the time of writing, more to come).
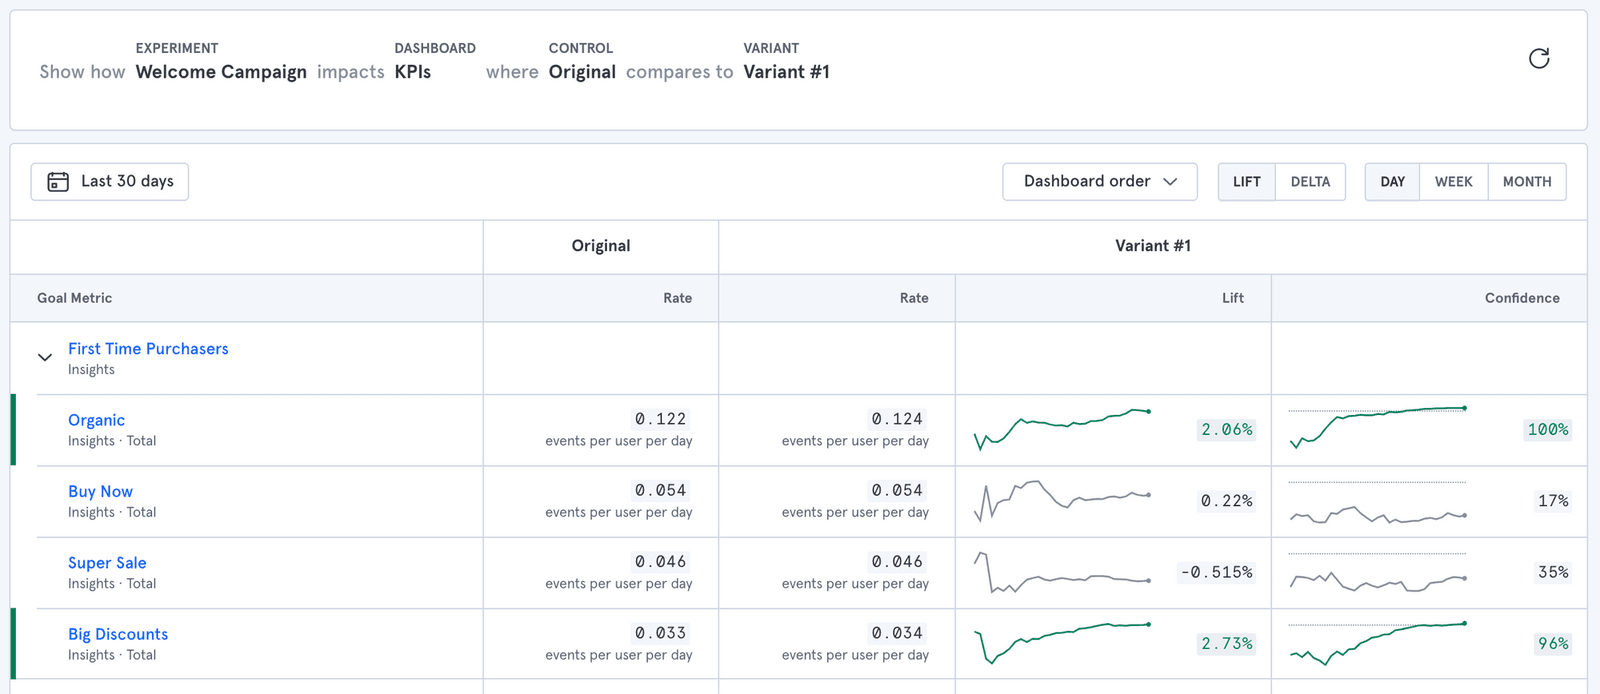
Userpilot for A/B testing
A/B testing is a crucial step in optimizing your flows and identifying the changes that provide the best response from your users. Userpilot’s native split-testing features let you confine experiments to a single page, track the downstream impact on goals, and customize any settings along the way.
Here are the Userpilot’s A/B testing features you can use to build experiments and analyze results:
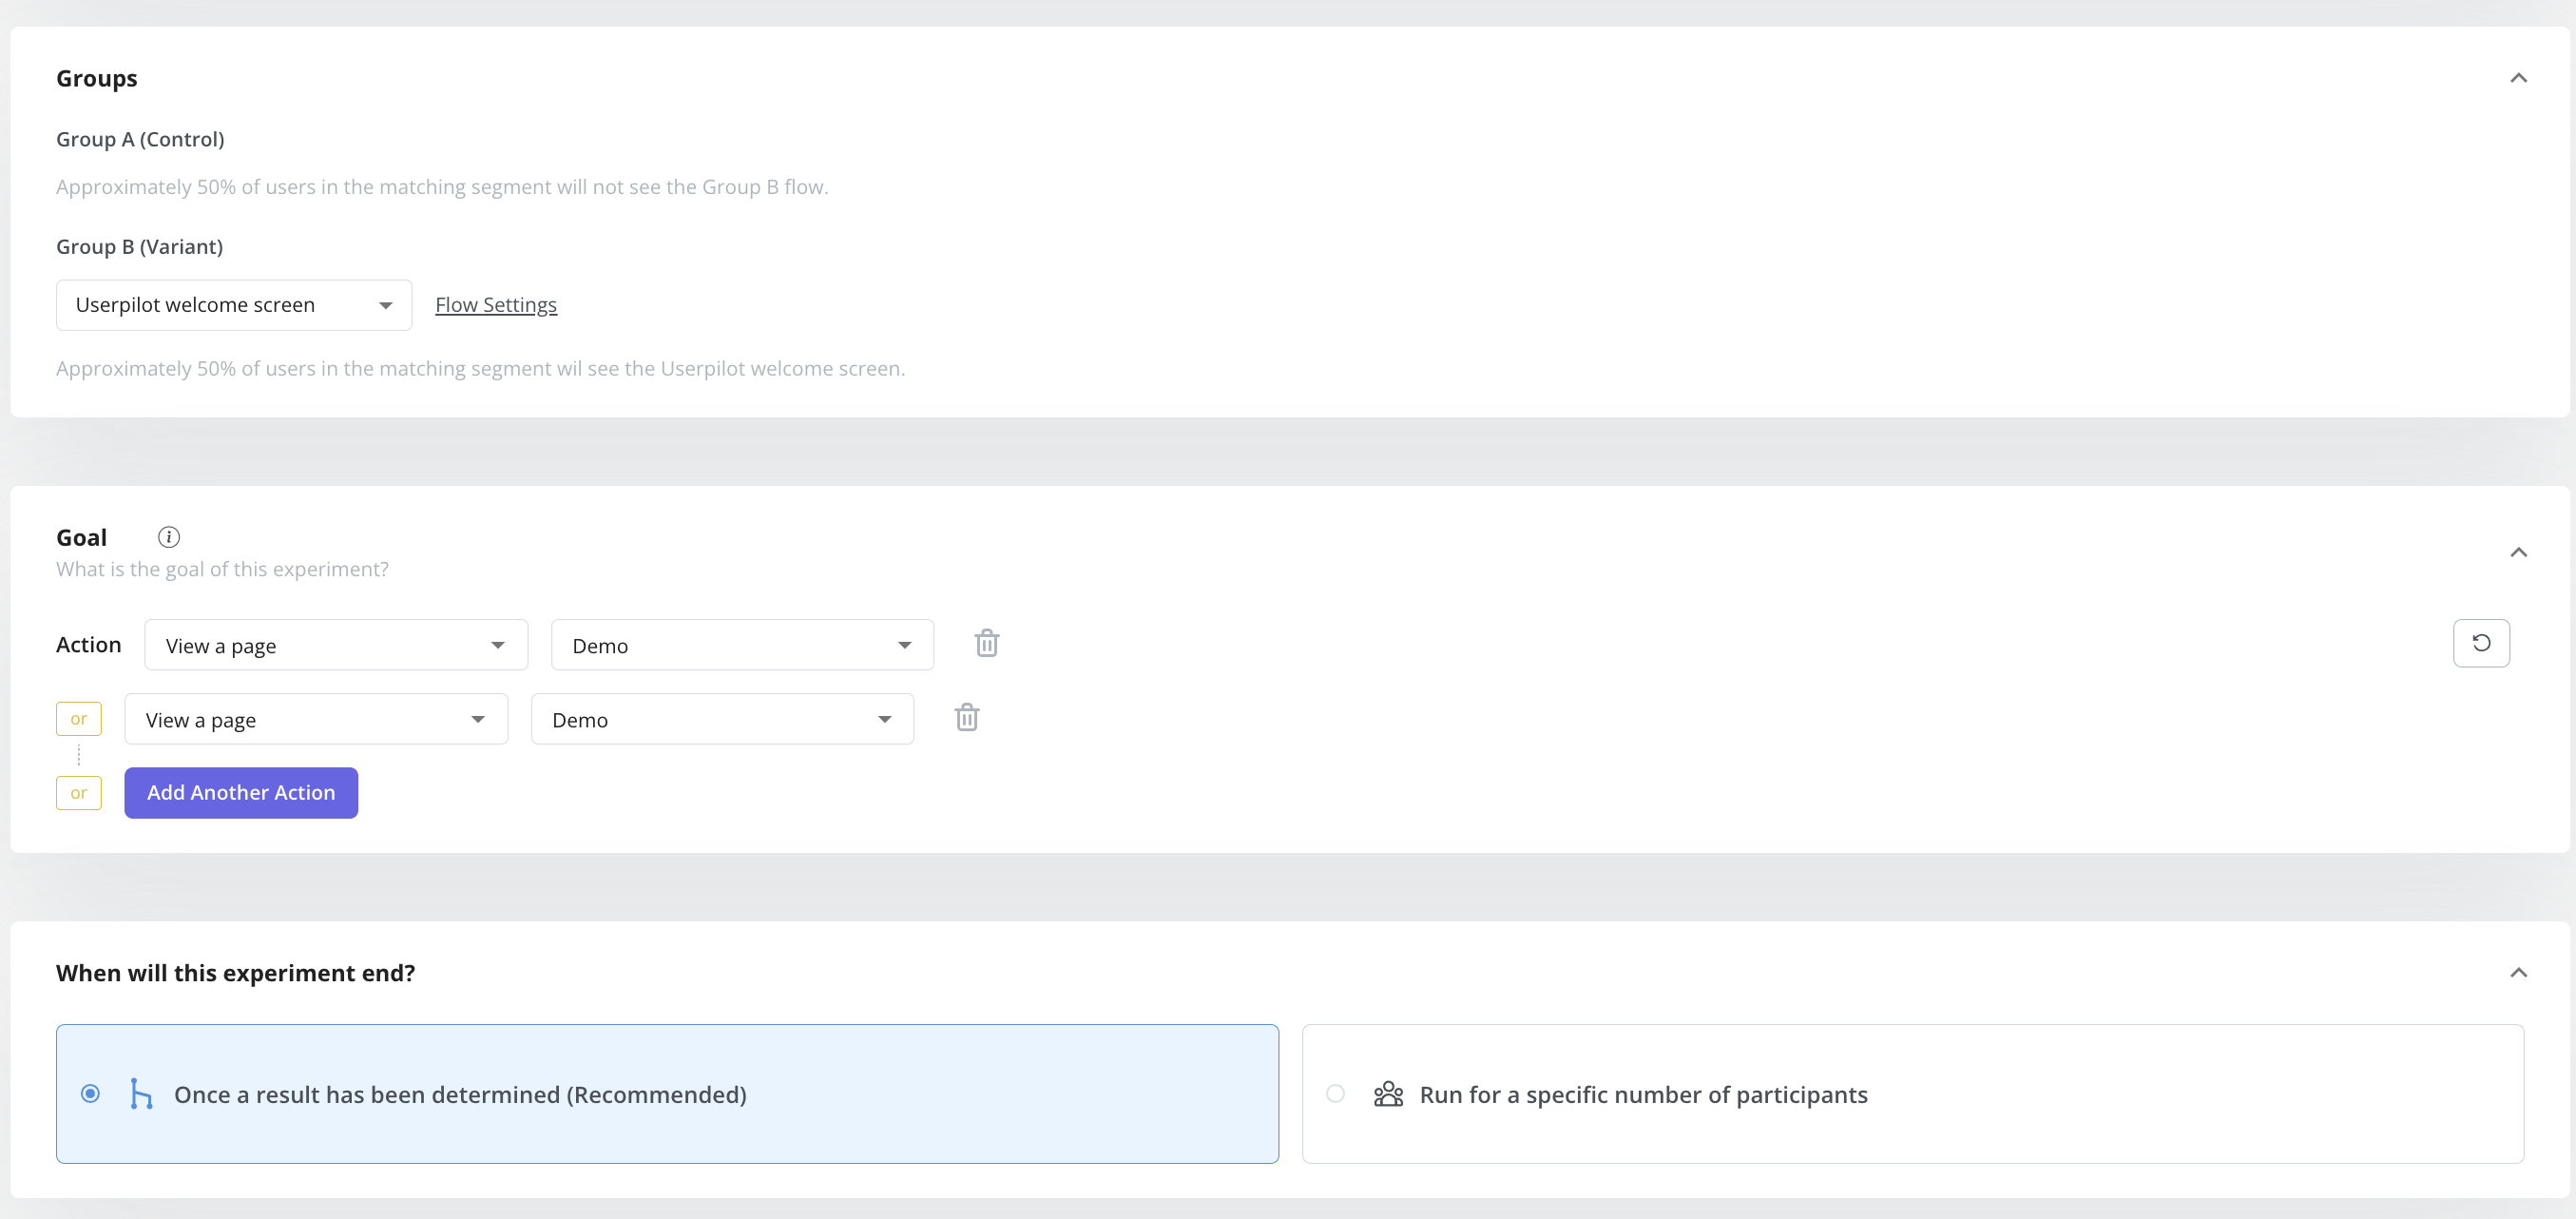
- Page Targeting: The page targeting settings let you specify the domain and page that a particular A/B test should be triggered on. You can also add conditional triggers for experiments that should appear on any page where the criteria are met.
- Different types of experiments: You can run the classic A/B test using a control group, a multivariate test that tests two flows against each other for the same audience, or an advanced experiment in which you can set the conditions.
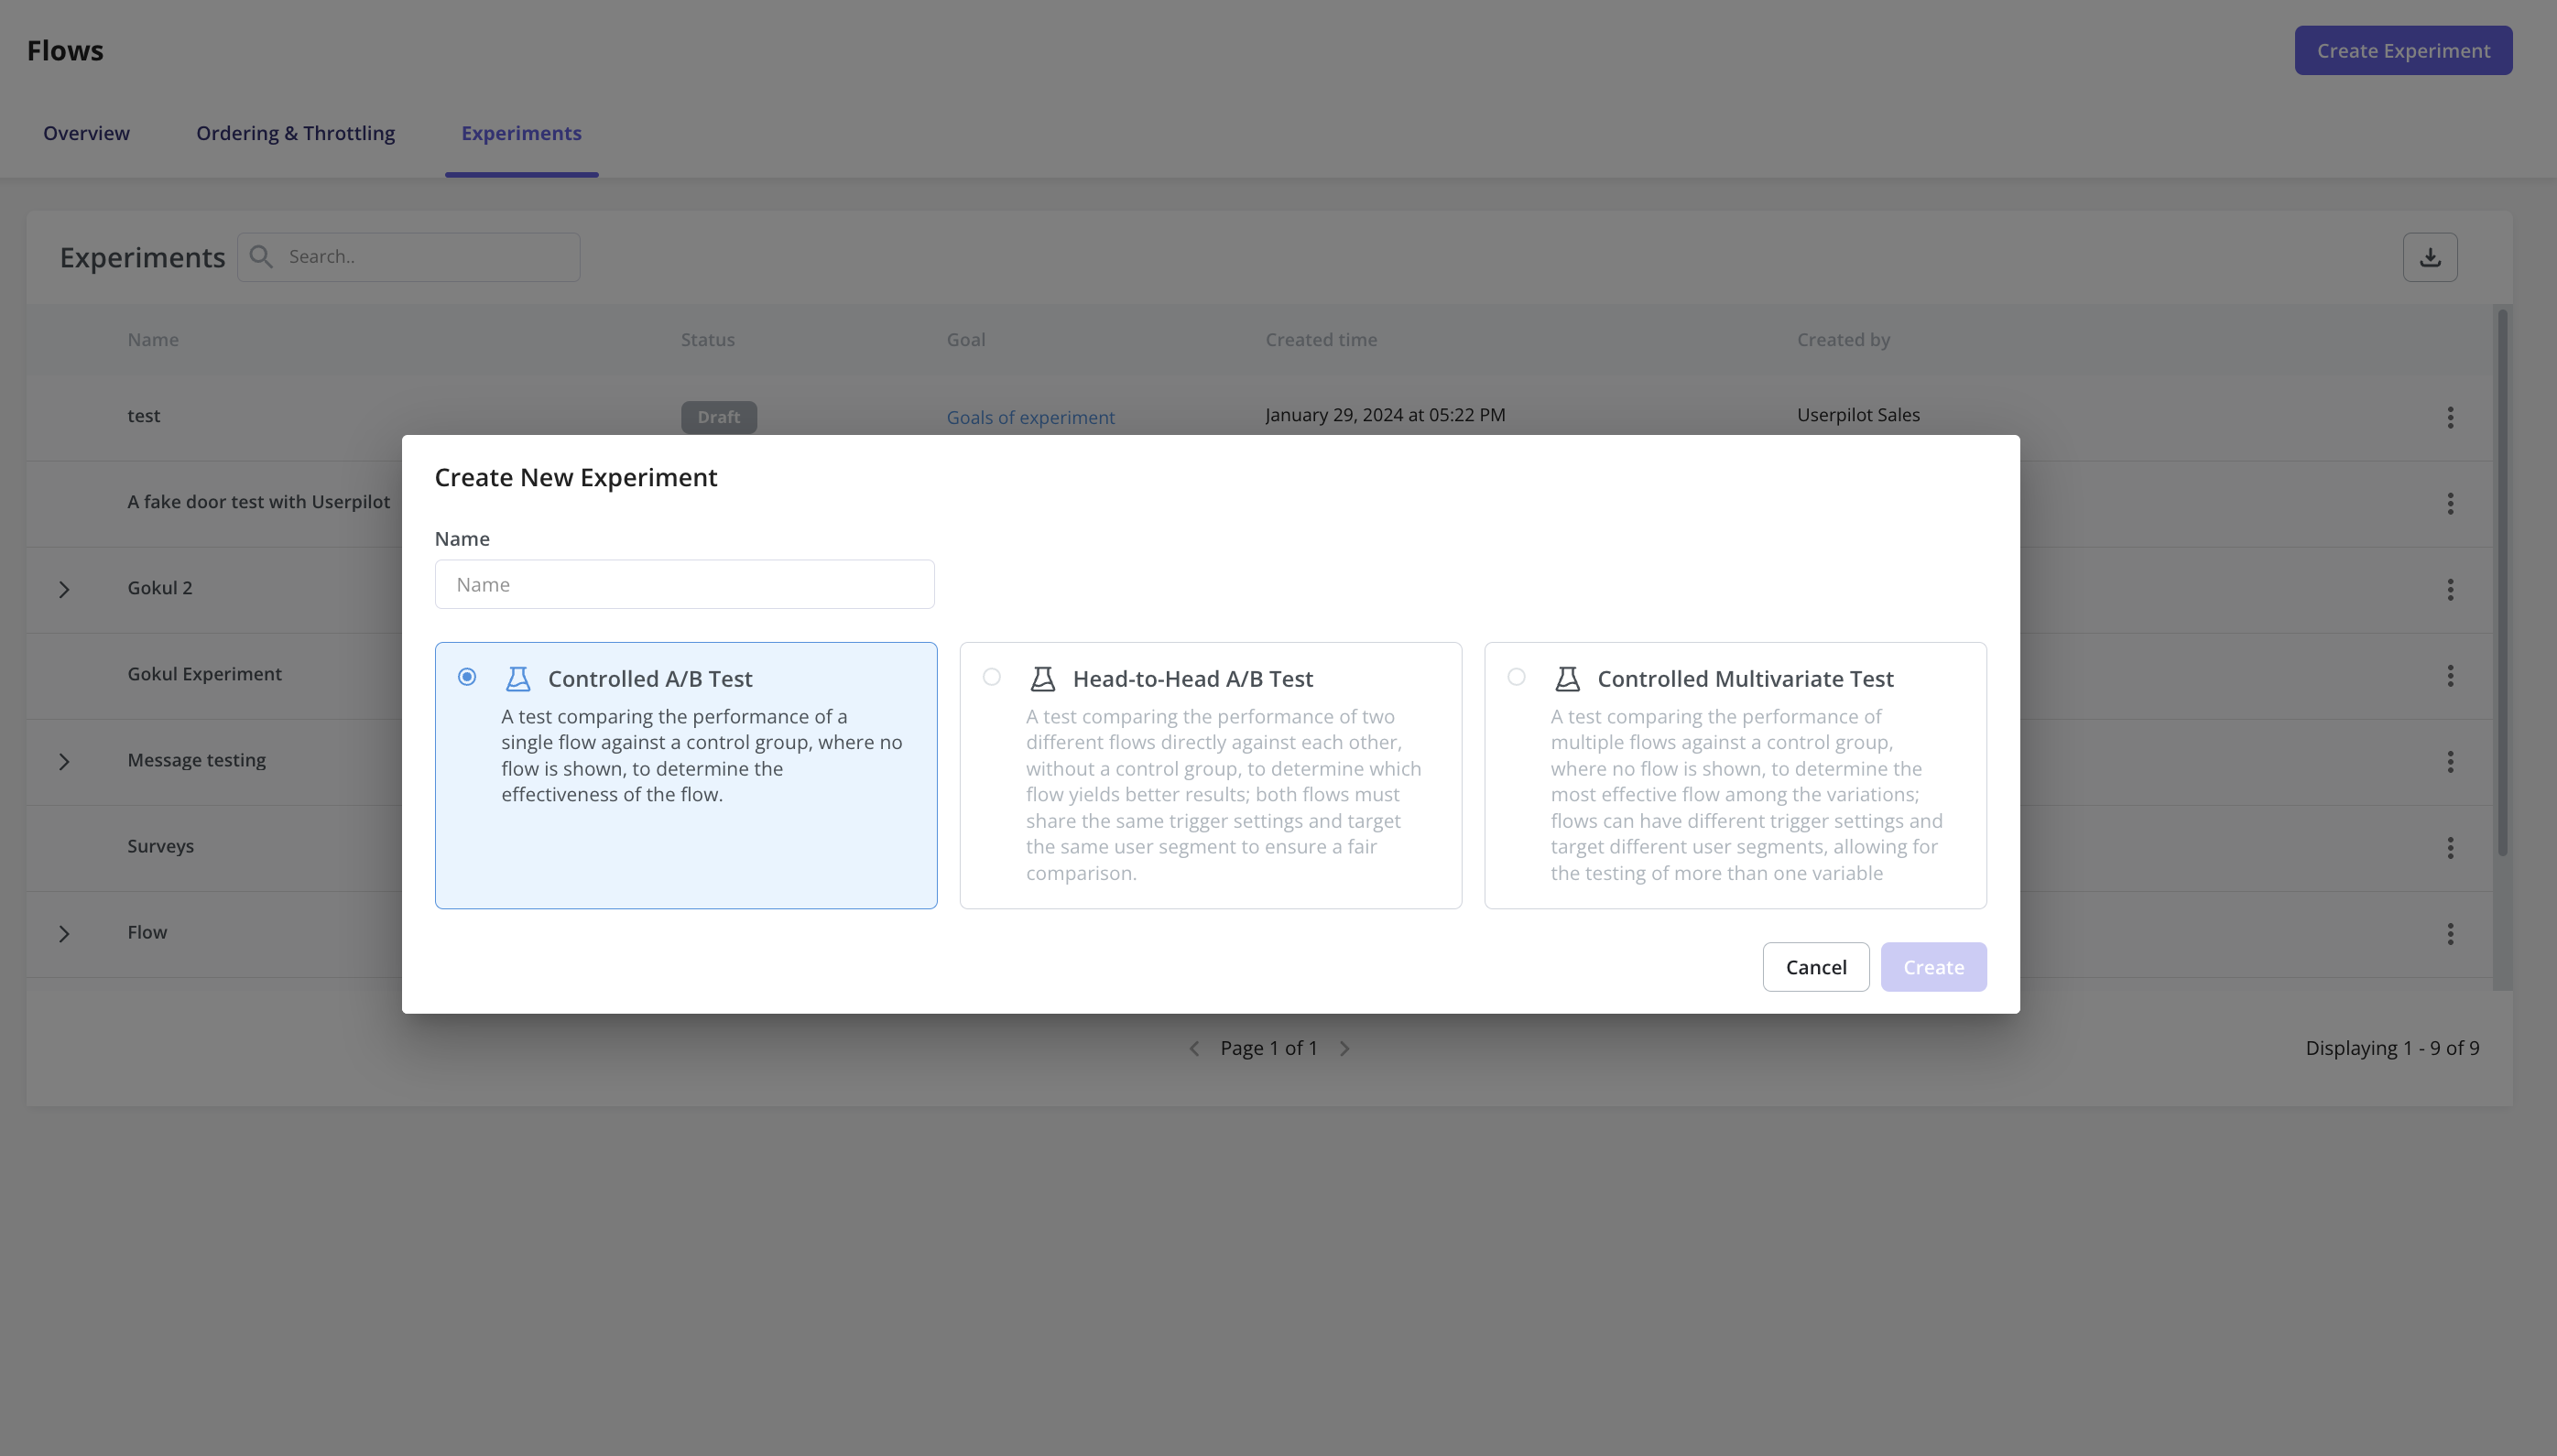
- Experiment goal: Track if the experiment was a success you can also connect it to an action goal to track impact.
- Experiment Settings: Userpilot lets you customize experiment settings to target specific audiences, adjust frequency, and decide when the experiment should be concluded. For instance, you could set a fixed number of days or continue the experiment until it gets results.
Userpilot for behavioral analytics
Behavioral analytics make it possible to monitor user activity, group data into cohorts, and extract relevant metrics/insights. Userpilot lets you tag features to see how users interact with them, compare goals by cohort, and create trend reports that track behavioral patterns over time.
Here are some Userpilot features you can use for user behavior tracking:
- No-Code Feature Tagging: Userpilot’s click-to-track feature tagger lets you mark features, buttons, and elements with the Chrome extension. You’ll be able to track user interactions such as clicks, hovers, or inputs to get an accurate behavioral view for specific features.
- Funnel Reports: Funnel reports show you the total number of users that enter a funnel and the percentage of users that complete each step. This can help you track behavioral paths and see which stages most users get stuck on.
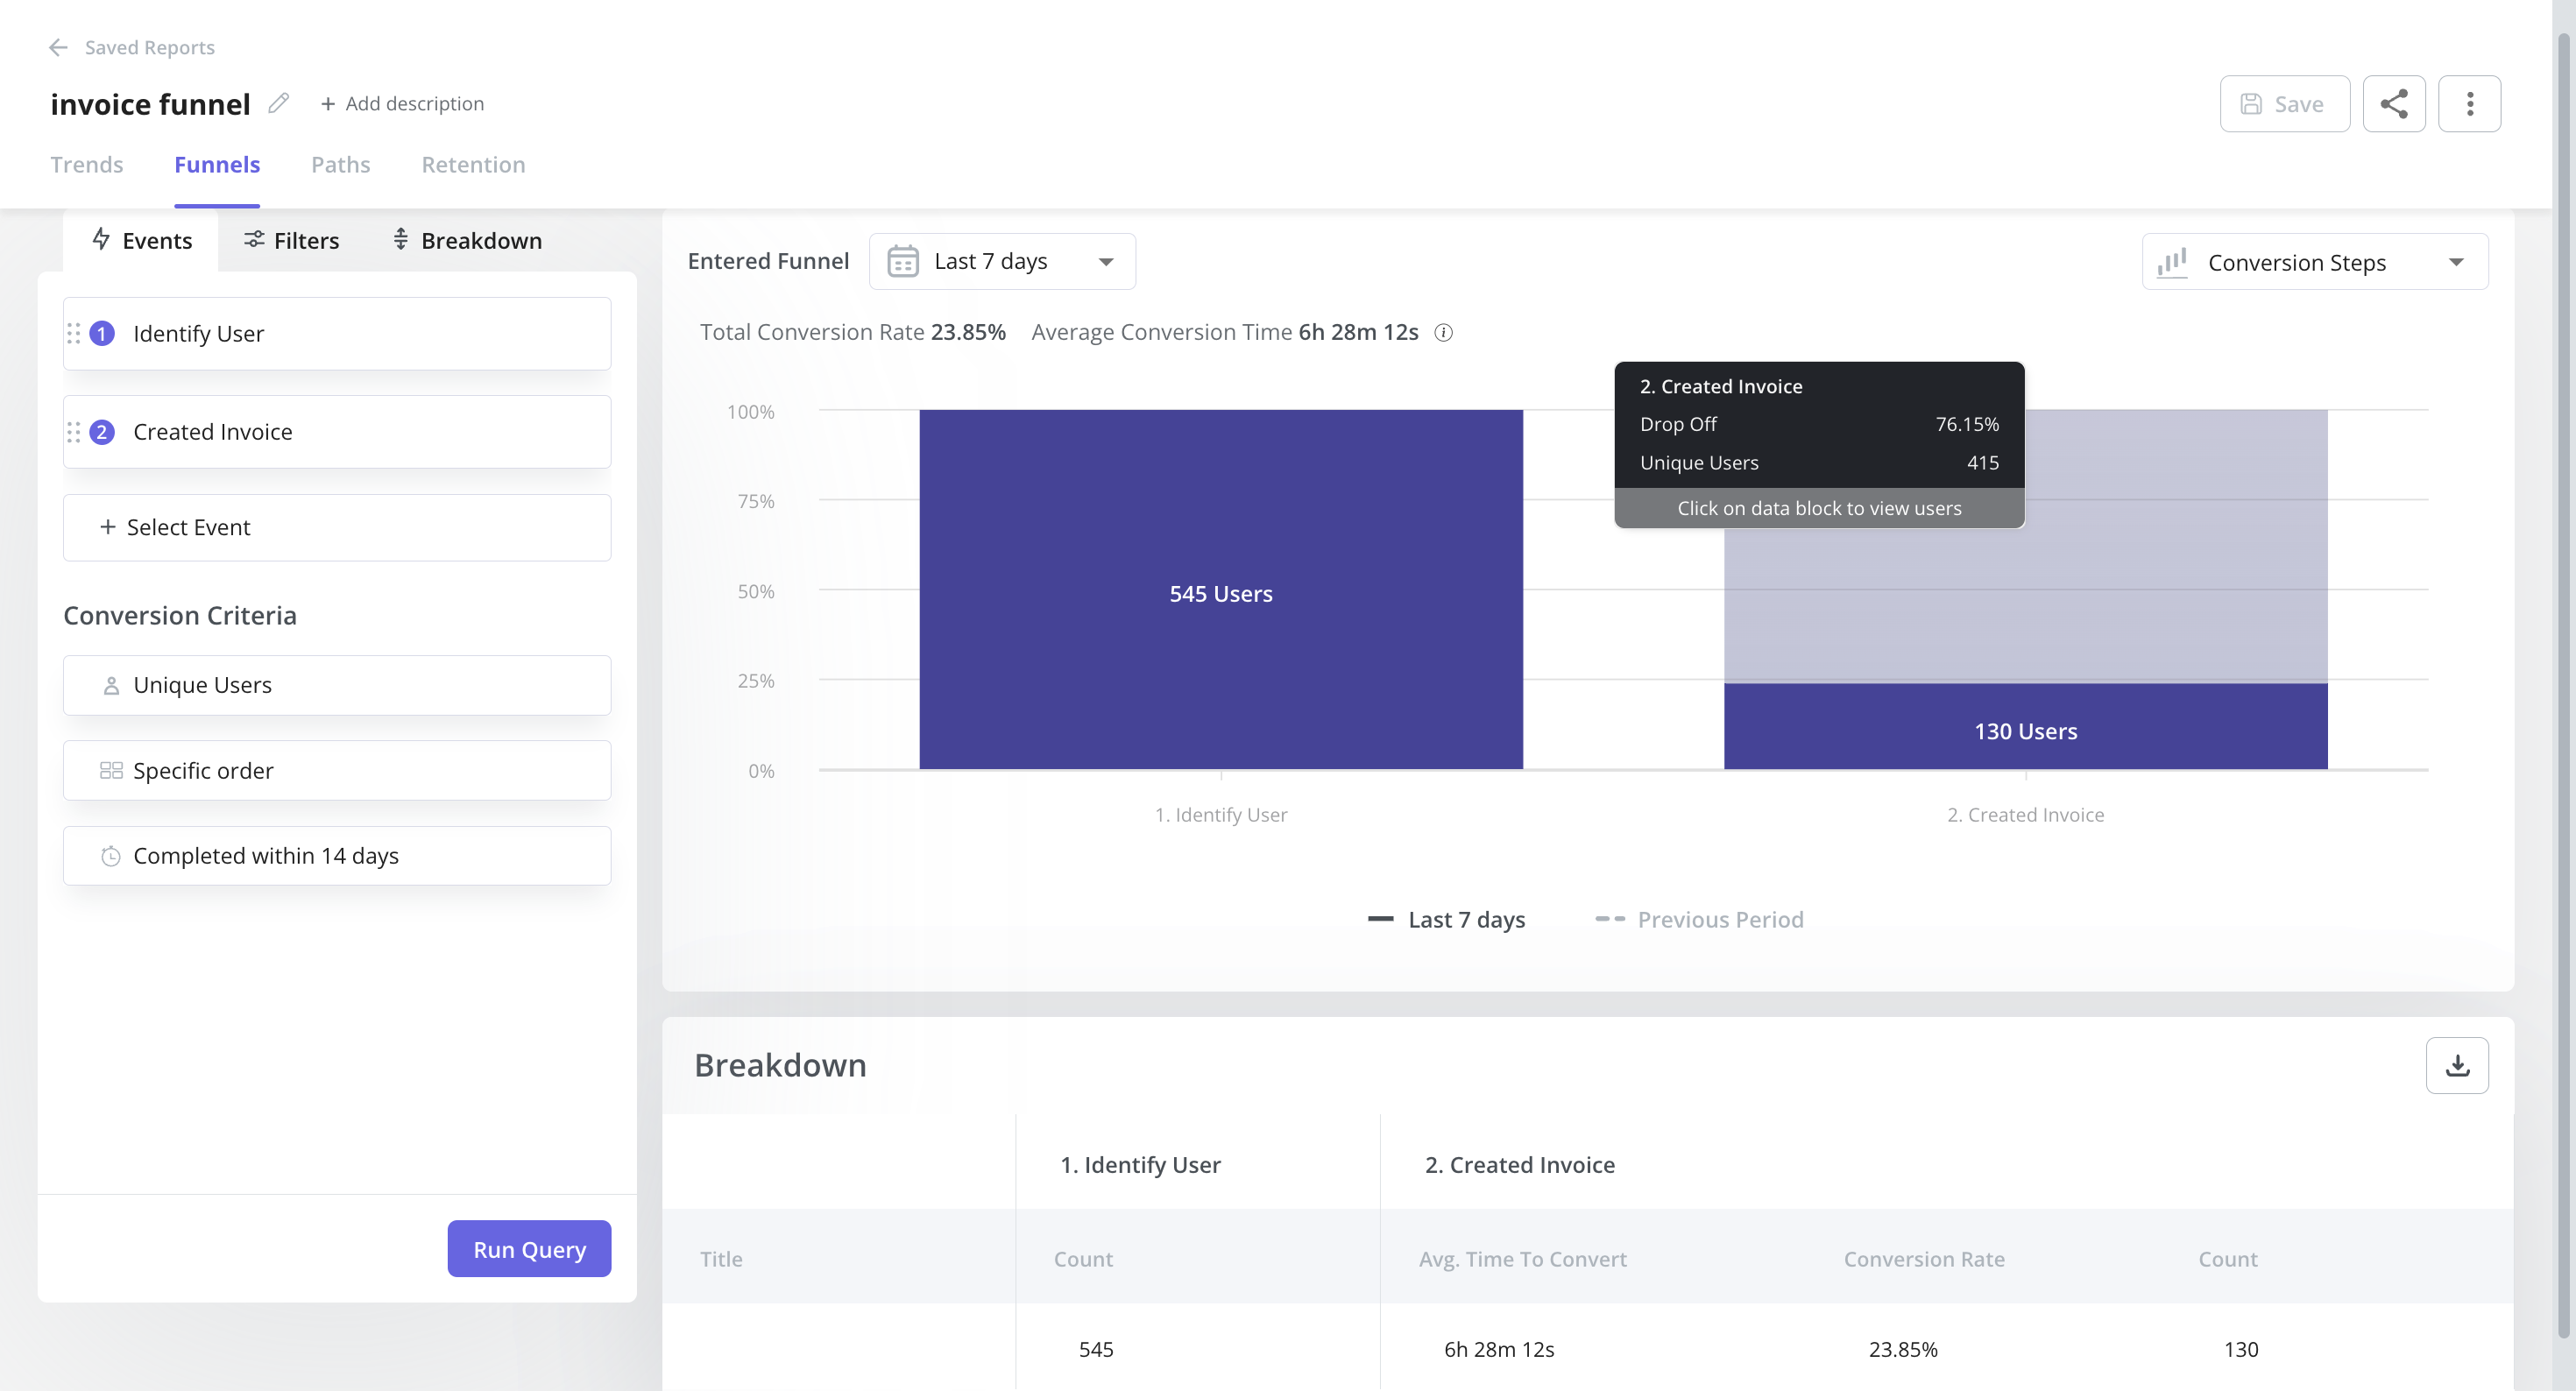
Example of a funnel analysis in Userpilot.
- Trends Reports: Generating trends reports will help you visualize the occurrence of key events over time and break down these analytics by device, browser, operating system, country, signup date, or even individual user IDs and email addresses to see granular behavioral analytics.
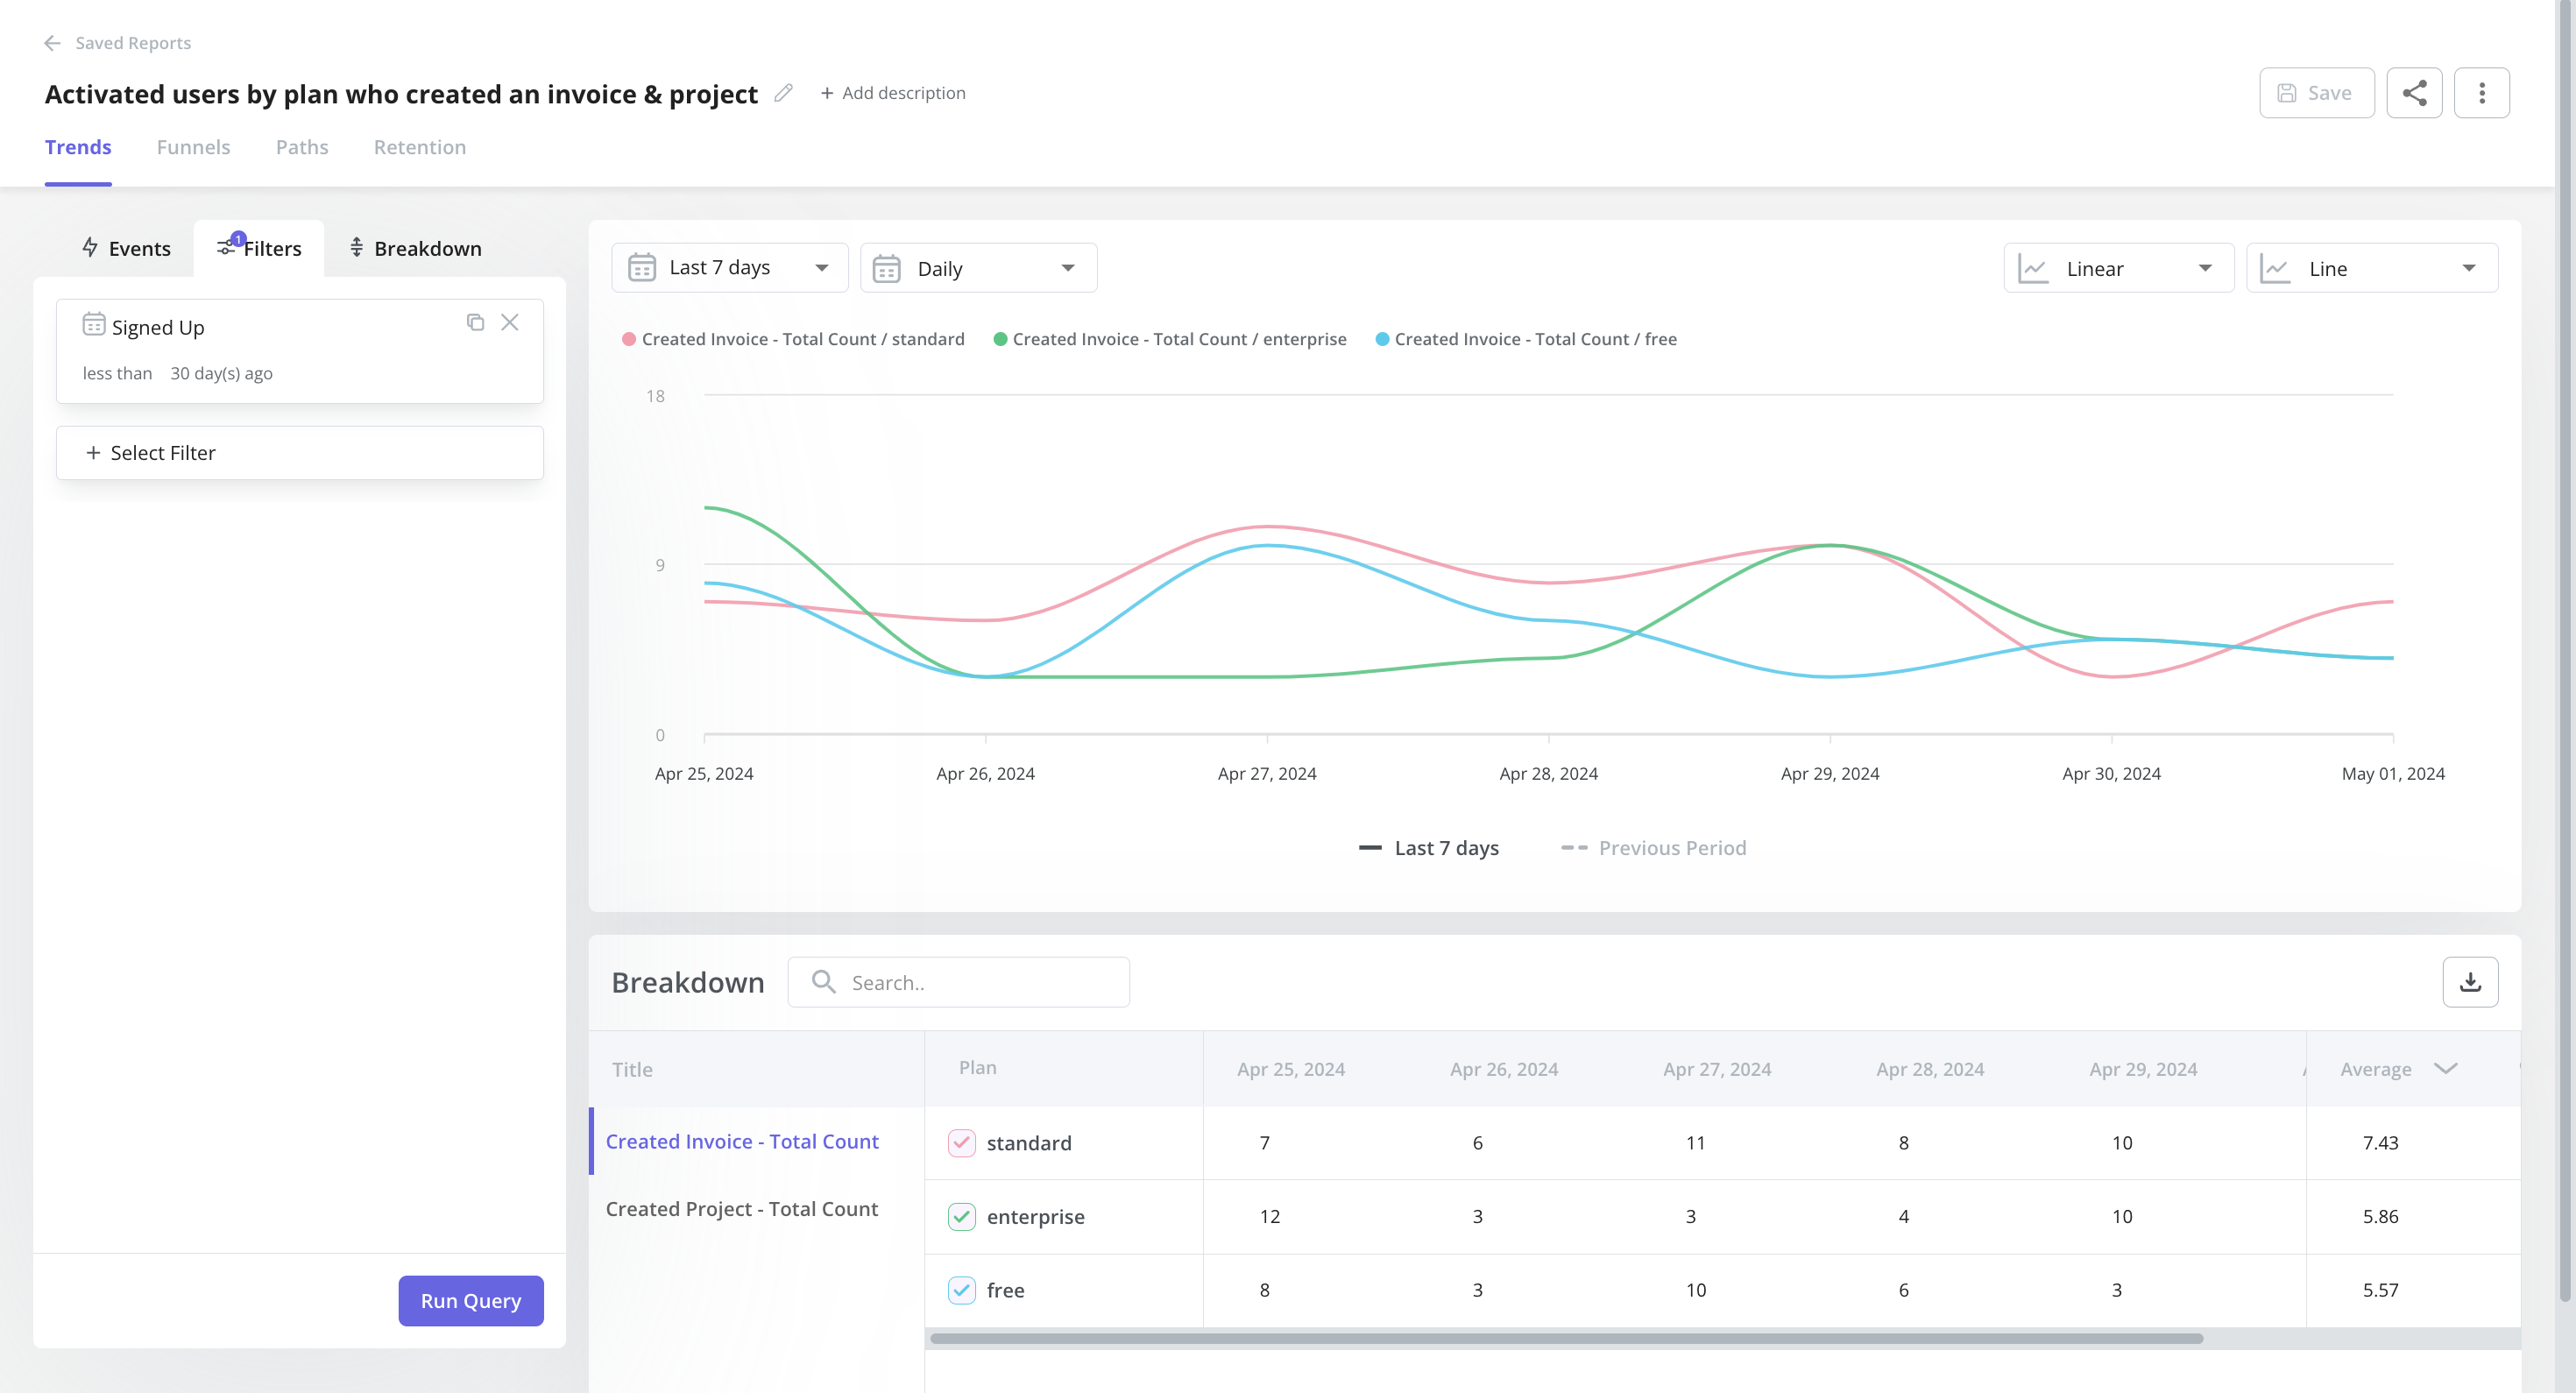
Activation trend report example.
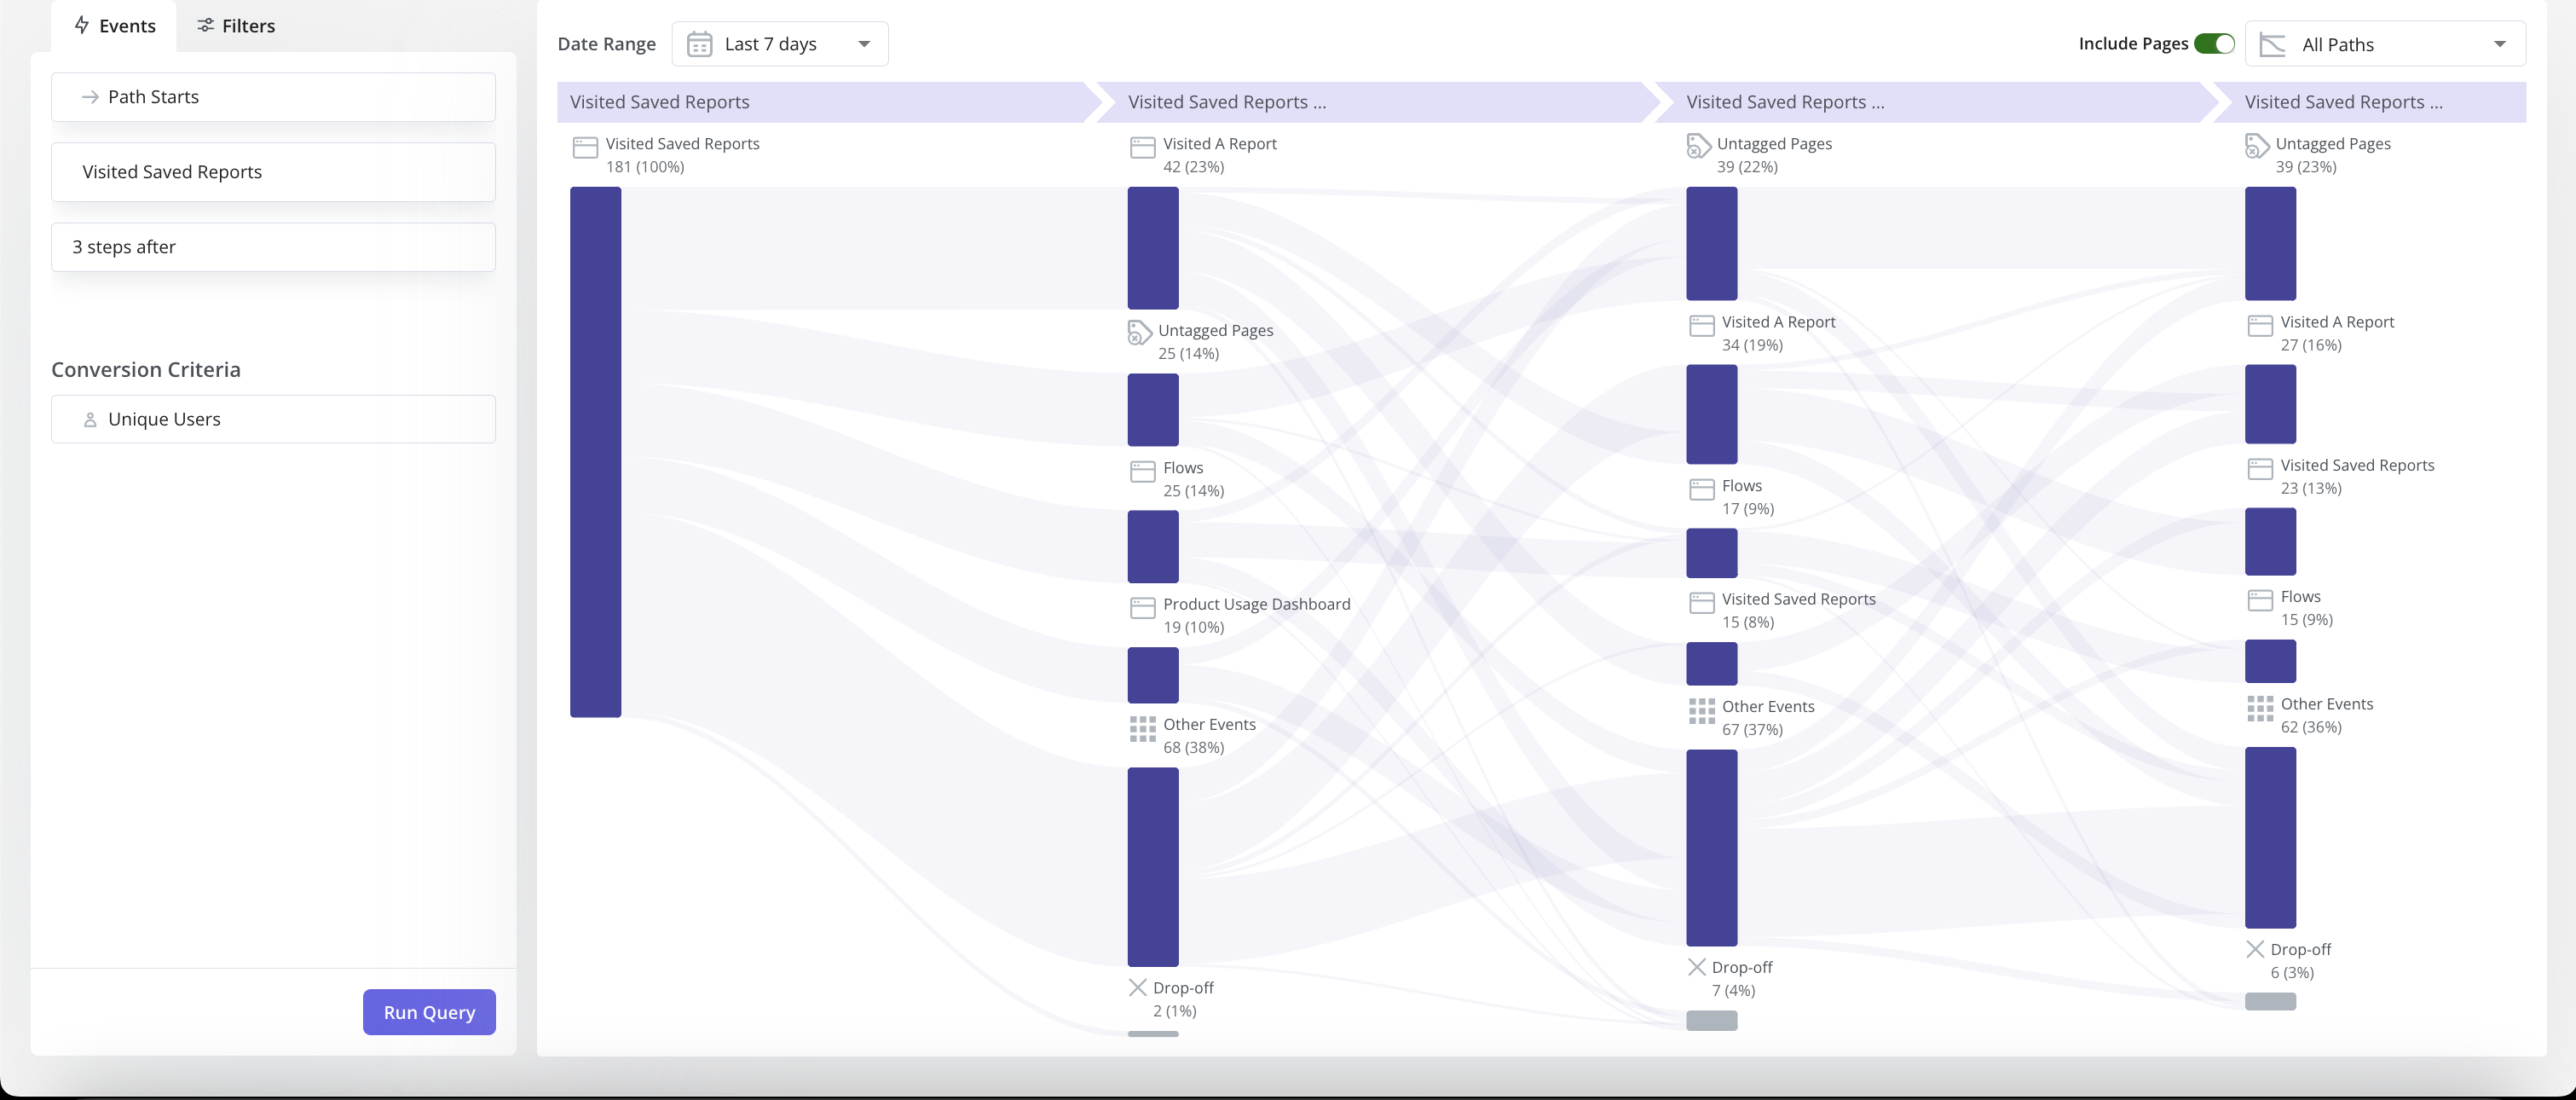
- Path Reports: Path analysis is useful for understanding common user behavior patterns, gauging user interactions with UI, monitoring if users follow recommended workflows, and identifying points of drop-offs and areas for improvement. With collected events, you can easily set up Path analysis in Userpilot without coding.
- Analytics Dashboards: Userpilot also comes with a wide range of dashboards to help you track all the core product metrics i.e. product engagement, activation, retention, etc. – these play as signals for customer behavior changes.
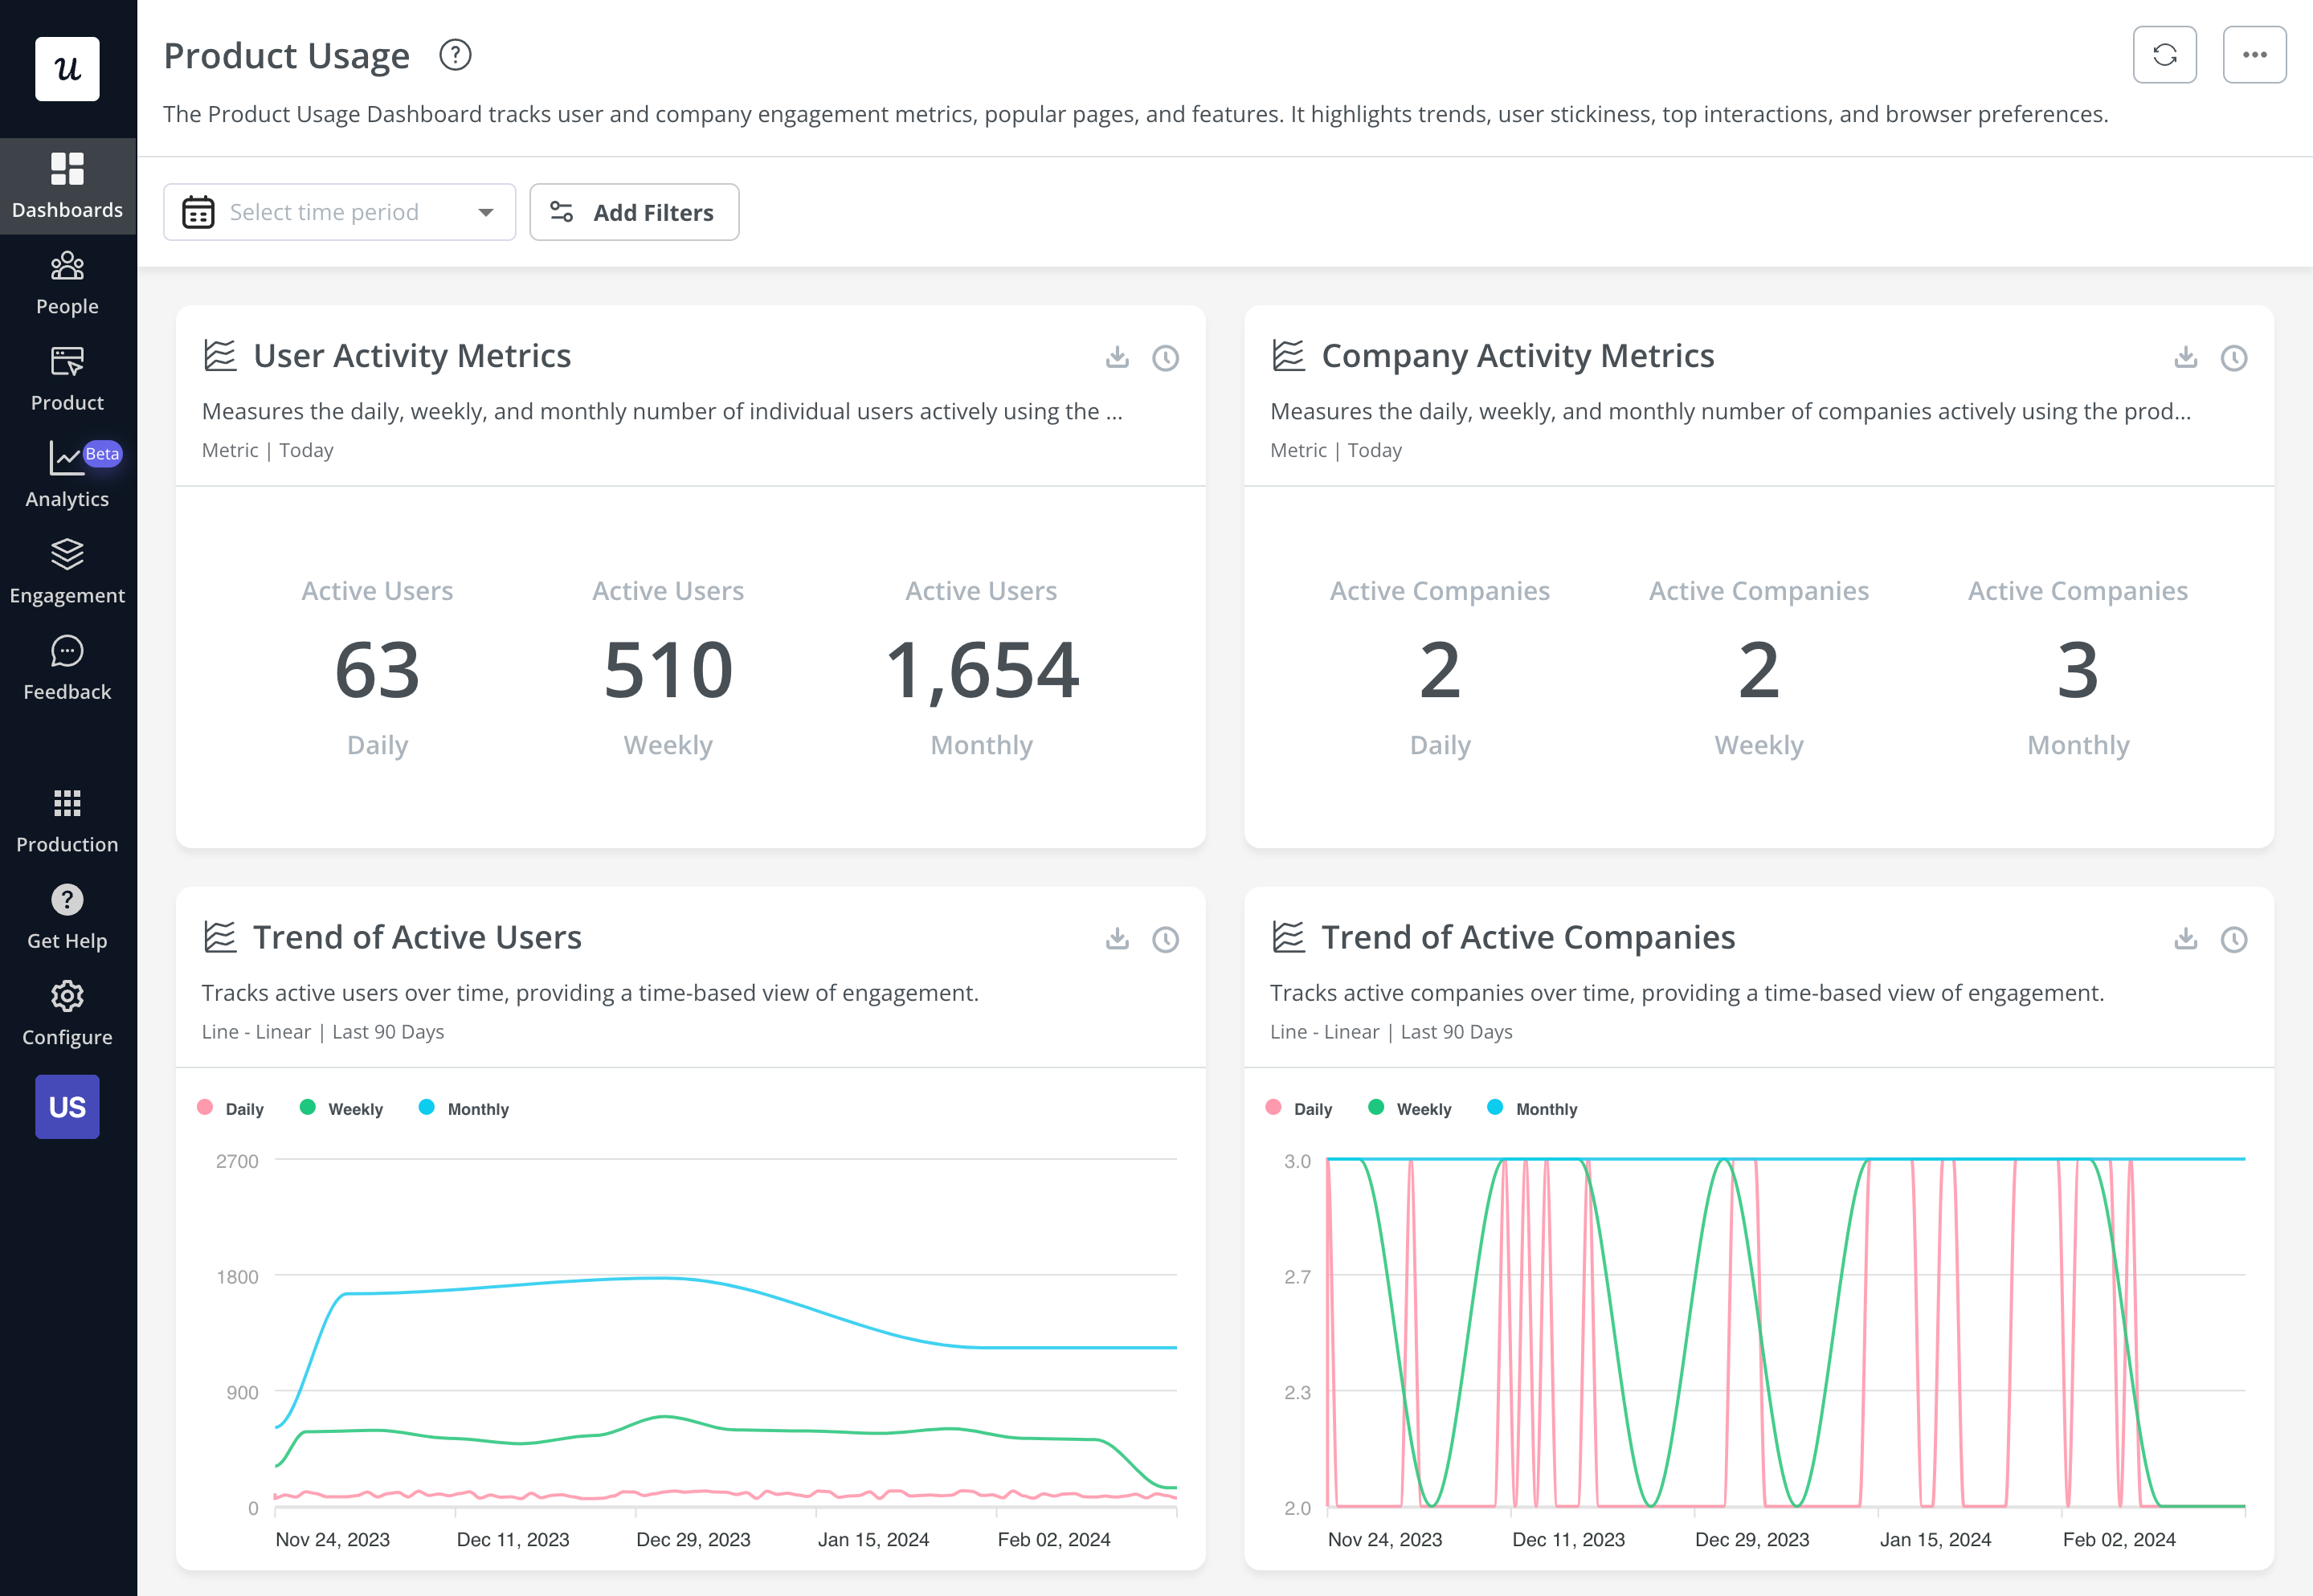 Product usage dashboard in Userpilot.
 - User analytics: The Users dashboard gives you an overview of all your users while letting you sort by segment, company, or when they were last seen. You can also click on each user or company profile for a more granular data breakdown of Top events, Top pages, Sessions, etc. Tracking user/company behavior on an individual level can help you see the perspective, as you’ll be able to understand how specifically they engage with your product or platform – which is useful for enhancing customer experience.
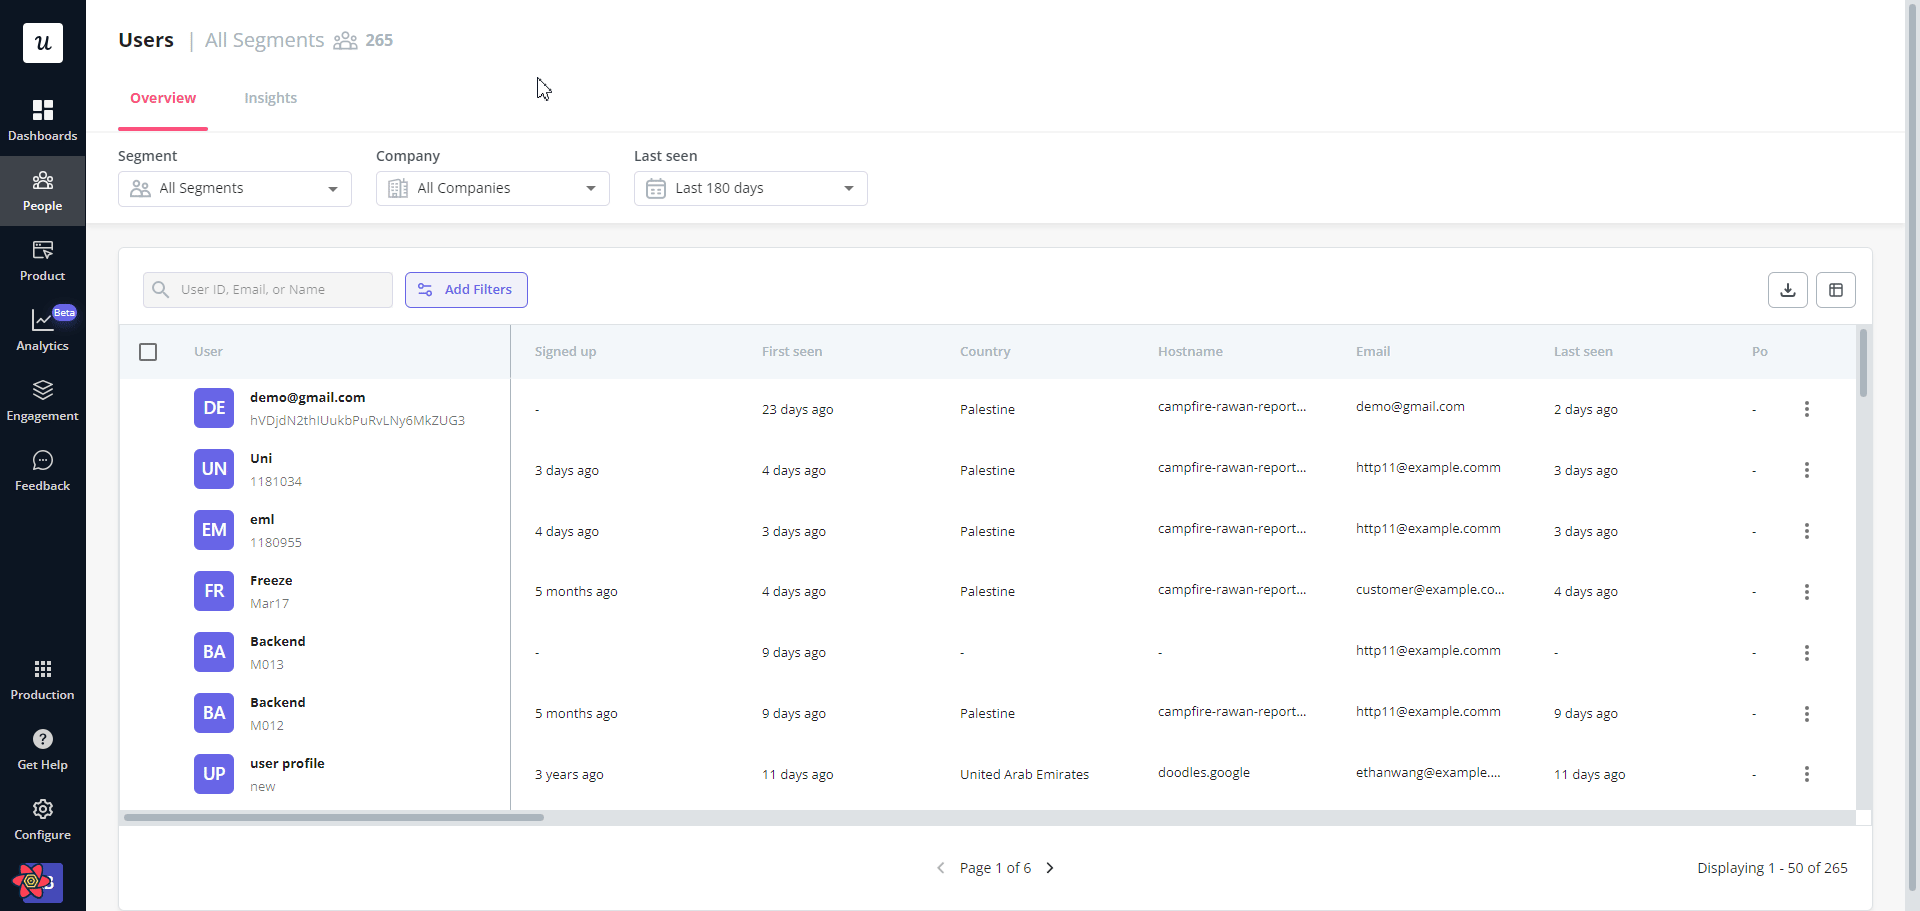 User profile analytics with granular insights into what feature a user often engages with.
Pricing of Userpilot
Userpilot’s transparent pricing ranges from $249/month on the entry-level end to an Enterprise tier for larger companies.
Furthermore, Userpilot’s entry-level plan includes access to all UI patterns and should include everything that most mid-market SaaS businesses need to get started.
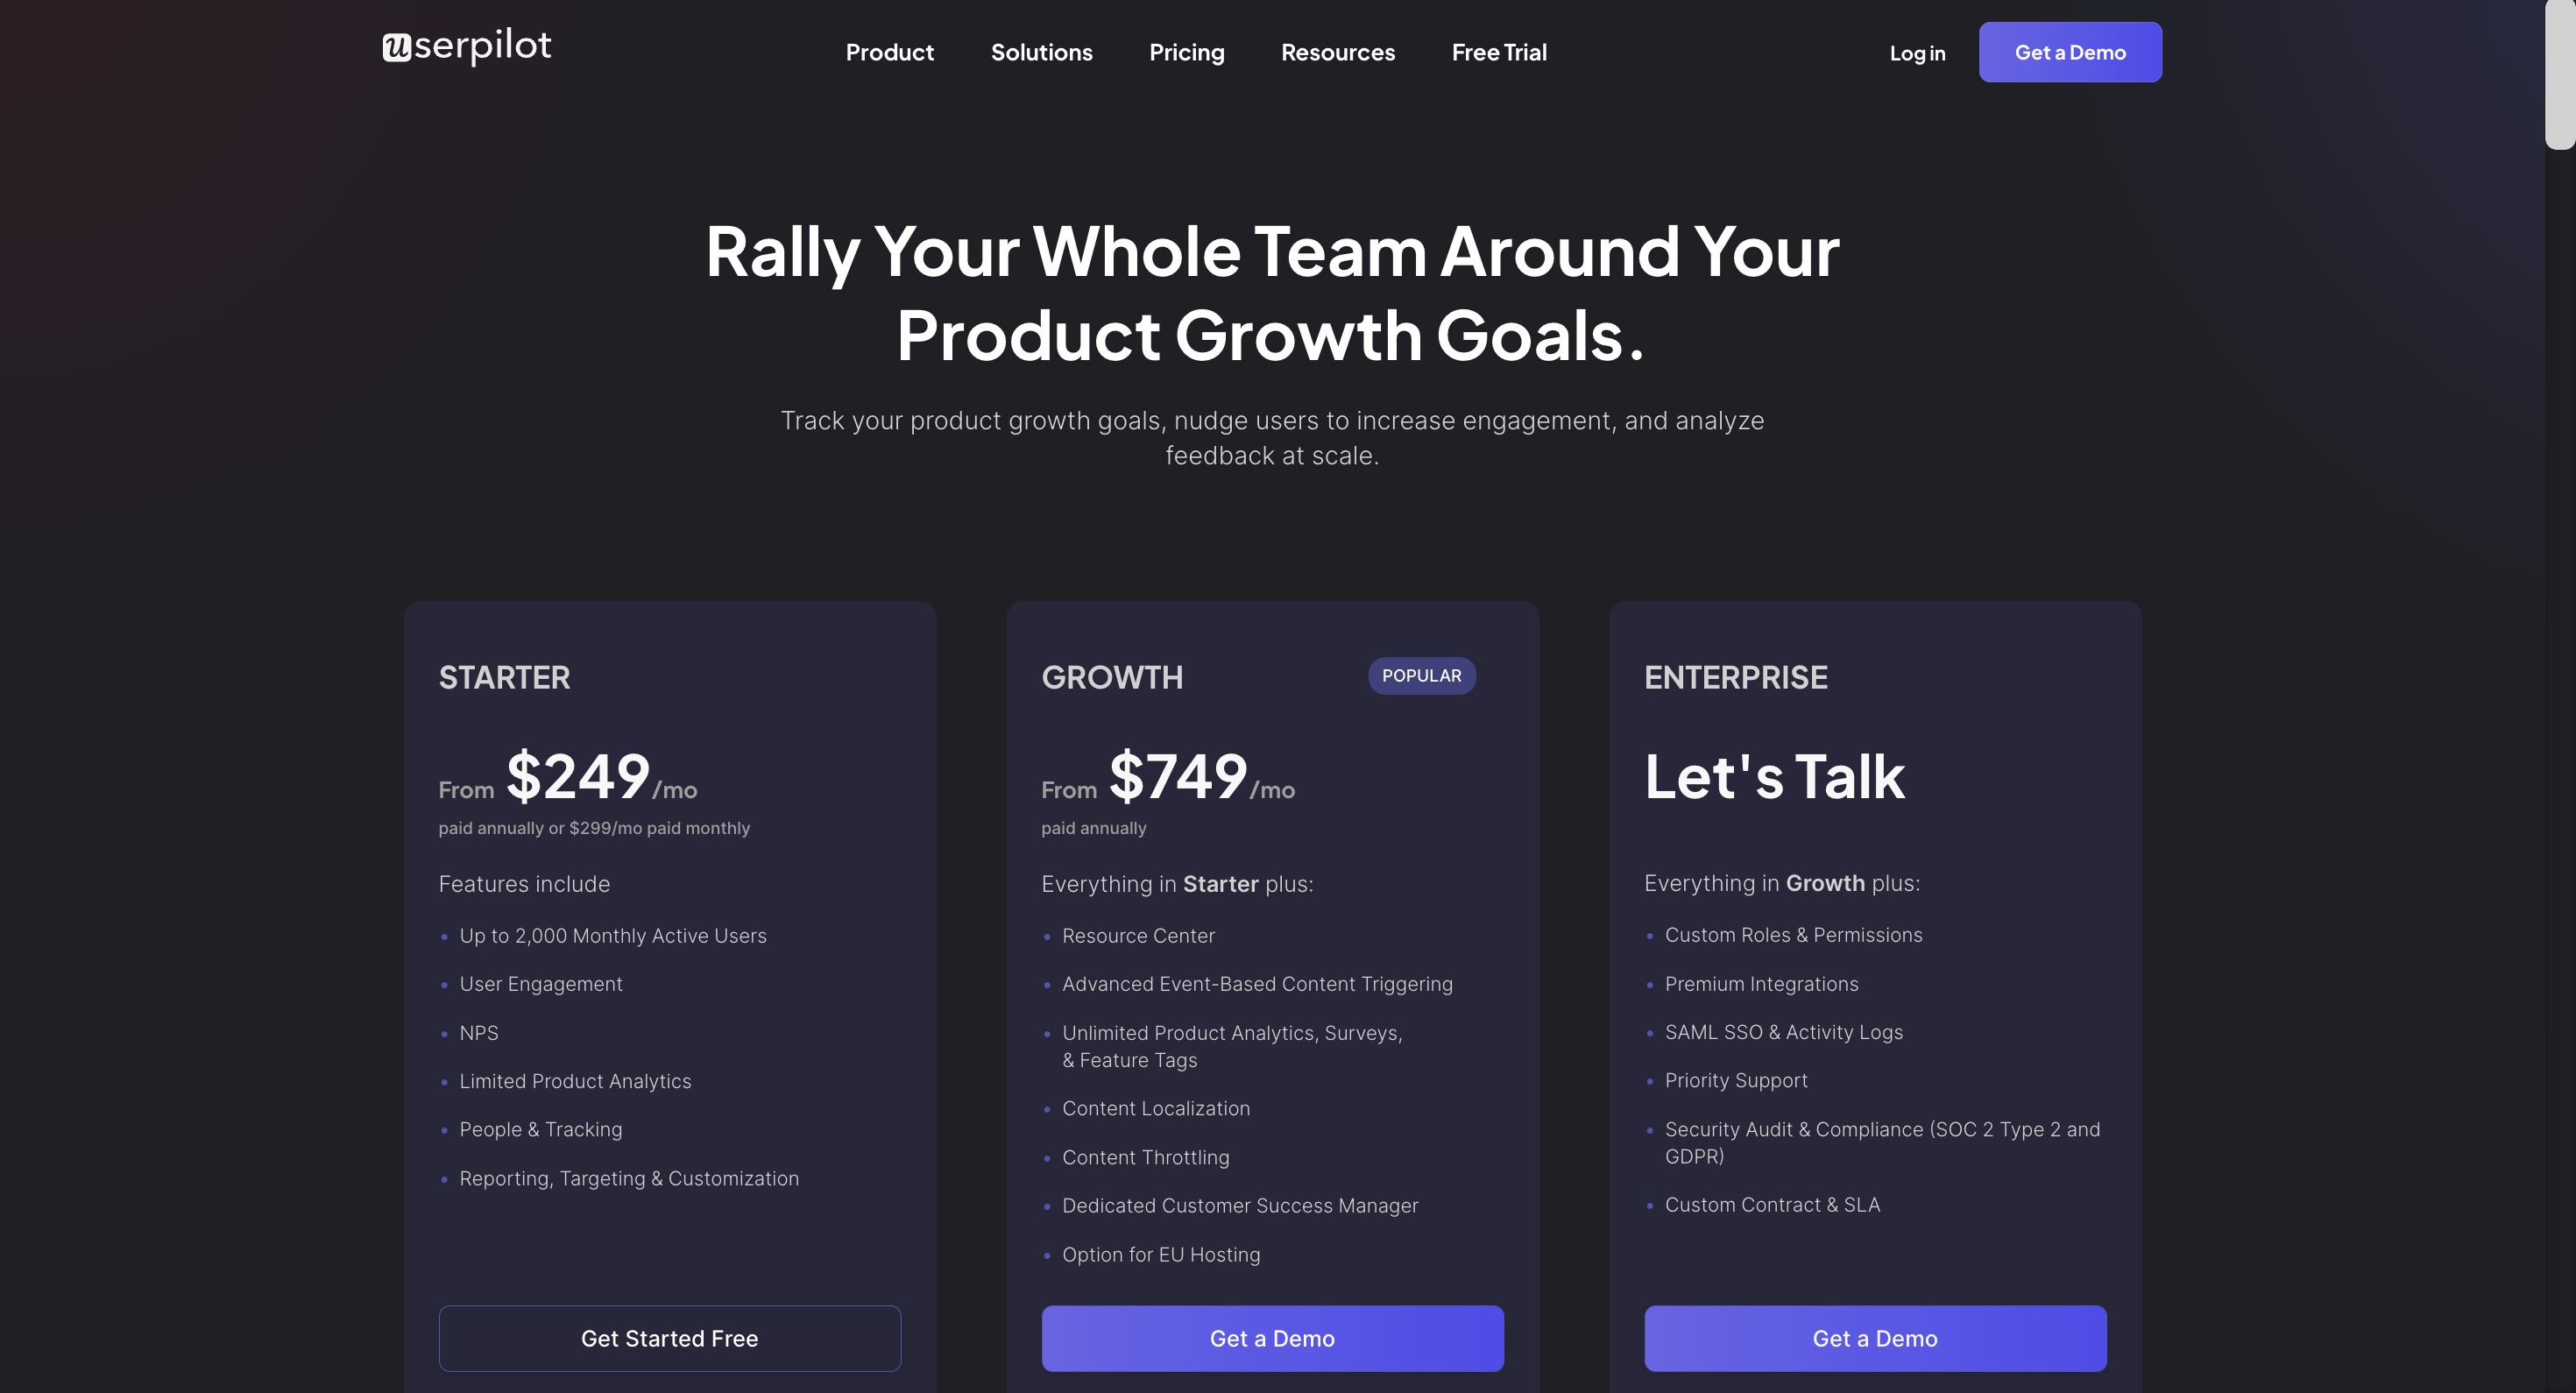
Userpilot has three paid plans to choose from:
- Starter: The entry-level Starter plan starts at $249/month and includes features like segmentation, product analytics, reporting, user engagement, NPS feedback, and customization.
- Growth: The Growth plan starts at $749/month and includes features like resource centers, advanced event-based triggers, unlimited feature tagging, AI-powered content localization, EU hosting options, and a dedicated customer success manager.
- Enterprise: The Enterprise plan uses custom pricing and includes all the features from Starter + Growth plus custom roles/permissions, access to premium integrations, priority support, custom contract, SLA, SAML SSO, activity logs, security audit, and compliance (SOC 2/GDPR).
Amplitude vs Mixpanel
There are many ways how Mixpanel is different (and in a lot of ways better!) from Amplitude. Let’s explore the features of Mixpanel, how it’s better than Amplitude, and how it may fall short too.
Mixpanel for product analytics
Product analytics is the art of collecting, analyzing, and leveraging data to optimize products, explore user behavior, and drive business growth.
It supports both mobile and web apps, and it’s an analytics tool of choice for product teams across the globe, regardless of the company size.
Mixpanel product analytics functionalities work based on:
- User segmentation: User segmentation is the bedrock of effective product analytics in Mixpanel. You can divide your user base into distinct groups based on attributes, behaviors, or properties and uncover meaningful trends and preferences among various user groups.
- Funnel analysis: Mixpanel’s funnel analysis feature allows you to create sequences of events that users should ideally complete. This helps you gain insights into where users drop off and where they progress.
- Retention analysis: With the retention analysis feature, you are able to track how often users return to your application after their initial interaction.
Mixpanel offers a free plan with very advanced product analytics functionality but no engagement layer or feedback features like that of Userpilot. Even though Userpilot may not support such advanced analytics as Mixpanel, it still offers enough to enable product managers to make data-driven decisions.
Mixpanel for A/B testing
A/B testing is a scientific, evidence-based method to optimize the performance of a product or landing page.
With Mixpanel’s A/B testing, you can experiment with variations of your product, features, or user experiences and make data-driven decisions based on user behavior.
So, what features make this a reality:
- Experiment creation: With the experiments feature, you can create different versions of your interface, messaging, or features to test how users respond to each variation.
- Event tracking integration: Mixpanel’s event tracking functionality integrates events into your experiments, allowing you to track user interactions and behaviors within each variation accurately.
- Iterative testing: You can implement changes based on the results of one test, continuously refine your product variations, and drive ongoing improvements.
There are other specific comprehensive A/B testing features like grouping, which are not found on Mixpanel. For instance, Userpilot makes it easy to test flows against a control group (Userpilot vs. nothing). With that data, your team can now make more informed decisions and measure the impact that flows are having on your growth goals with higher accuracy.
Mixpanel for behavioral analytics
Mixpanel has features for behavioral analytics that help product teams and developers understand users’ actions.
Below are features that are accessible for use when analyzing user behavior on Mixpanel:
- Funnels: To track users’ progress toward outcomes such as purchases or signups, Mixpanel’s funnel feature can help you with funnel reports. Funnels display a series of stages in a user journey and how many users progress from one stage to the next—for example, from download to sign up and purchase. If one stage has a low conversion rate, it’s a signal that that stage needs attention.
- A/B test segmentation: Mixpanel’s segmentation helps teams build more complete customer profiles and create cohorts (defined segments of users based on common important characteristics or experiences). Armed with this information, you can adjust your product and marketing to better address the specific needs of each segment or of the business.
- Data association: Each data point corresponds to a unique user ID, connecting events like sign-ups, cart additions, and interactions.
- Data customization: Mixpanel’s customizable data parameters allow precise user behavior insights, enabling behavioral segmentation for targeted campaigns.
- User activity tracking: Daily, weekly, and monthly active user reports (DAU, WAU, MAU) provide insights into user engagement trends.
- Integration flexibility: Mixpanel seamlessly integrates with tools like Segment, streamlining data sharing. SDKs and an import API further enhance data management.
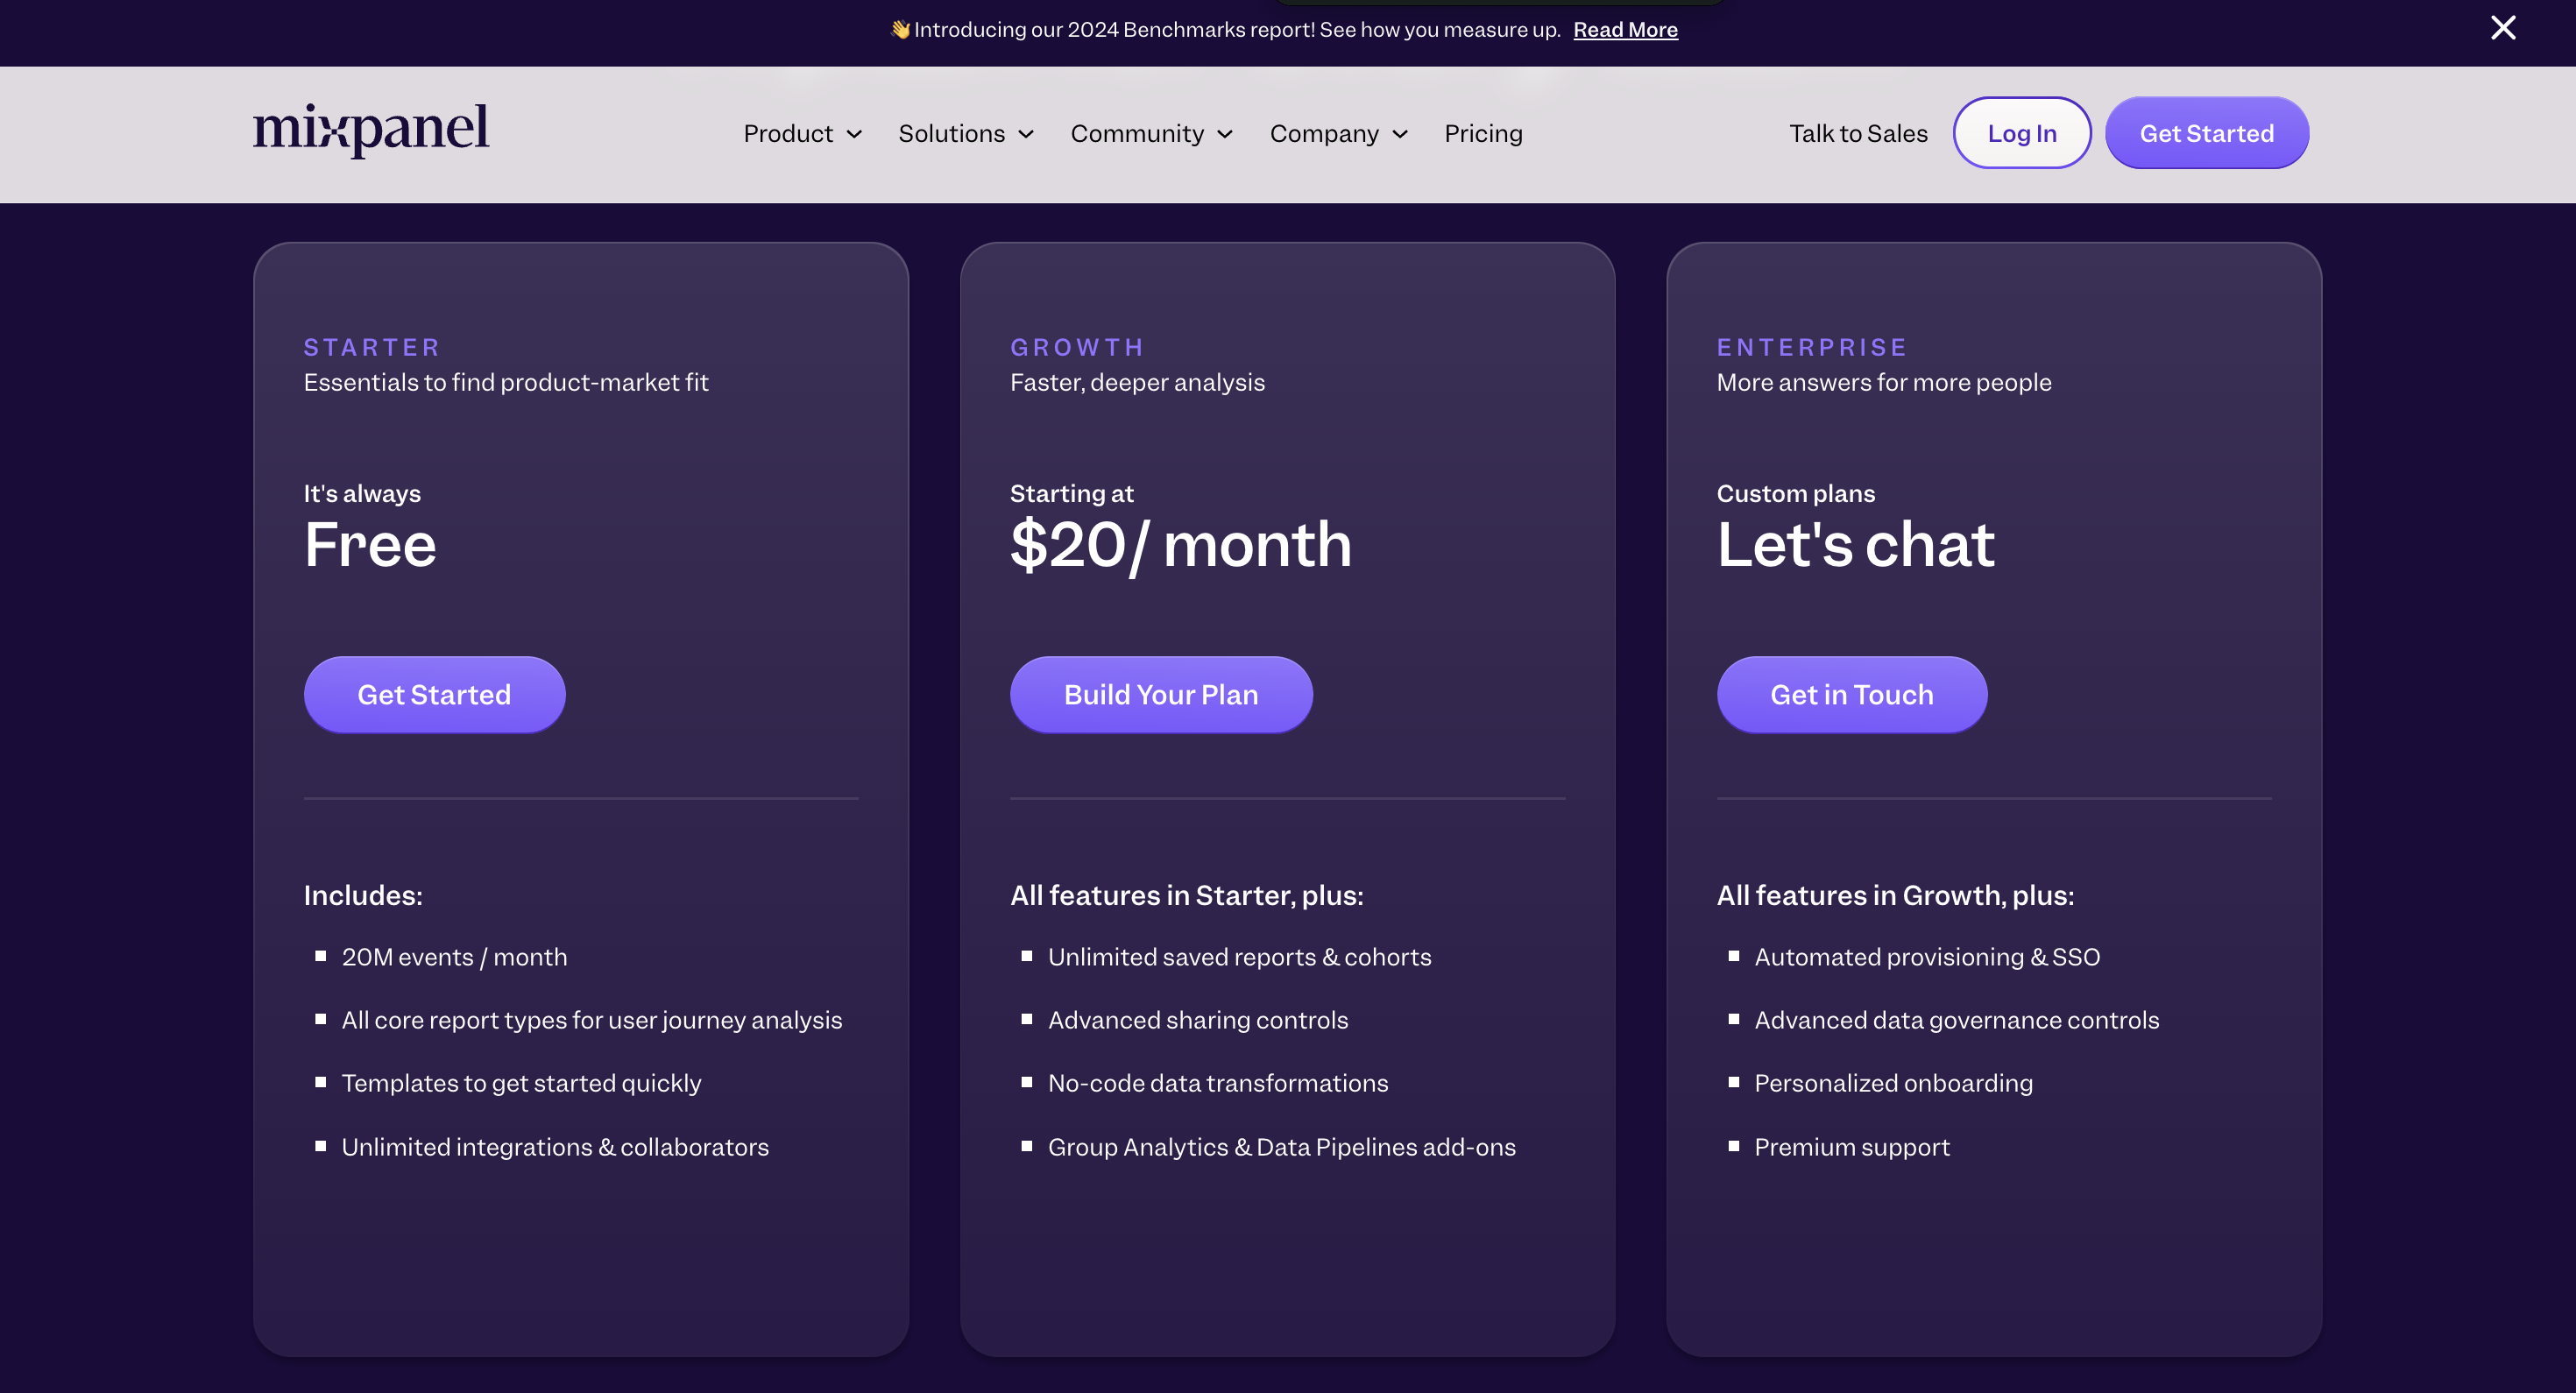
Pricing of Mixpanel
Mixpanel’s pricing plan is divided into 3 plans; the starter plan, the enterprise plan, and the growth plan.
Here’s an overview of the pricing plans and features of each plan:
- Starter plan: This plan features essentials to find product-market fit. It is free and allows up to 20M monthly events. In addition, you get access to all core reports for user journey analysis, templates to get started easily, unlimited integrations, and unlimited collaborators.
- Growth plan: This plan costs $20 per month for up to 100M monthly events. You get all features in the starter plan plus unlimited saved reports to monitor, update & iterate on KPIs, Mixpanel modeling layer, and group analytics & data pipeline add-ons.
- Enterprise plan: This plan empowers your team, especially if you have a large organization. You’ll have to contact their sales representatives for the cost. This plan features all the benefits of the growth plan plus advanced access controls, shared data views for collaboration, automated provisioning & SSO, and prioritized support.
Amplitude vs Heap
There are many ways how Heap is different (and in a lot of ways better!) from Amplitude. Let’s explore the features of Heap, how it’s better than Amplitude, and how it may fall short too.
Heap for product analytics
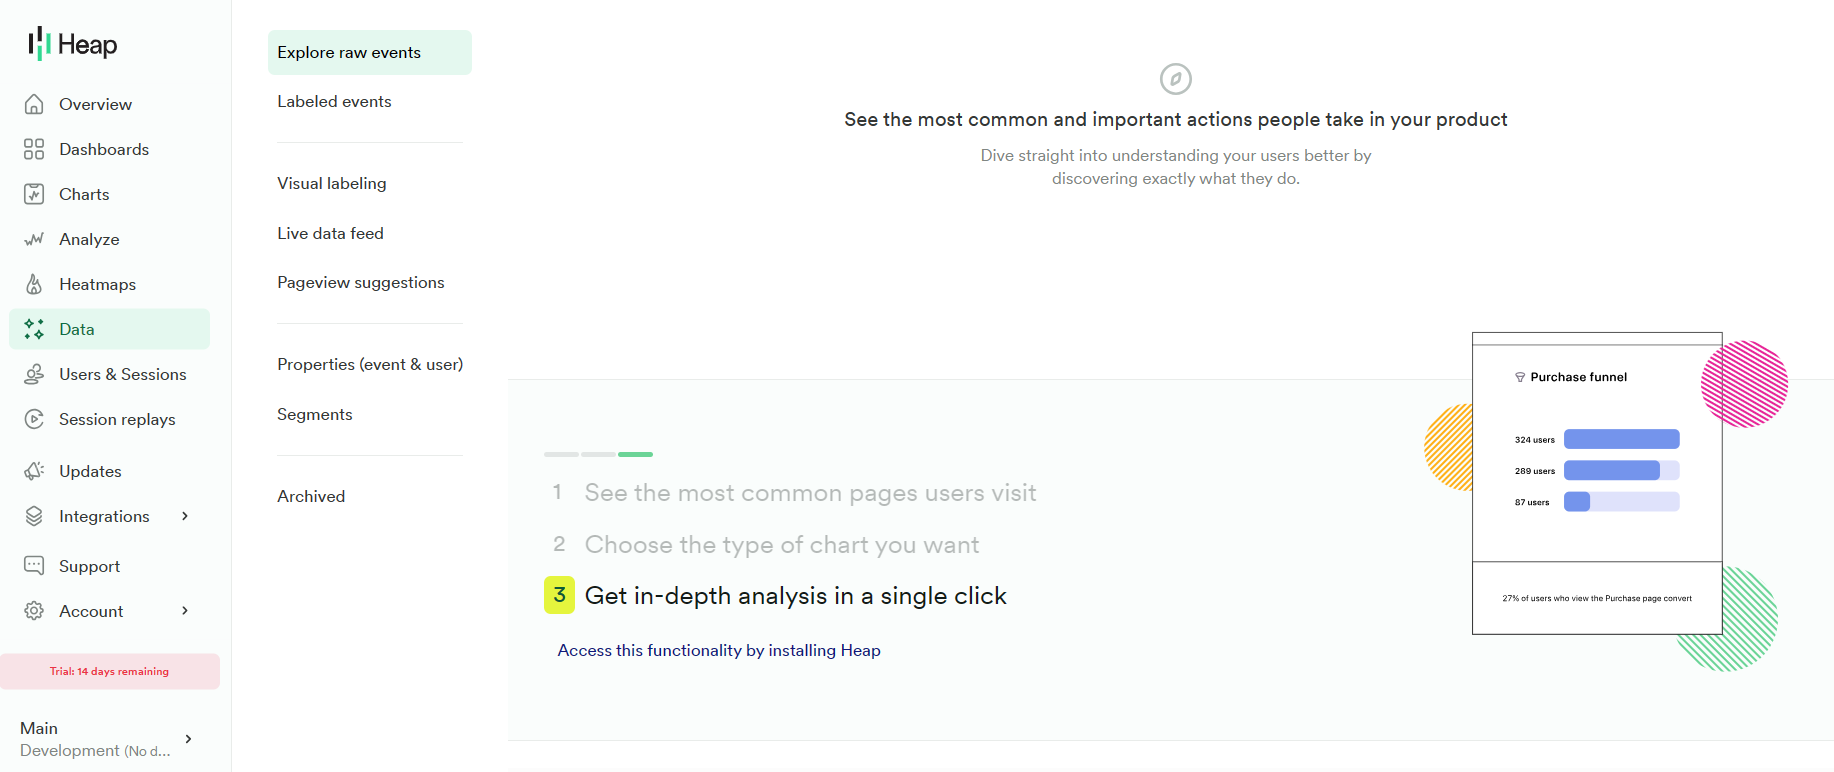
As a cutting-edge product analytics tool, Heap is packed with features that help you monitor product usage, activation, and adoption. Insights from Heap can help you identify points of friction in user journeys and optimize the user experience to drive product growth.
Here’s how Heap facilitates seamless product analytics:
- Once you install Heap’s code snippet into your product, it automatically starts tracking user actions. You can access this raw data on your Heap dashboard and label the most relevant events.
In-depth analysis on Heap.
- You can use the Live data feed for a glimpse of how users move through your product in real time. This makes it easier to identify and eliminate roadblocks.
Real-time data on Heap.
- You can use Session Replays to monitor the exact journey a user takes within your product. It’ll help you identify points where they struggle to complete an action or leave without taking the desired action.
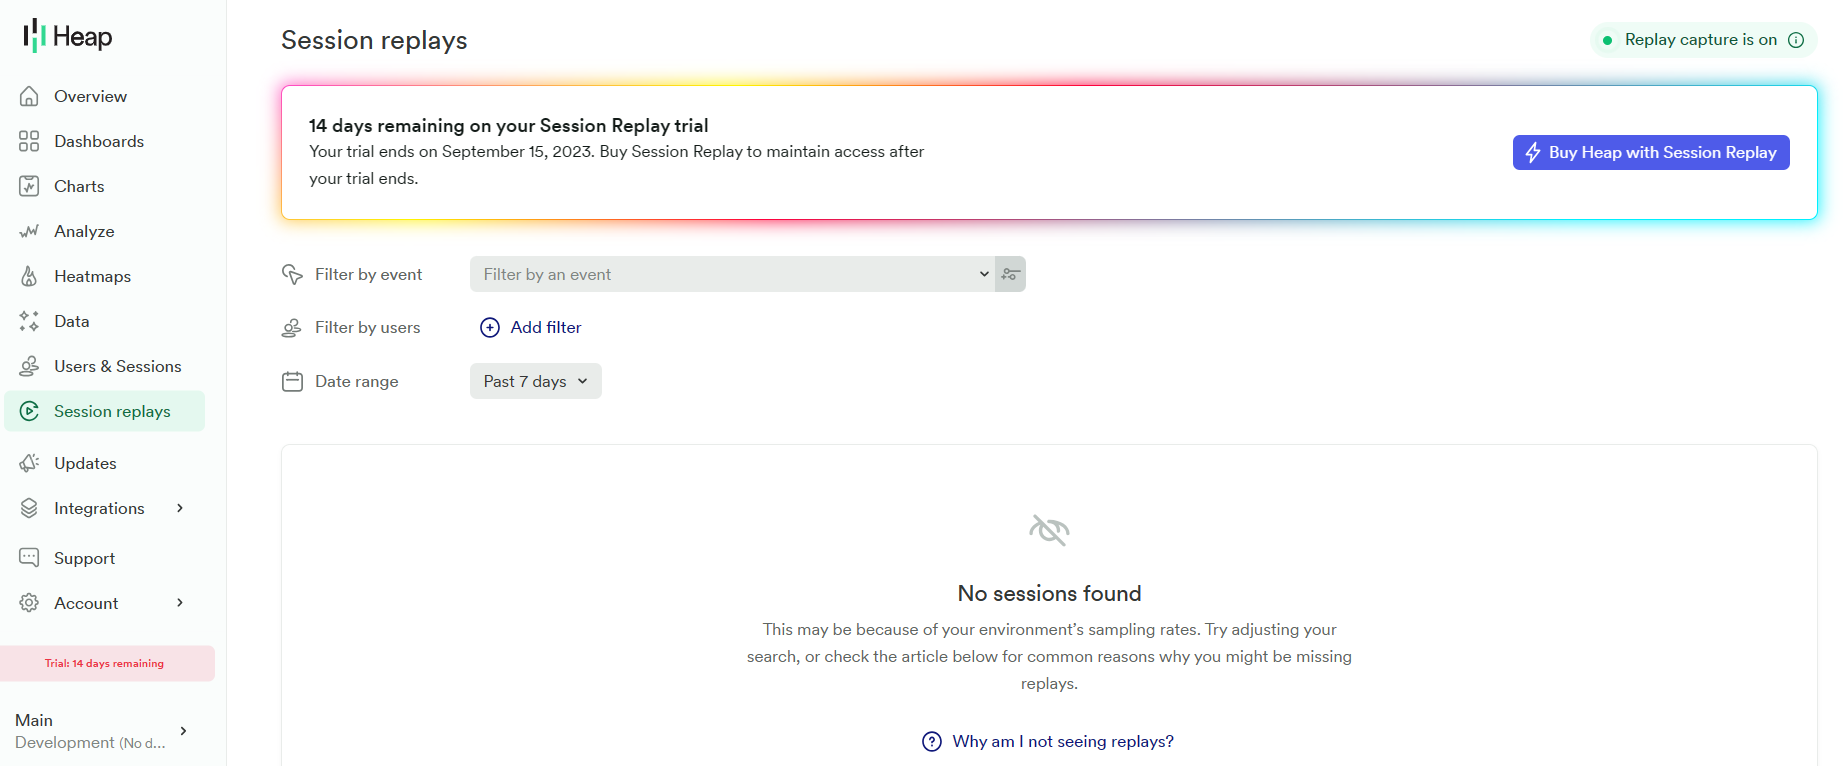
Session replays feature on Heap.
- Head to the “Usage over time” chart in the Analyze section for an overview of different events, user behavior, and conversion rates. Heap provides numerous filters for these events too.
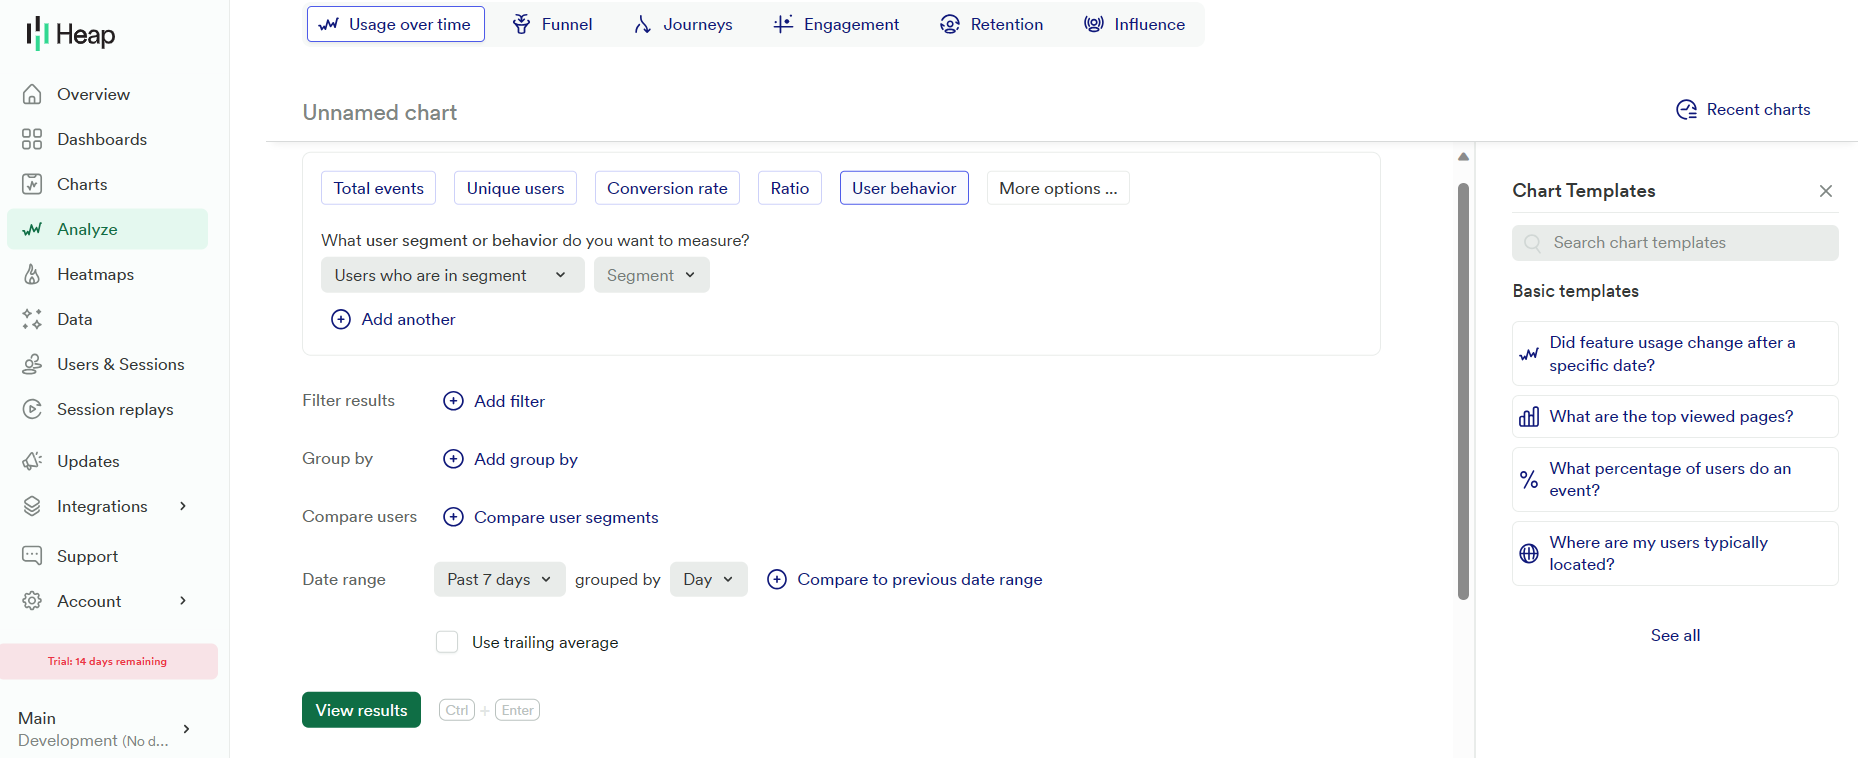
Usage tracking on Heap.
- Other product analytics features that come in handy include Journey Maps, Funnel analysis, Retention analysis, and Heatmaps.
Heap for A/B testing
Heap offers various tools to facilitate A/B testing. It’s worth noting that it doesn’t have any built-in functionalities to let you set up A/B tests.
However, you can use Heap’s robust suite of integrations to analyze the results from experiments implemented on other platforms, such as Google Optimizer and Optimizely X. Some of these integrations are only available in the Premier and Pro plans. You can also capture test data in Heap using APIs.
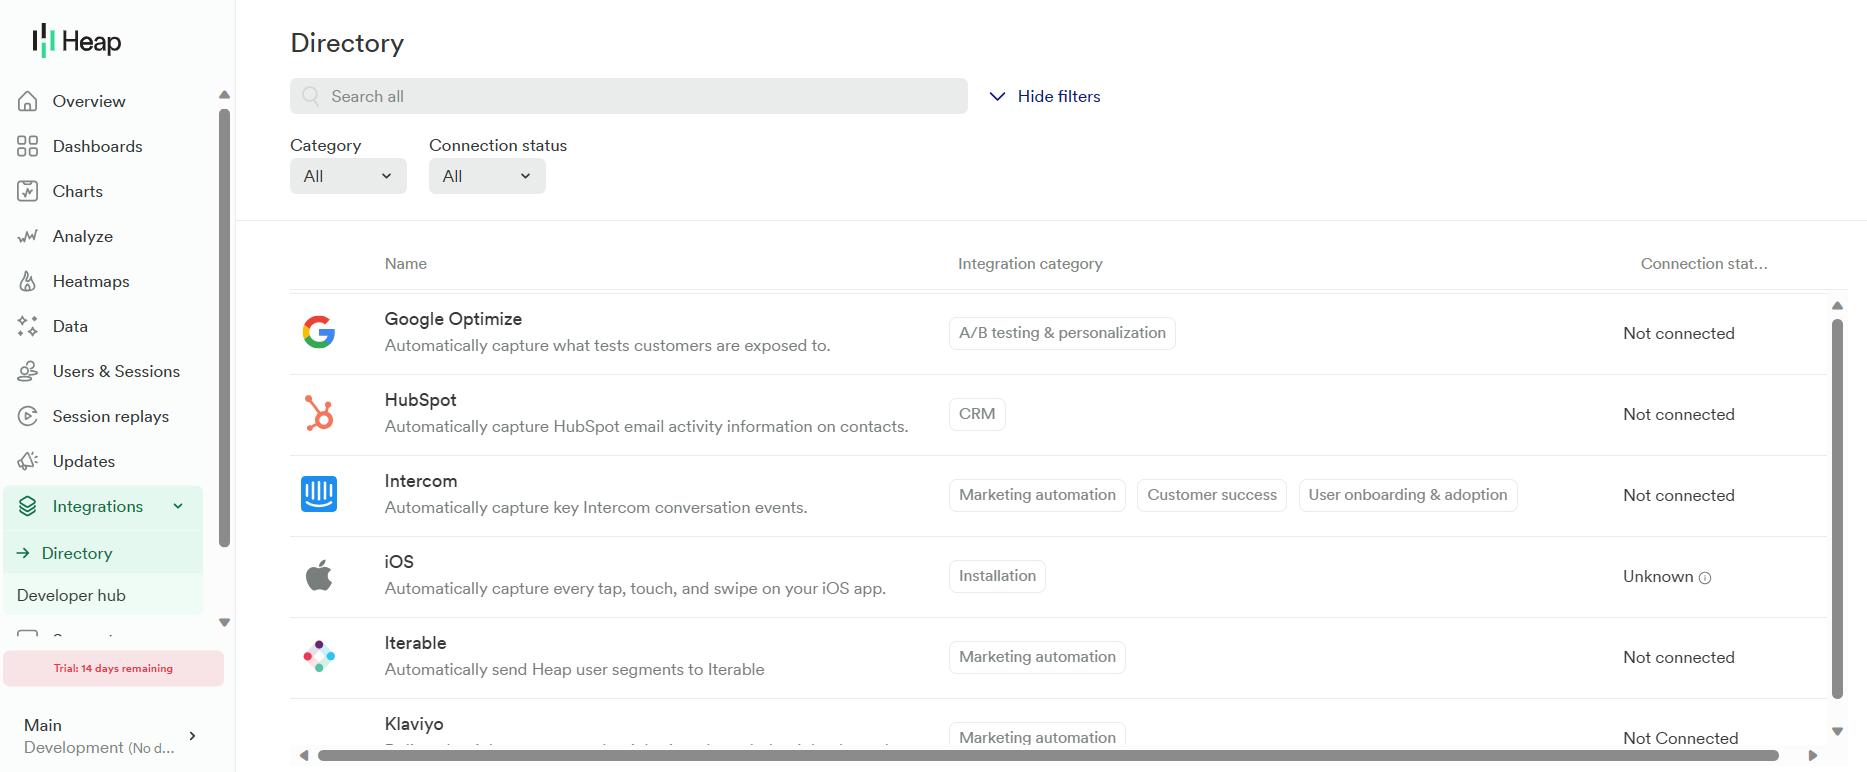
Integrations on Heap.
Once you set up an A/B test, you can use Heap in the following ways:
- Set up Funnel charts for each variation and measure the conversion rates.
- Use Journey maps to determine how users move through different variations of a path and identify the best-performing one.
- Use Heatmaps to monitor user interactions with different variations of an on-page element. It can help you improve the placement, appearance, and timing of call-to-action (CTA) buttons.
Heap for behavioral analytics
Monitoring user behavior can be instrumental in helping you understand how users interact with different elements and features. Also, it offers insight into various paths users take to navigate your product. That, in turn, can help you identify users who repeat an action, reach a goal, or churn.
Heap facilitates user behavior analysis with the following tools:
- The Autocapture feature tracks user actions and collects event data as soon as you install Heap into your product. You need not set up custom events. That means you can monitor user behavior retroactively.
- Session Replays and Heatmaps provide you with an in-depth overview of how users navigate your product, including the actions they take and the roadblocks they face.
- With the Usage over time chart, you can monitor how different user segments interact with your product and even compare the behavior of different segments.
Pricing of Heap
Pricing for Heap is available on request. You’ll have to contact the sales team for a quote. The final price will depend on various factors, including the number of sessions and integrations you need.
That said, Heap offers a free plan that lets you track up to 10,000 user sessions per month and stores your data for 6 months. Review platforms like G2 say that paid plans start at $3,600 per year. All paid plans come with a 14-day free trial, too.
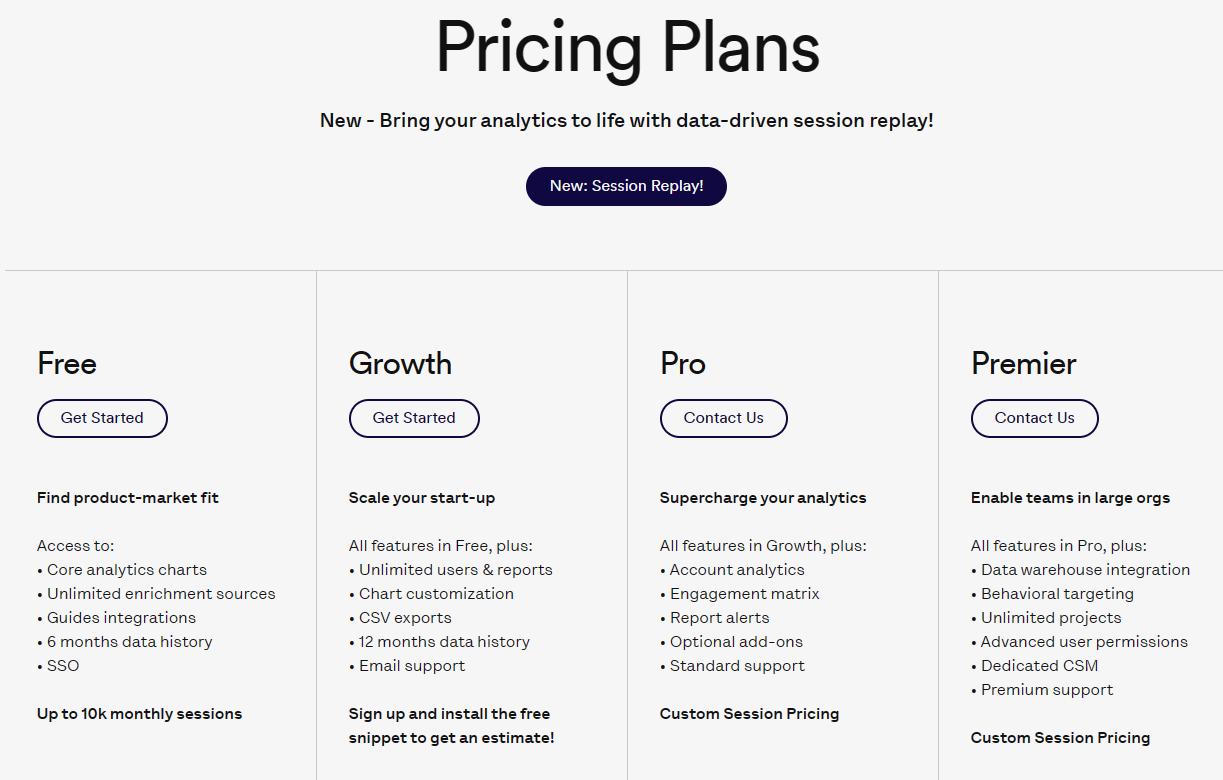
You can choose from the following plans:
- Free – Ideal for teams looking to establish product-market fit.
- Starter – Suitable for startups looking to scale their business.
- Growth – Useful for companies that need advanced features, such as account analytics and report alerts.
- Pro – Tailored for enterprise businesses with robust security and compliance requirements.
It’s worth mentioning here that Heap offers a handy ROI calculator to help you get a clearer picture of whether it’s worth the investment.
Amplitude vs Google Analytics
There are many ways in which Google Analytics is different (and in a lot of ways better!) from Amplitude. Let’s explore the features of Google Analytics, how it’s better than Amplitude, and how it may fall short too.
Google Analytics for product analytics
Google Analytics isn’t just for web and user analytics; it’s also for product analytics. Businesses use Google Analytics to analyze user actions, website traffic, and product achievements.
Here are some ways e-commerce companies use Google Analytics for product analytics:
- Product data import: The product data import feature is excellent for tracking user behavior and conversions. Users can import data into Google Analytics. This simplifies and reduces the amount of data you need to send by importing product data.
- Product Performance Report: With the performance report, e-commerce brands can review their data for consistent patterns.
However, if you are a SaaS company and want to monitor how your product is performing, you may want to consider another product analytics software that allows you to collect user behavior data, filter it, display it in customized formats, and analyze it.
Google Analytics for A/B testing
Marketers and Product folks apply A/B testing to make data-driven decisions and remove guesses or assumptions.
Here are two key features of Google Analytics for A/B testing:
- Content experiment: Google Analytics has a content experiment feature. Users can compare different variations of pages with it. In an A/B test, you can create two or more variants of the same web page, with variant A being the original and variant B containing at least one modified element.
- Segmentation: You can segment users in Google Analytics based on user behavior, demographics, locations, and interests. Analyze the performance of various segments. And double down on the best-performing segments.
Google Analytics for behavioral analytics

Google Analytics is a powerful tool that can give you a great number of insights into your users, their journey through your website, and how your marketing efforts translate into business goals. Here is how it can help:
- User Engagement Tracking: Google Analytics allows you to monitor user interactions, such as page views, click patterns, and session durations, helping you understand how users engage with your website or app.
- Conversion Tracking: It enables you to track conversions and goals, like sign-ups or purchases, providing insights into the specific actions users take, as well as where they drop off in the conversion funnel.
- Audience Segmentation: You can segment your audience based on various criteria (e.g., demographics, geography, device type), allowing you to analyze user behavior within specific groups and tailor your strategies accordingly.
Pricing of Google Analytics
Google Analytics is a free tool with paid upgrades available for advanced features. It has two price plans: the free and 360 plans respectively:
- Google Analytics offers a free version that provides a wide range of features for basic website analytics. It’s suitable for individuals, small businesses, and websites with relatively low traffic.
- GA 360 (now GA4) provides higher data limits, BigQuery integration, service level agreements, custom variables, and a dedicated support team. The cost of Google Analytics 360 starts from $12,500 per month and $150,000 per year. Google suggests that the cost of Google Analytics 4 360 starts at a retail price of USD $50,000/year, which entitles customers to 25 million events per month at no additional cost.
Conclusion
As you can see, there are many different competitors and alternatives to Amplitude. We’ve discussed a few above – but which one is the best?
The answer is “it depends” – but we strongly believe that if you’re a mid-market SaaS company looking for a great user onboarding and product analytics tool, Userpilot is the best option for you.
Hopefully, you found this post helpful. And if you need any help with how Userpilot is different, schedule a demo to get started!
![]()
Try Userpilot and Drive Product Growth with Actionable Insights

