An Essential Guide to Customer Experience Analytics for SaaS

How can customer experience analytics help you achieve product growth?
According to a research study by Zendesk, 52% of customers will defect to competitors after having a single bad experience. Therefore, meeting customer expectations with each experience with your product is crucial.
In this article, we’ll guide you on how you can leverage customer experience analytics to grow your SaaS business.
TL;DR
- Customer experience analytics is the process of gathering and analyzing customer data to better understand product experiences.
- CX analytics lets you understand user behavior, improve your product, boost customer satisfaction, and increase retention and customer lifetime value.
- To collect customer data for experience analytics, you should track feature usage using feature tags, analyze user interactions using heat maps and session recordings, and send NPS, CSAT, and CES surveys to collect customer feedback.
- To use user experience data, segment customers to understand user behavior, detect friction points using funnel analysis, and analyze customer feedback.
- The 6 key CX metrics are Customer Satisfaction Score (CSAT), Customer Effort Score (CES), Net Promoter Score (NPS), Customer Lifetime Value (CLV), retention rate, and churn rate.
- Userpilot, Hotjar, and Mixpanel are the top 3 experience analytics tools.
- With its no-code interface, custom event tracking, feature adoption monitoring, and in-app survey capabilities, Userpilot is a powerful product growth platform to help boost in-app engagement.
- Try out a Userpilot demo to collect actionable product growth insights.
What is customer experience analytics?
Customer experience analytics is the process of gathering and analyzing customer data to better understand their experiences with your product or service.
It includes the customer data collected from various microsurveys (such as NPS and CSAT surveys) and user interactions with your product.
Why should you track customer experience analytics?
Let’s briefly go over how tracking customer experience analytics will benefit you.
- Understand user behavior and preferences – Understanding user behavior helps you know what aspects of your product and marketing work for customers and what do not.
- You can leverage customer experience data to perform predictive analytics using artificial intelligence (AI) or machine learning (ML), which can help with churn prevention.
- Identify areas for improvement – You can find out the drop-off points and friction in the customer journey. Then you can offer help using in-app guidance or make feature improvements to eliminate these bottlenecks and reduce customer churn.
- Increase customer satisfaction and retention – You can identify customers’ pain points and proactively reach out to them with solutions to increase customer satisfaction. This, in turn, increases customer retention.
- Increase customer lifetime value and drive business growth – As you retain more loyal customers, the amount of revenue expected to earn from each customer increases, which drives customer lifetime value and, therefore, business growth.
How to collect customer data for experience analytics?
The first part of experience analytics, or any other analytics, is collecting customer data. Here’s how you can do that.
Track usage by tagging features in-app
Feature tags allow you to collect data on customer engagement. You can tag any UI element to monitor feature usage among different user segments across the customer journey. Then you can track metrics such as product usage, feature adoption rate, and feature usage frequency.
To collect data on feature usage, you can track user interactions such as clicks, hovers, and text inputs.
Moreover, you should compare the level of usage with the relative importance of features. Core features should exhibit higher usage to drive value for customers.
Feature popularity also lets you identify the killer features that distinguish you from competitors. You can invest more resources in these features and improve them to attract customers.
Collect customer engagement data with heat maps
Heat maps allow you to visualize customer experience data. For example, Userpilot’s heatmap feature helps you observe how customers interact with different features or UI elements on a page.
The data values in heat maps are represented by a color on a scale from red to blue. Red (hot) zones depict the most engaging elements, whereas blue (cold) zones highlight the least engaging ones.
There are two common types of heat maps:
- Click heat map: This heat map indicates the level of interaction by showing the frequency and direction of clicks on different features. With Userpilot, you can also check the total and unique clicks in a specific period.

- Scroll heat map: This heat map shows how far down a page customers scroll. This lets you analyze the effectiveness of elements like CTAs and find the proper length of landing pages.

Use session recordings to record customer interactions
Session recordings display real-life user interactions with your product. They let you see how customers navigate your product and use different UI elements.
You should use session recordings to understand how people use your product and why they make certain decisions about your product.
A dead click occurs when a user clicks on a UI element, and nothing happens. Using session recordings, you can identify reasons behind dead clicks, i.e., whether they were caused by error clicks, rage clicks, or something you aren’t aware of yet.

Send CSAT surveys to measure customer satisfaction score
Customer Satisfaction Score (CSAT) surveys ask users about their overall experience with your product or with particular features, customer support, and other interactions. You can measure general customer satisfaction scores or interaction-based customer satisfaction scores.
You should trigger CSAT surveys at multiple touchpoints across the customer journey. This will provide actionable insights into customer satisfaction.
Here’s a CSAT survey on onboarding experience that you can use to improve the onboarding process for each customer segment.
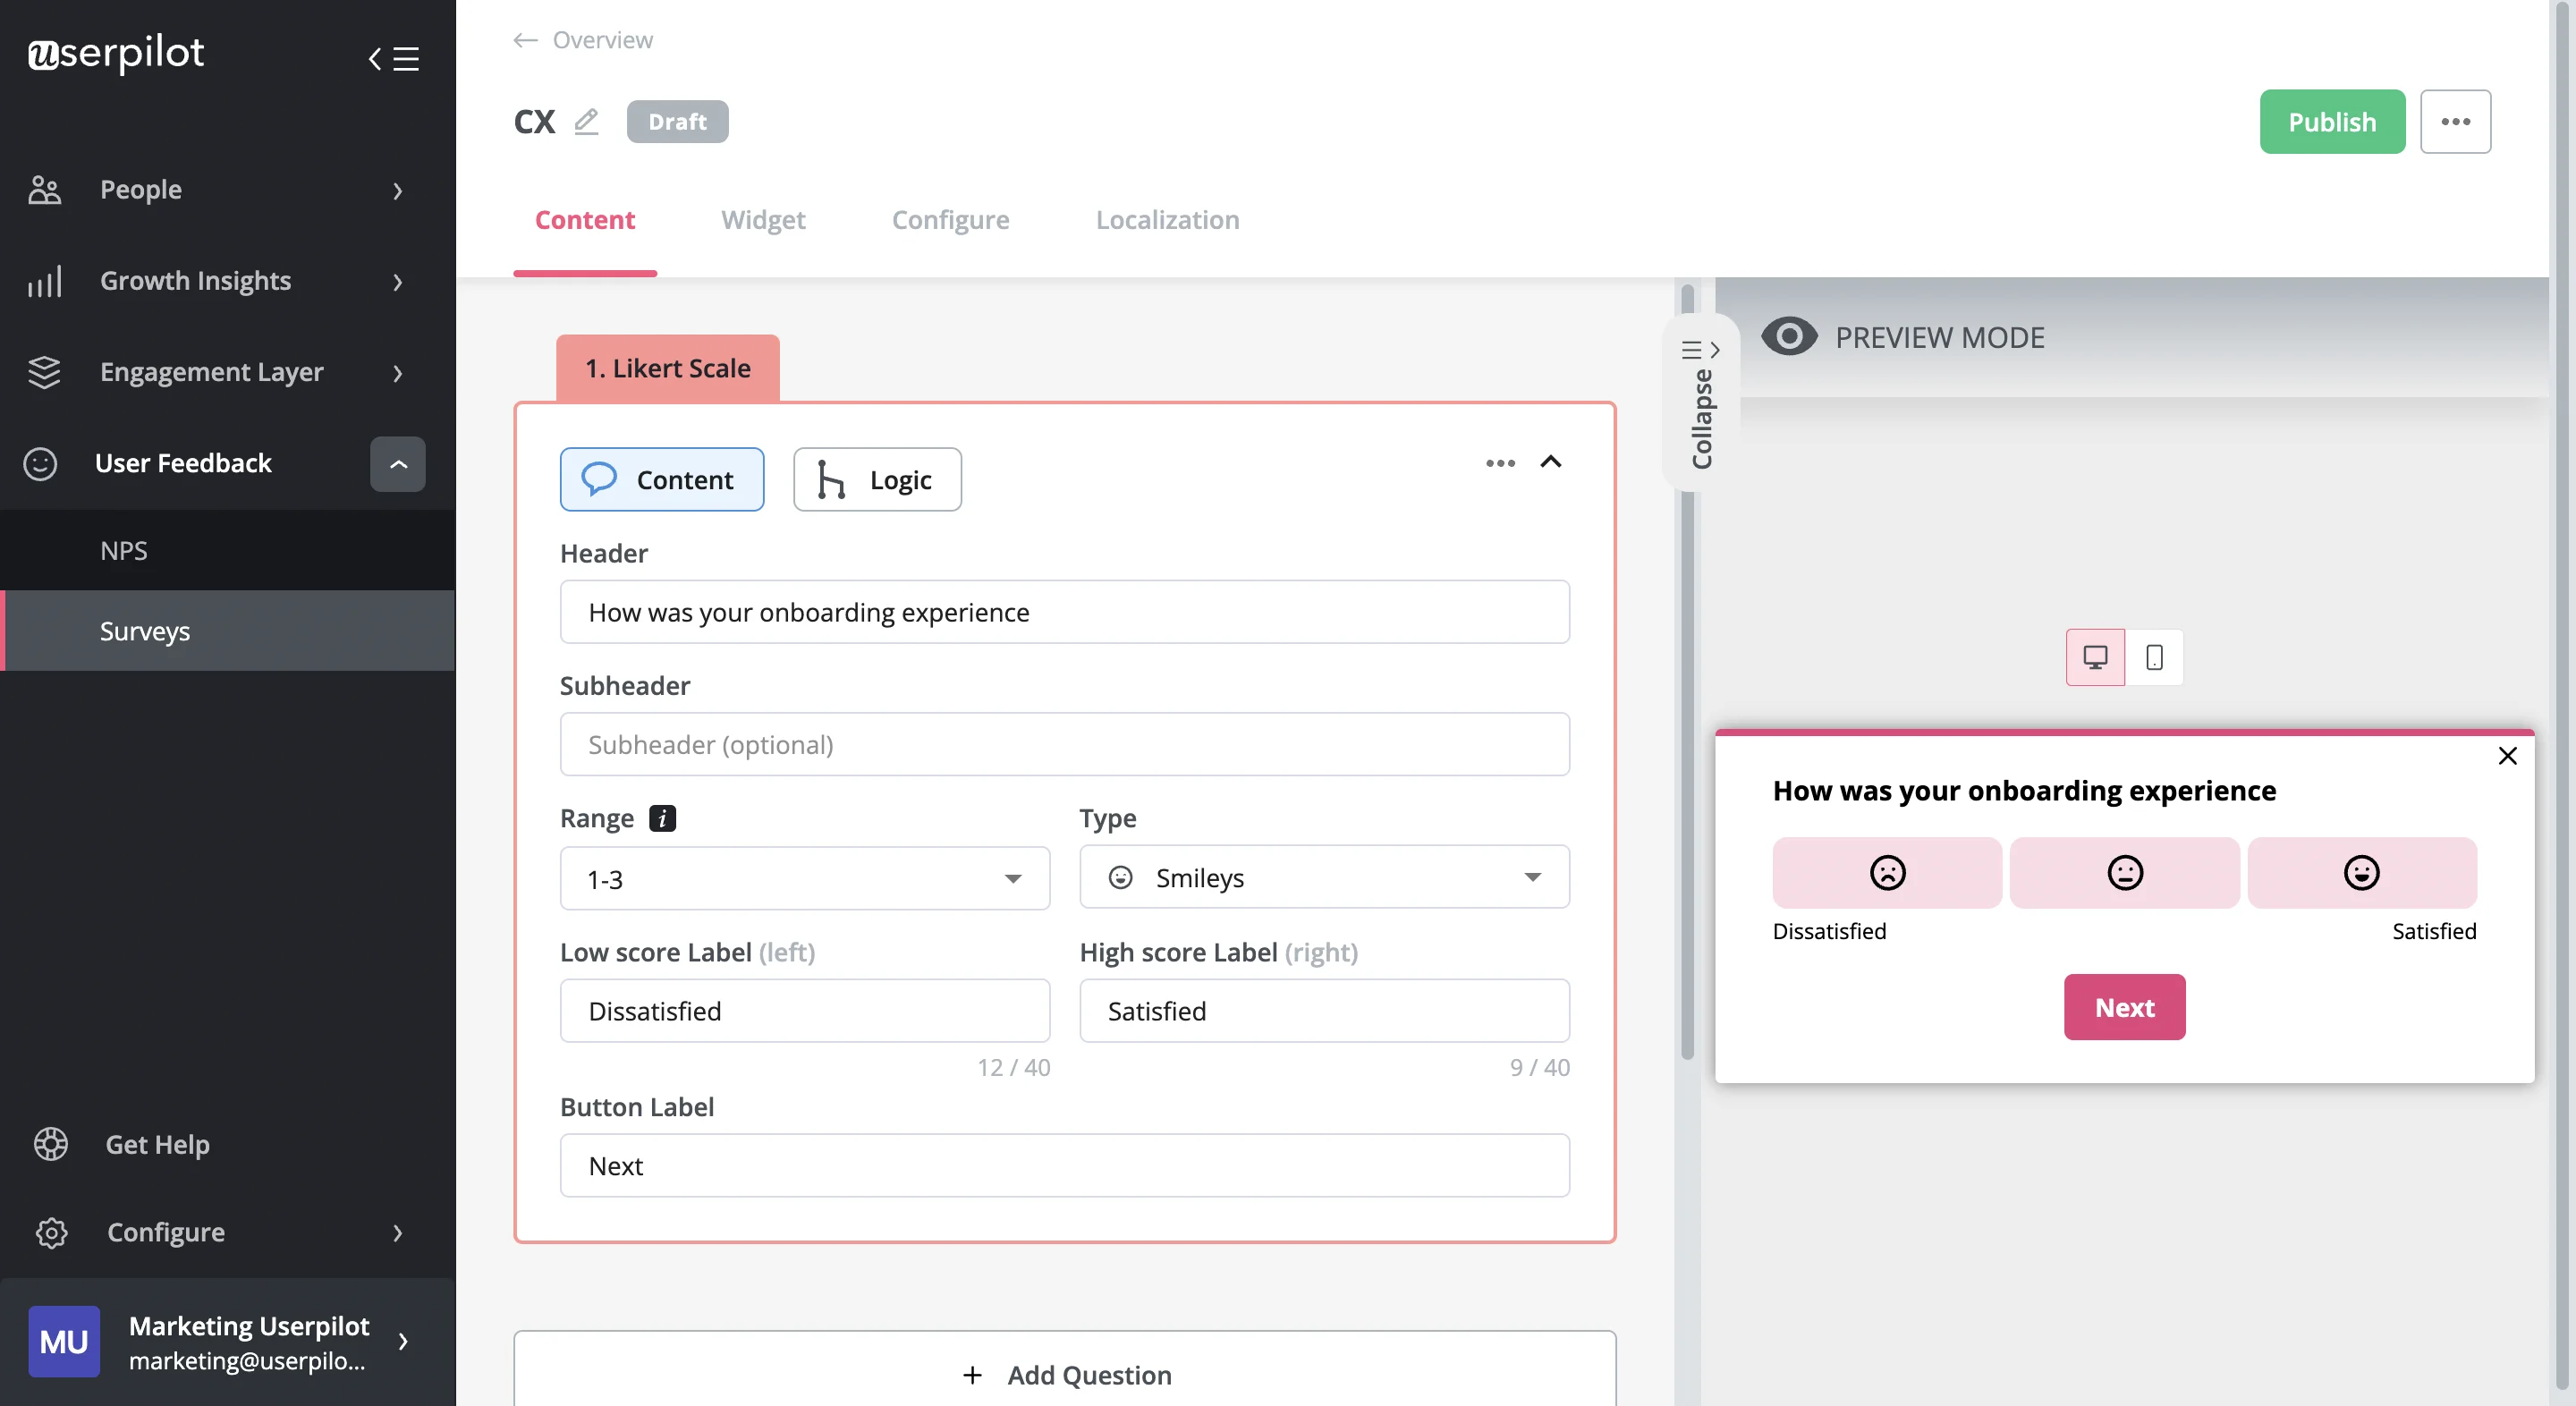
Customer Satisfaction Score (CSAT) survey
Use CES surveys to monitor customer effort score
Customer Effort Score (CES) surveys are used to measure how much effort it takes for customers to interact with your product. It essentially measures how easy a product experience is for customers.
CES surveys should be sent just after a user has completed an action, such as engaged with a feature, talked to a customer support agent, or reached an activation milestone.
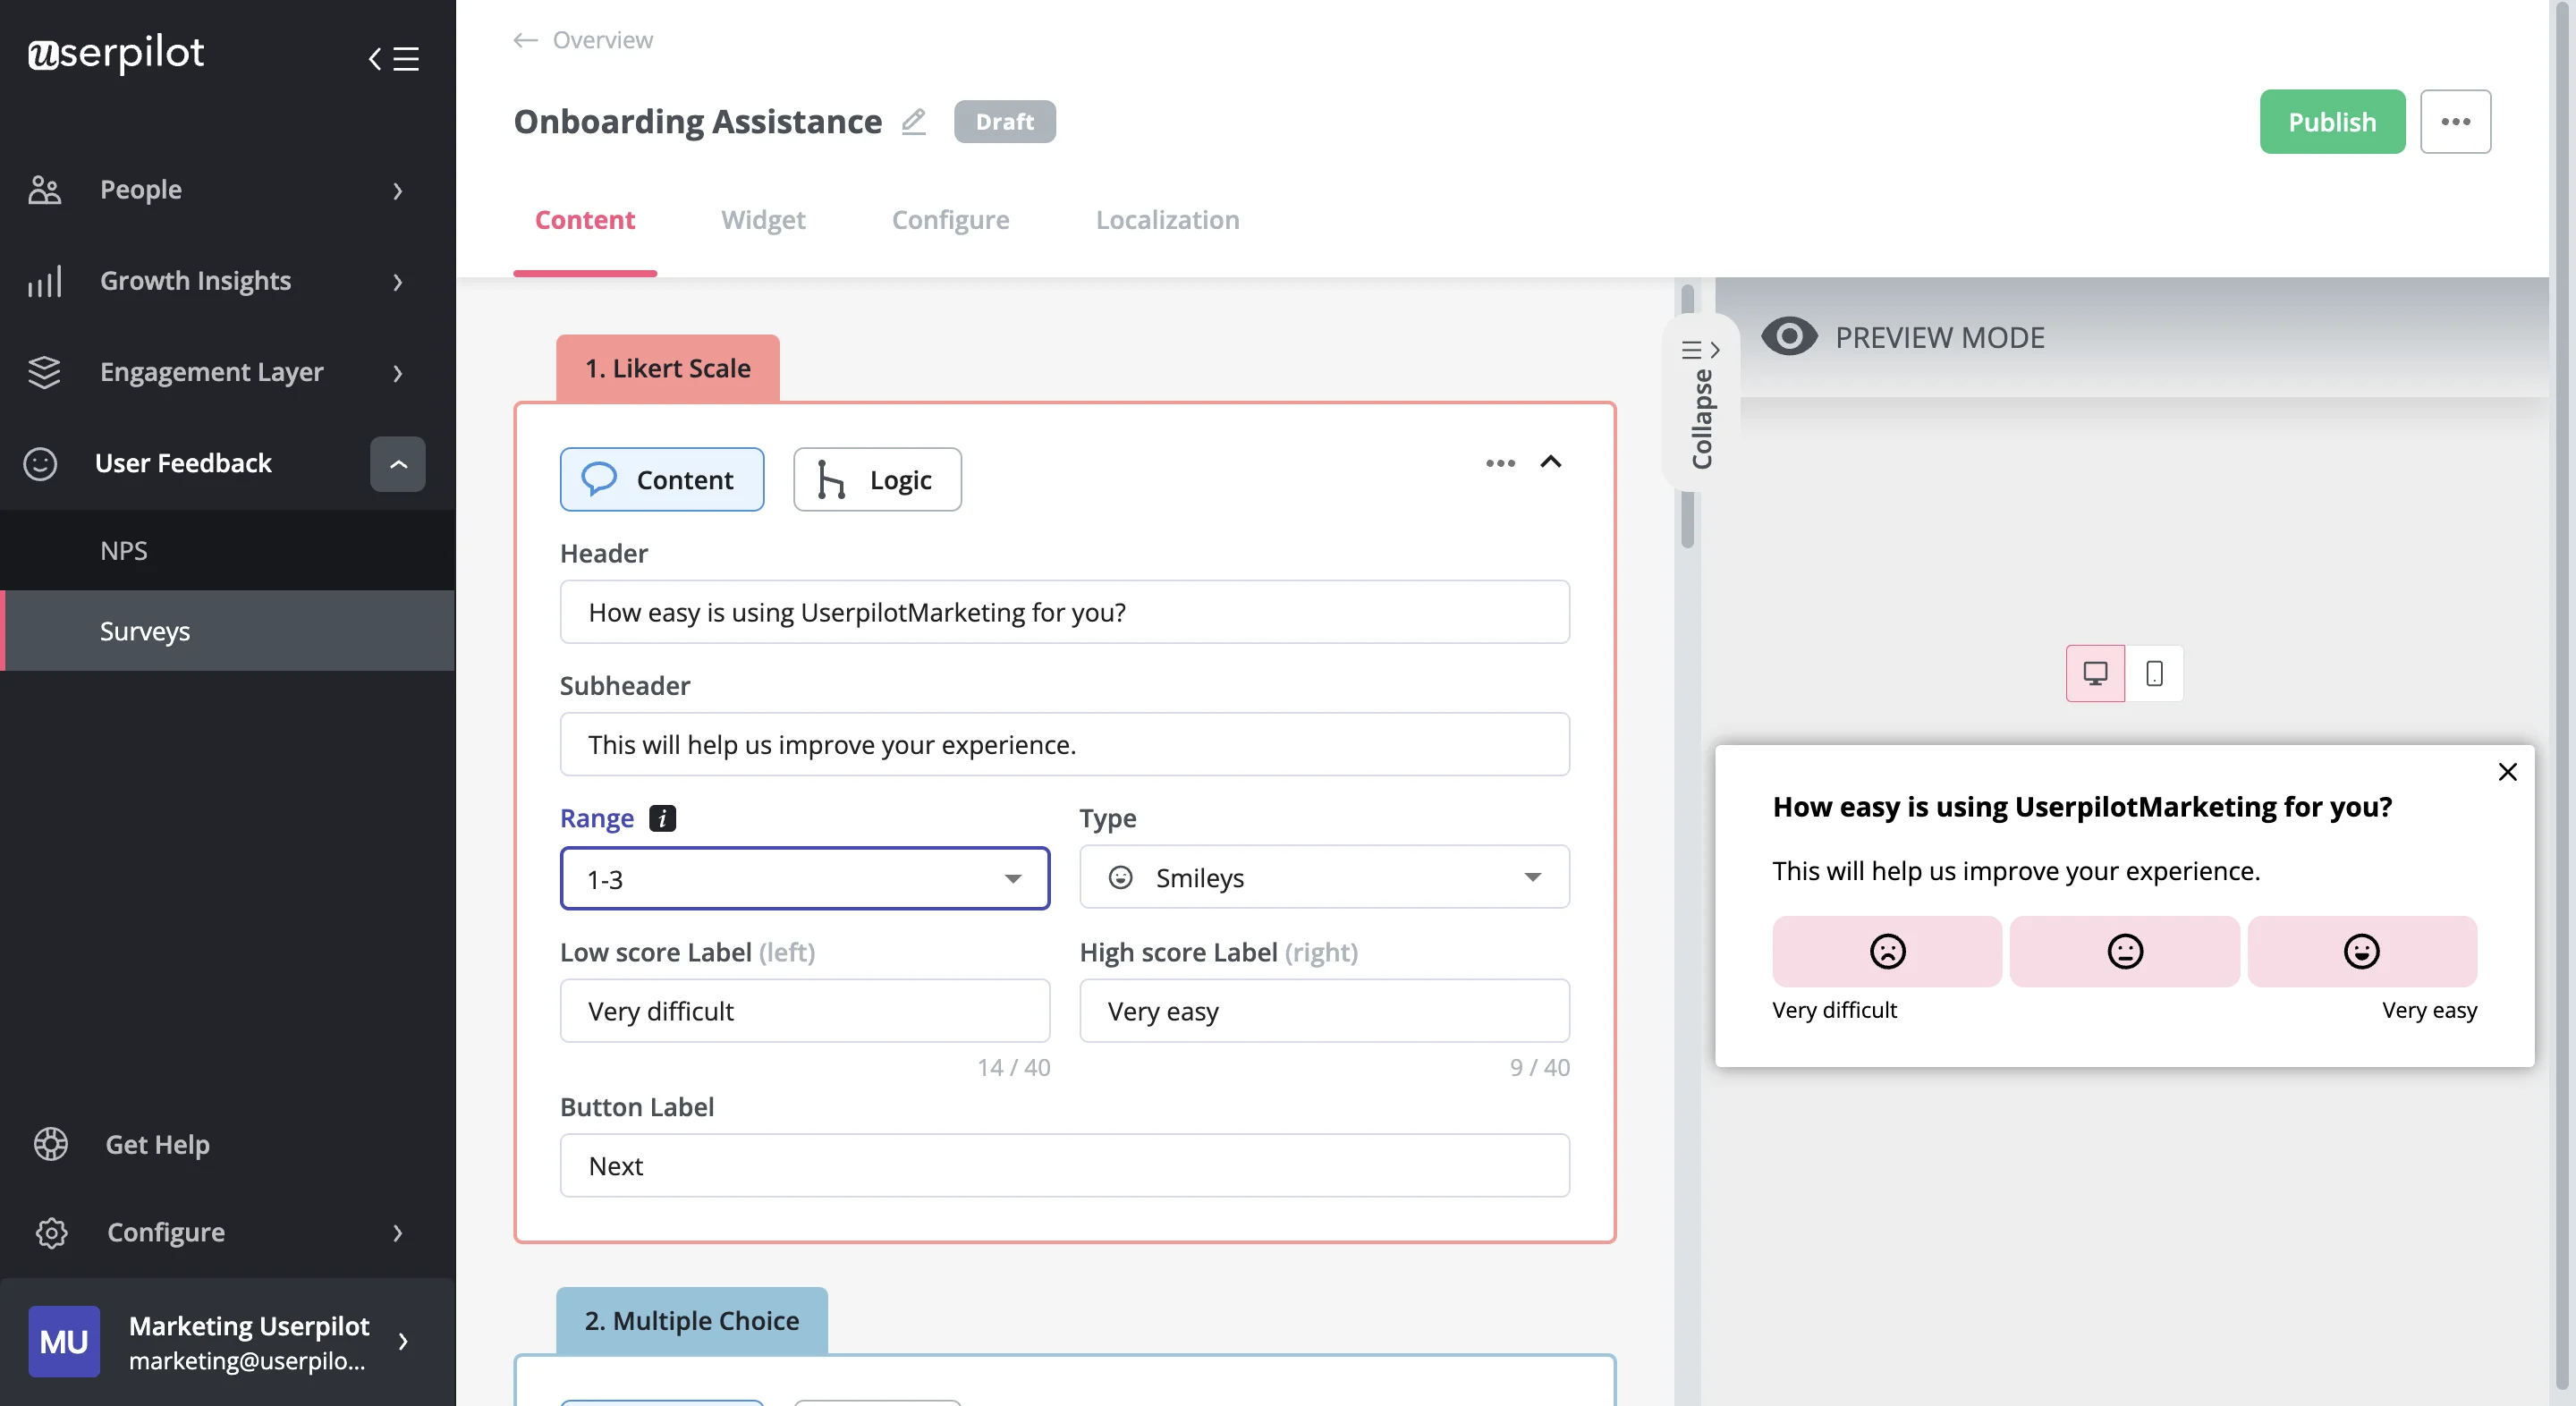
Customer Effort Score (CES) survey
Moreover, you can add a qualitative follow-up question to know where customers face friction and take measures to make it easier for customers to complete any activity. This will improve the customer experience and thus encourage customers to move from one stage to another in the customer journey.
Trigger NPS surveys to collect customer loyalty data
The NPS metric is a popular measure of customer loyalty. Net Promoter Score (NPS) surveys ask users how likely they are to recommend your product to friends and colleagues on a scale from 1 to 10.
The NPS scores allow you to segment customers into 3 groups:
- Promoters – They give a rating of 9 or 10.
- Passives – They give a rating of 7 or 8.
- Detractors – They give a rating of 6 or less.
Add a follow-up question to NPS surveys to collect qualitative data. This helps you understand why customers gave a particular score.
For instance, you can know why detractors are so dissatisfied with your product and personalize their user experience based on the responses to prevent churn. At the same time, you can replicate the experiences of your loyal customers, i.e., promoters, for other segments.

Segment customers to understand behavior patterns
Customer segmentation enables you to group customers based on their common characteristics. Userpilot’s advanced segmentation lets you divide customers based on several criteria, such as company data, events completed, and NPS scores.
You can identify behavioral patterns among customer segments and understand how the customer experience varies.
You can study the in-app behavior of power users and compare it with the behavior of other segments. For example, you can improve the user experience by replicating the power users’ experience among new users.

Identify friction points with a funnel analysis
Customer experience analytics provides valuable data for funnel analysis. Whether it’s a marketing, sales, or conversion funnel, you can understand how customers move down the funnel.
Funnel analysis reveals where customers experience friction and where they have a high tendency for churning. This allows you to drive more value for customers and increase product adoption rates.
Moreover, you can set up custom goals and track them to assess how customers progress through a funnel. This will help you adopt strategies that drive customers forward in their user journey.
The image provides a glimpse of the upcoming funnel analytics feature in Userpilot and shows you can leverage key performance indicators in funnel optimization.

Analyze customer feedback for actionable insights
The feedback you collect directly from in-app surveys is critical to understanding user sentiment and their expectations. Therefore, analyzing customer feedback helps you know your customers on a deeper level.
Look for patterns in feedback and close the feedback loop by responding to customers’ opinions accordingly.
Suppose you conducted an NPS survey to collect both qualitative and quantitative data. Analyzing the feedback will reveal detractors and point out specific reasons behind their dissatisfaction.
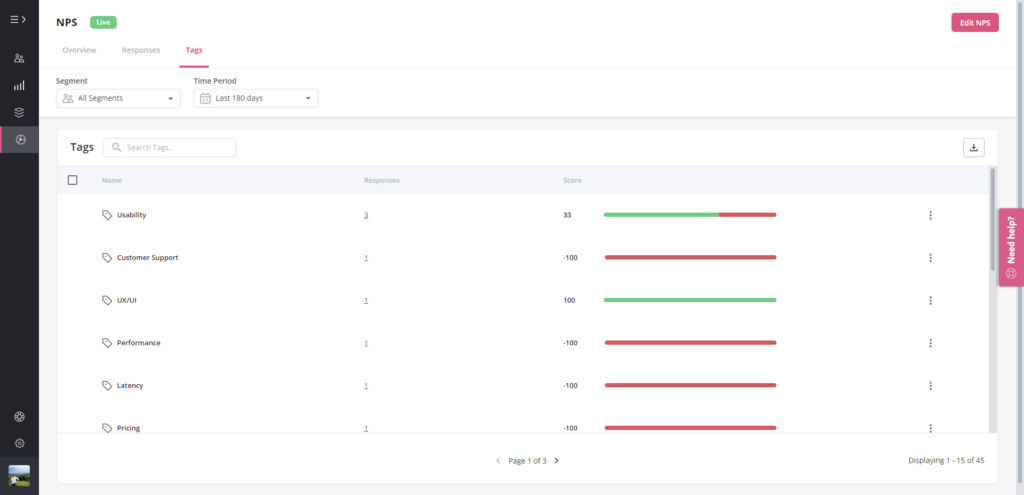
This is because you can tag the qualitative NPS responses to detect trends among the most common issues and see how they impact the overall experience. You can identify the weakest points of your product and make improvements on an urgent basis.
The image below shows that customers are the most dissatisfied with the product’s reliability, missing features, and price. These areas require immediate attention since customers are not getting the value they are paying for.
Important customer experience metrics to measure
CX analytics is incomplete without measuring the right metrics for customer experience. Let’s briefly look at them:
- Customer Satisfaction Score (CSAT): CSAT measures customer satisfaction with the overall experience with your product or the experience with a specific feature or user interaction.
- Customer Effort Score (CES): CES measures the ease with which a customer can complete an action in your product.
- Net Promoter Score (NPS): NPS is a measure of customer loyalty and the overall customer satisfaction level with your product.
- Customer Lifetime Value (CLV): CLV is the revenue stream you can expect to earn from each user over the period they are a paying customer.
- Retention rate: This is the rate at which customers return to make repeat purchases in a given period. The higher the customer satisfaction and loyalty, the greater the retention rate.
- Churn rate: This is the opposite of the retention rate. The churn rate is the rate at which you lose customers in a given period.
Best customer experience analytics solution for SaaS
Let’s go over the 3 best analytics tools that provide customer experience analytics solutions for SaaS companies.
Userpilot for in-app engagement and CX analytics
With its no-code interface, custom event tracking, in-app survey capabilities, and analytics functionality, Userpilot is a powerful product growth platform that enables CX analytics and boosts in-app engagement.
- Custom event tracking: Userpilot allows you to create custom and tracked events and monitor them to measure user engagement. You can use feature tags to collect customer data and track feature usage and feature adoption rates.
- In-app surveys: The platform lets you build a wide range of in-app surveys, including NPS, CES, and CSAT surveys. You can trigger these surveys to appear contextually to relevant user segments and perform customer feedback analysis.
- Analytics: Userpilot offers a powerful product analytics feature. Be it customer experience analytics, behavior analytics, or any other analytics, Userpilot offers actionable product growth insights and detailed reporting.
- Segmentation: Its advanced segmentation functionality comes with various contributing criteria like user ID, company, content engagement, features & events, etc. You can track product usage for each segment and tailor your strategies accordingly.

- Goal tracking and funnel analysis: Userpilot’s funnel analysis is a valuable feature for optimizing marketing campaigns and increasing conversion rates. Goal tracking lets you assess how customers progress across a funnel.
- Feature heatmap: The feature heatmap is a powerful data visualization tool for tracking user interactions with your product. You can use monitor clicks, hovers, and text inputs to learn what frustrates customers and improve user experience.

- Integrations: Userpilot offers a multitude of integrations with other analytics tools for additional insights, such as Amplitude, Google Analytics, Heap, and Mixpanel.
Hotjar for visualizing customer experience analytics
Hotjar is the best platform for visualizing experience analytics via heat maps and session recordings. You’ll find both click and scroll heat maps that highlight friction points and helps you make your web pages/app more engaging.
Session recordings are a real-life visualization of customer experience. Together with heatmaps, session recordings offer valuable insights into in-app customer behavior.

Mixpanel for advanced customer journey experience analytics
Mixpanel specializes in customer journey analytics. It offers 3 major types of analytics: path, funnel, and cohort analysis.
When used together, these analytics create a wealth of insights into how you can enhance user experience across the entire customer journey.

Mixpanel offers interactive reports that answer your queries and let you visualize data easily in seconds.

Conclusion
Each and every customer experience matters. Even a loyal customer may show poor engagement after a bad experience. Hence, CX analytics is critical to meeting and even exceeding customer expectations and driving superior value.
Want to get started with customer experience analytics? Get a Userpilot demo and collect actionable product growth insights.

