This site uses cookies to improve your experience. To help us insure we adhere to various privacy regulations, please select your country/region of residence. If you do not select a country, we will assume you are from the United States. Select your Cookie Settings or view our Privacy Policy and Terms of Use.
Cookie Settings
Cookies and similar technologies are used on this website for proper function of the website, for tracking performance analytics and for marketing purposes. We and some of our third-party providers may use cookie data for various purposes. Please review the cookie settings below and choose your preference.
Used for the proper function of the website
Used for monitoring website traffic and interactions
Cookie Settings
Cookies and similar technologies are used on this website for proper function of the website, for tracking performance analytics and for marketing purposes. We and some of our third-party providers may use cookie data for various purposes. Please review the cookie settings below and choose your preference.
Strictly Necessary: Used for the proper function of the website
Performance/Analytics: Used for monitoring website traffic and interactions
According to the American CustomerSatisfaction Index , with an ACSI score of 78.0, overall customersatisfaction in America was the highest it has ever been in Q1 2024. However, while some companies have managed to improve their customersatisfaction levels and benefit from it, many have not.
In addition to NPS, you can create other types of surveys from scratch or choose from various templates, covering customersatisfaction ( CSAT ), feedback forms, and more. Qualaroo is a powerful in-context survey tool designed to help you gather feedback directly from users as they interact with your brand on any channel.
Without effective UX analytics that goes beyond collecting data, you’re losing valuable customers. Unfortunately, the research backs this up, with a staggering 90% of usersreporting that they stopped using an app due to poor performance. Basically, anything that ruins the user experience.
These missing insights are crucial for understanding customer needs and expectations. Without a comprehensive view, businesses risk losing opportunities to improve customersatisfaction and build long-term loyalty. By analyzing customer comments, heatmaps, and targeted feedback requests, they can identify specific problem areas.
Joining us is returning guest, Carmel Dibner, who is a principal and co-owner at Applied Marketing Science (AMS), where she has helped companies uncover critical customer insights to improve products, services, and customer experiences.Before moving to consulting she was in brand management at Unilever.
In reality, UX is multidimensional, and it requires multiple qualitative and quantitative metrics like task success rate, usersatisfaction score, and summary of user reviews. Self-reported data is alwaysreliable Many organizations believe that the best way to learn about users is to ask them directly.
Online review tools : Tools that help you collect, manage, and showcase customer reviews to build credibility and enhance your online reputation. Social listening tools : Software for monitoring online conversations, brand mentions, and trends.
Improved user retention: Tracking behavioral segments over time enables us to monitor product performance metrics that highlight retention patterns. For example, we can spot when a cohort’s engagement dips, diagnose the root causes, and launch targeted campaigns, like re-engagement emails , to boost customersatisfaction and brand loyalty.
1 Engagement DAU/MAU Understand daily and monthly active user engagement and overall app popularity. 2 Engagement Feature adoption Gauge user interest in new features and optimize feature development. 3 Engagement Average user session length Measure user interactions and identify areas for improved content or flow.
Theyve consistently outperformed their counterparts, reporting significantly higher metrics across operational efficiency (81% vs. 58%) , revenue growth (77% vs. 61%), and employee satisfaction (68% vs. 39%). Visualization: Presenting data through intuitive charts, dashboards, or reports. How is this possible?
Monetization potential: If users spend significant time within your app but dont convert, that might indicate that your pricing or checkout flows need rethinking. Measure usersatisfaction : Metrics like session length and frequency of use evaluate if users are happy with the app experience.
When customizing insights for this group: Keep it brief and outcome-oriented. Highlight risks to revenue, customersatisfaction, or timelines. Example: âThis integration issue has already delayed one customer pilot. reported crashes after selecting a payment option. Use simple, direct language without jargon.
This resource allocation reflects a fundamental truth: understanding and optimizing the current user experience often yields more substantial results than the constant introduction of new, unvalidated features. This striking statistic illustrates the potential impact when growth decisions are grounded in robust user research.
Companies are now focusing on creating vast knowledge bases filled with resources that customers can easily navigate. By providing rich, curated content, businesses enhance customersatisfaction and enable customers to feel more in control of their journeys.
How to plan, conduct and report usability studies. It doesn't matter whether we’re talking about a website, mobile app, AI assistant, AR/VR or other wearable technology; you need to test with users. And if your users find it difficult to use, they might simply give up in frustration.
Resource centers (in-app): are embedded in your product to deliver contextual help when users need it. It typically includes features like interactive walkthroughs that help UX designers and marketing teams improve customersatisfaction, drive feature adoption, and reduce time spent on routine customer requests.
In action, customer research in SaaS could look something like examining support tickets to uncover recurring issues or feature requests , like consistent asks for better reporting features. Does customer research help build better products? For example, 71% of customers now expect far more personalization than before.
App discovery: Duolingo and Calm This stage aims to get on your prospective customers radar often enough that they tap on your store listing or look for your app. The brand posts TikToks and funny memes frequently, a cadence that lands regular press hits and keeps the mascot trending. Example of Streaks showing a progress report.
During this phase, I track metrics like task completion rate, error rate, and usersatisfaction score. This method quickly reveals whether key elements, like calls to action or branding, are immediately clear. Session recordings : I rely on session recordings to capture user interactions over time.
Surveys: In-app surveys pop up after users complete specific actions. The timing matters: I've found out that customersatisfaction surveys , such as CSAT, CES, or NPS , work best right after users complete a key workflow when they're feeling successful. Funnel reports in Userpilot. The results came fast.
Adoption Meter to track user moods and understand how users feel about your product or feature. NPS surveys for measuring usersatisfaction and gathering insights for improvement. Decent targeting options using user segmentation and behavioral triggers. Monitor real-time user engagement.
Include a link for easy access, encouraging users to share their thoughts or report any issues. Bug Fixes Template Example Listing bug fixes is a simple way to build trust and show users youre serious about reliability. By acting on customer feedback , you can ensure that reported issues are addressed quickly and transparently.
Customers who actively connect with your brand are more likely to stay loyal, spend more, and become advocates. That’s where customer engagement software comes in. The right platform will equip you with the tools to interact effectively, gather valuable feedback, and build lasting customer relationships.
Average content (articles, soundscapes, or programs) consumption per user. Armed with these numbers, you can proceed to create a targeted engagement strategy that fuels business success and enhances usersatisfaction. How do app users interact with it from the moment they download it and beyond?
We examine both quantitative gains — such as higher customersatisfaction scores, rising self-service usage and digital adoption rates — and qualitative developments, including more personalized services, smarter virtual assistants and greater accessibility in digital banking. This indicates significant interest in the sector.
E-commerce has completely changed the way shoppers interact with their favorite brands. From the continued rise of mobile commerce to virtual-reality try-on tools and AI customer service, some consumer trends have proven to be evergreen while others fall out of fashion in a season. Based on feedback from 4,000 consumers across the U.S.,
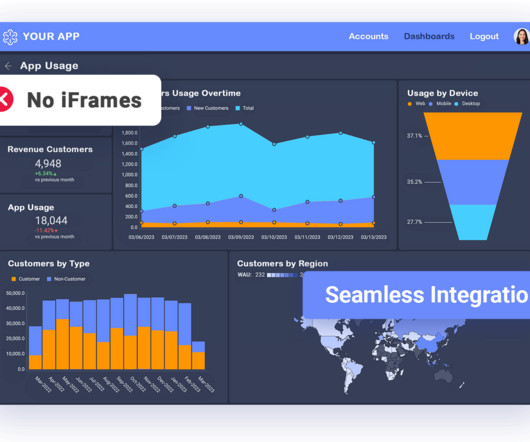
It blends into your app, scales with your architecture, and reflects your brand without adding overhead. Key Takeaways Legacy BI tools weren’t built for modern, in-product experiences —they live outside the workflow, creating friction, slowing decisions, and limiting user engagement. Why Legacy BI Fails Inside Modern Products?
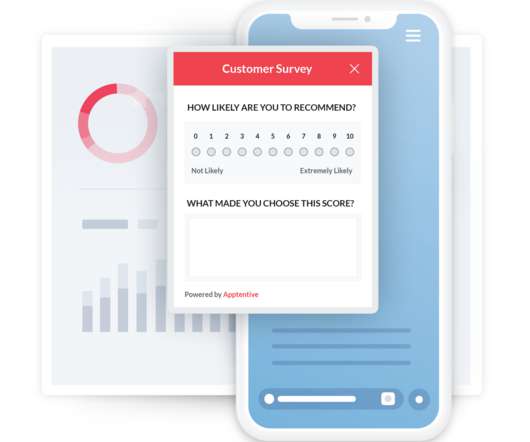
Here are 3 methods that help you collect data and bring that conversation to life: Use mobile surveys to gather customer feedback Mobile surveys are a quick way to measure customersatisfaction, gather real-time feedback, and boost engagement. How to collect customer feedback on mobile apps with Userpilot?
Whether you’re measuring customersatisfaction, checking in with employees, or researching new markets, knowing how and when to use surveys can make all the difference. Think customersatisfaction scores, employee engagement levels, or demographic profiles. So, which software is best for surveys?
Embracing customersatisfaction survey best practices is critical to driving business growth. You’ll consistently generate quality feedback and see how to act on them to improve the user experience. This, in turn, will motivate users to stay with your brand, driving long-term loyalty and retention.
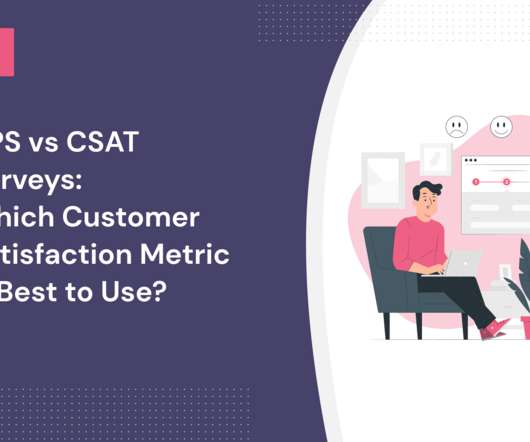
NPS vs CSAT surveys: which is better for measuring customersatisfaction? The short answer is both since each method analyzes customer loyalty but at a different depth. So, let’s break it down and study what method is best for measuring user sentiment and why. Measures and improves customer loyalty.
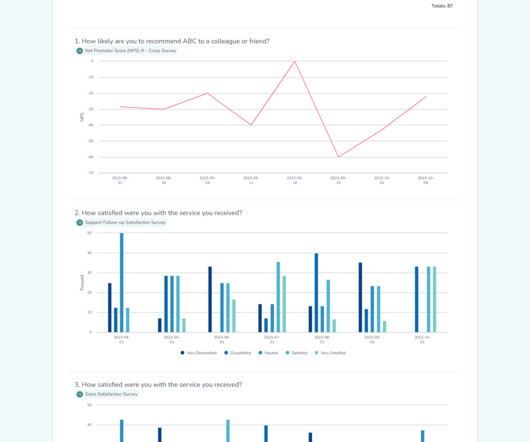
By combining questions and reports from different surveys, you can view feedback across touch points, timeframes, and audience segments within a single report view. Alchemer Survey has always made it easy to create customizable reports to analyze and share results. Learn more by viewing our help documentation.
Reveal Embedded Analytics The critical role of customersatisfaction in today’s hyper-competitive, data-centric world is unequivocal. It’s not merely an indicator of customer loyalty; it’s an indicator of your business’s trajectory. But in the customersatisfaction area specifically, it does wonders.
Customer experience (CX) is central to product management and the success of your SaaS platform. It can help retain customers and gain loyal brand advocates. And that’s why the customer experience software solutions you choose matter greatly. Here are the features you can use to boost customer loyalty.
They also present a valuable opportunity to collect user feedback on a range of topics, from brand sentiment to user experience, using mobile app surveys. To increase response rates, data accuracy, and usersatisfaction, make sure not to interrupt your users at inconvenient or bothersome moments.
Now, it might sound like common sense to say, “just retarget your customers to boost engagement,” but let’s break down what this actually means. The concept of retargeting mobile customers is not a new idea by any means, but few brands practice it successfully. But the magic happens when you track these data points over time.
According to our latest NPS benchmark report, the average NPS in SaaS is 35.7. NPS is important because it correlates with customersatisfaction , positive word-of-mouth , and loyalty, essential for product growth. According to our benchmark report that pulled data from 229 B2B SaaS companies, the average NPS is 35.7,
Every customer has unique preferences, tastes, likes, and dislikes. Intuitively, customer individuality makes perfect sense. Yet at the end of the day, many brands know little about their customers on an individual, human level. How can you prevent them from ditching your brand for a compelling alternative?
According to one Microsoft Global State of Customer Service report , 90% of consumers surveyed said that customer service is an important factor in their choice of, and loyalty to, a brand, while nearly two-thirds (58%) would sever their relationship with a business due to poor customer service. Ease of use (66%).
When you invest time and energy into understanding your customers on an emotional and individual level, you gain a competitive advantage that is unique to your business and marketplace. And consumers want to hear from the brands they use— 51% expect companies to ask them for feedback directly. . CustomerSatisfaction (CSAT).
Today, numerous studies echo this sentiment: a recent report from Forrester found that brands with a superior customer experience bring in 5.7 And a recent study from Deloitte found that two-thirds of customers will switch brands entirely due to a poor customer experience.
It’s no secret that when it comes to support, customer expectations are higher than ever before – but how are support leaders and teams adapting to these increased demands? Nearly two-thirds (58%) would sever their relationship with a business due to poor customer service. And if their support expectations aren’t met?
Brands also expanded the number of people they prompted to answer surveys to 25% of their consumers. Customer research: You’d like to better understand the demographic of customers who continue to use your app 20, 30, or even 40+ times. The more consumers you hear from, the more holistic your feedback will be.
TL;DR Negative word of mouth is the spreading of unfavorable or critical information about a product, service, brand, or company through informal communication channels, such as personal conversations or online platforms. Impacts of negative word of mouth may include: Customer churn. Decreased customersatisfaction.
We organize all of the trending information in your field so you don't have to. Join 96,000+ users and stay up to date on the latest articles your peers are reading.
You know about us, now we want to get to know you!
Let's personalize your content
Let's get even more personalized
We recognize your account from another site in our network, please click 'Send Email' below to continue with verifying your account and setting a password.


Let's personalize your content