How To Effectively Measure Customer Experience & What To Do To Improve It?
Most probably you already know how important it is for a brand to offer superior experiences, but how exactly can you measure customer experience?
Something as abstract as customer experience cannot be measured directly. Instead, you need to track the factors related to it to understand how well your offering can convert new users to loyal customers.
In this article, we will cover the customer experience metrics that reflect users’ perceptions of your brand and how you can improve their experience.
TL;DR
- Customer experience is customers’ overall impression of your brand across different stages of the user journey.
- You need to measure customer experience to understand user interactions, build strong customer relationships, and remove friction points.
- The 10 key customer experience metrics are customer satisfaction score, customer effort score, net promoter score, customer health score, first contact resolution, average resolution time, customer lifetime value, retention rate, churn rate, and referral rate.
- Here are some actionable strategies that can help you improve customer experience:
- Track customer interactions and segment them based on shared characteristics.
- Trigger personalized experience flows based on user behavior.
- Offer in-app self-service support to unlock on-demand support.
- Send microsurveys across multiple touchpoints to collect feedback.
- Follow up with detractors and try to solve the issue before they churn.
- Reward loyal users and make them brand advocates.
What is customer experience?
Customer experience (CX) is your customers’ overall impression of your brand across different stages of the customer journey.
Why should you measure customer experience?
32% of people worldwide would leave a brand they love to use after only one poor experience. The importance of measuring user experience is highlighted even more by the fact that it’s between 5 and 25 times less costly to retain an existing customer than to acquire a new one.
Here are 3 key reasons, why you should measure customer experience:
Understand customers on a deep level and build stronger relationships with them
Measuring customer experience lets you know more about your user base. This helps you strengthen customer relationships, making them more likely to stick to your product. Understanding customers’ unique needs and fulfilling them will help you turn certain customers into loyal brand advocates.
Identify how customers interact with the product throughout the customer journey
Customers engage with your brand at different stages of the user journey, and CX metrics help you track the footprint they leave behind. You can use a customer journey map to visualize how users interact with your business across different touchpoints.
Uncover friction points that impact the customer experience
Measuring customer experience helps you identify the bottlenecks that negatively affect the user journey. Address these areas to make their journey as frictionless as possible and improve their experience.
10 most important customer experience metrics to measure CX
Here are the 10 key CX metrics that can help you measure customer experience.
- Customer Satisfaction Score (CSAT)
- Customer Effort Score (CES)
- Net Promoter Score (NPS)
- Customer health score
- First Contact Resolution (FCR)
- Average Resolution Time (ART)
- Customer Lifetime Value (CLV)
- Retention rate
- Customer churn rate
- Referral rate.
Customer Satisfaction Score (CSAT)
The customer satisfaction (CSAT) score tracks how happy users are with your product, service, or a specific interaction, such as requesting help from your support team.
A CSAT survey asks users how satisfied they are with their experience on a scale. This scale could range from 1-5, 1-7, or even 1-10, depending on how abstract you think the experience is.
To calculate the CSAT score, divide the number of positive responses by the total responses, and multiply the ratio by 100.

Measuring CSAT scores at multiple touchpoints across the user journey will help you gauge users’ overall satisfaction with your product.
Although CSAT benchmarks differ by industry, a good CSAT score generally lies between 75% and 85%. In 2022, the benchmark for computer software was 79%, which means 79 out of every 100 users gave you a positive score.
Customer Effort Score (CES)
The customer effort score measures the effort a customer needs to give to interact with your brand.
CES surveys ask users how much they agree with a statement on a scale from ‘strongly disagree’ to ‘strongly agree’. They are sent right after a user completes an action inside your product, like reading an article to reaching a milestone.
Measuring CES lets you discover the problem areas that you can resolve to reduce friction and improve customer experience. To calculate the metric, divide the number of ‘agree’ responses by the total responses, and multiply the result by 100.
The customer effort score does not have any definitive average in the SaaS industry. However, if your survey scale uses 1 for minimum effort and 7 for maximum effort, a CES of 3 suggests users don’t face significant challenges.

Net Promoter Score (NPS)
The Net Promoter Score is a measure of customer satisfaction and loyalty. It asks how likely users are to recommend your product to others on a scale from 1 to 10.
The NPS metric gives you three segments of customers:
- Promoters: customers who give you a score of 9 or 10.
- Passives: customers who give you a score of 7 or 8.
- Detractors: customers who give you a score of 6 or below.
To calculate your NPS, subtract the percentage of detractors from the percentage of promoters.

While it’s unlikely to reach the extremes, your NPS should always be above 0 so that you have more promoters than detractors.
The NPS benchmark for the software and apps industry is 41. However, it’s more important to focus on understanding what your users want and offering guidance and help.
NPS insights help you better understand what makes your users happy so that you can make improvements to your product and onboarding accordingly.
Customer Health Score
The customer health score measures the likelihood of a user staying consistent, growing, or churning. It helps customer success leaders predict how the brand’s relationship with a customer will change over time.
Tracking customer health scores and responding according to the insights help you predict how the brand’s relationship with a customer will change over time.
To calculate the customer health score, you first need to segment your customers into groups such as power users and new users. Define each segment carefully and determine the set of actions that users in the segment need to complete to get their jobs done.
Then, assign an impact score to each action on a scale from 1 to 10 based on its importance to the user persona and your product. Monitor the action frequency over an x number of days and calculate each total action value by multiplying the impact score by the frequency.
The customer health score would be the aggregate of all the total action values.

You should try to keep your customer health score above 70. Here’s what the numbers mean:
- A negative score = very sick (most likely to churn)
- 1-40 = sick
- 41-70 = is somewhat healthy
- A score between 71 and 100 = very healthy
- A score above 100 = thriving (power users)
First Contact Resolution (FCR)
The First Contact Resolution rate is a measure of the percentage of total customer queries that are resolved on first contact. Resolving a support ticket improves the success rate for cross-selling by 20%, which in turn, helps boost your expansion MRR.
FCR is equal to the ratio of customer queries resolved on first contact to the total requests completed.
Most reports show that the average FCR rate for the SaaS industry is between 70% and 75%, meaning that about a quarter of all tickets gets resolved on the first attempt. The best way to increase FCR is by improving your customers’ experience with customer service.

Average Resolution Time (ART)
The Average Resolution Time (ART), also called the Mean Time to Resolution (MTTR), is the average time taken by an agent to conduct and close a live chat after successfully resolving a case.
Thus, the ART formula is the sum of all times to resolution divided by the total number of cases resolved.
This metric reflects the efficiency of your support team and can have a direct impact on user satisfaction. A low ART means that customers don’t have to wait for long to get their issues resolved, preventing them from getting frustrated with your product.
The average ART in the SaaS industry is between 12 hours and 48 hours. However, it is recommended to maintain a good average resolution time of 12 hours or less.

Customer Lifetime Value (CLV)
The Customer Lifetime Value (CLV) is the revenue a business can earn from one user over the duration they are a paying customer.
Because SaaS business models run on repeat purchases, CLV’s predictive ability help you project revenues from each customer and determine future investments. The longer you can retain customers, the higher your CLV will be.
To measure CLV, divide the average revenue per account by the customer churn rate.
CLV is usually compared with the customer acquisition cost to check whether your business is financially easy. A good CLV: CAC ratio is 3:1, meaning your CLV should be 3 times that of the amount you spend on acquiring new users.

Customer Retention Rate
The retention rate measures your product’s ability to convert new users into repeat customers. User retention increases when more customers find your product valuable enough to stay with it in the long run.
As mentioned before, it costs less to retain existing customers than to acquire new ones. Furthermore, increasing the retention rate by 5% can boost your revenue by 25-95%.
According to a Mixpanel report, the average monthly retention rate for SaaS businesses is 92-97%.
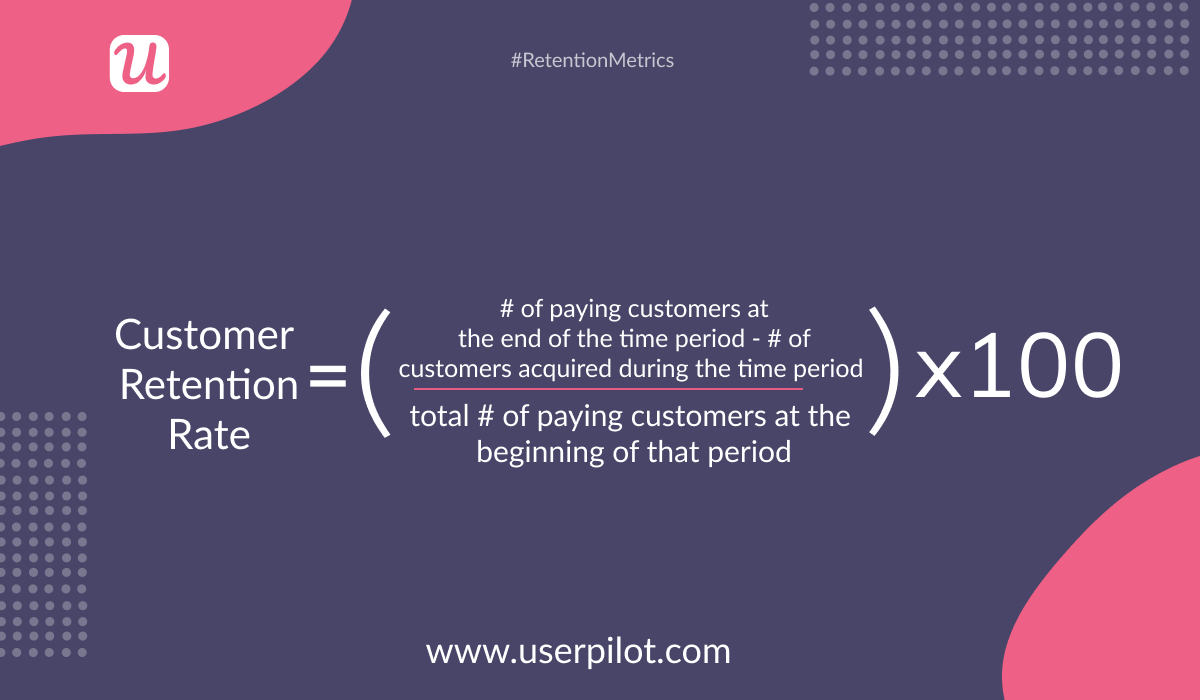
Customer retention rate calculation formula.
Customer Churn Rate
The churn rate is the percentage of customers who cancel or downgrade their subscription plan during a specific period.
To measure the churn rate, divide the number of churned users during a given period by the number of customers present at the start of that period, and multiply the ratio by 100.
Tracking the churn rate helps you prevent churn, which translates to higher LTV. A low churn rate greatly improves your company’s revenue.
While there’s no universal churn rate to fit all companies, a typical good annual churn rate is 5-7%.

Referral Rate
The referral rate is the ratio of the number of referred sign-ups/subscriptions to the number of total subscriptions.
A Nielsen research found that 83% of people follow word-of-mouth recommendations from their family and friends. The more customers refer your product to others, the more your revenue is likely to grow.
The 2022 average referral rate for the software industry is 4.75%.
How can customer journeys make CX metrics more actionable
Remember when we talked about customer journey maps earlier? Customer experience should be measured across all touchpoints in a user’s journey, and this is where a map helps you track KPIs at the right places.
For instance, to get the most actionable insights from customer satisfaction metrics, monitor them right after major goals are completed. These goals include purchasing a product, resolving an issue, engaging with a new feature, or canceling a subscription.
A user journey-based approach helps you understand why customers use a product, know why they switch channels and predict how likely they are to achieve their goals. You can then identify customer pain points and know what exact actions to take to enhance the customer experience.
6 surefire ways to improve customer experience and drive customer loyalty
Now let’s see how you can improve customer experience.
Track in-app user behavior and group customers into segments
Tracking user behavior helps collect data on their interactions inside your product.
Userpilot lets you tag features to provide an overview of your least and most used features. You can even track interactions like hovers, clicks, and text inputs.

Use the data collected to segment customers based on specific shared characteristics. Userpilot’s smart segmentation functionality helps you to group customers, according to several criteria, as shown below.

Trigger contextual experience flows based on user behavior and engagement
Use the insights on user behavior and track event occurrence to trigger personalized experience flows.
This ensures that the in-app prompts arrive at the right time and are hyper-personalized to suit each use case. It helps you boost engagement by driving more value for customers.

Create an in-app help center to enable self-service support and reduce the average resolution time
Resolving customers’ issues quickly can make a user 2.4 times more likely to make repeat purchases. This is where self-service support helps the most by allowing customers to solve their own problems without any frustration.
Create a 24/7, fully-functioning in-app help center that offers on-demand customer support. It will not only reduce the average resolution time but also decrease the number of support tickets. Support agents can then focus on more pressing issues.

Send microsurveys to collect customer feedback across different stages of the user journey and act on
Create microsurveys such as CSAT, CES, and NPS surveys to collect user feedback and measure customer experience metrics. Send them across different stages of the customer journey after key interactions.
With Userpilot, you can create a wide range of microsurveys. Close the feedback loop by sending automated responses to customers and proactively offer solutions.
Here are some surveys by Hotjar.

Follow up with NPS detractors and proactively reach out to them to avoid churn
One of the most effective ways of reducing churn is following up with detractors.
Add a qualitative follow-up question to NPS surveys to understand the reason behind each score. Apply response tagging to see why you’re getting low scores.

Then segment customers based on user feedback to identify detractors who are at high risk of churning. Personally, reach out to detractors as shown below and convert them to passives and even promoters.

Acknowledge loyal customers and reward them to keep motivated
Loyal customers are the most valuable assets to your business. They are your happy customers and can drive your word-of-mouth marketing, provided you keep them motivated.
Thus, you should reward them for their loyalty and appreciate them every time they leave a positive review. This improves their experience and boosts retention.

Wrapping it up
Measuring customer experience is extremely important if you want to understand whether you meet customer expectations and what you can do to even exceed those.
Keep an eye on all CX metrics, discussed above, identify the issues and solve them before it’s too late.
Want to collect invaluable customer data and measure customer experience? Get a Userpilot demo and improve customer experience code-free.

