14 Essential Product Health Metrics to Track in SaaS
Do you know which product health metrics to track to achieve long-term success for your SaaS business?
The right metrics and data will offer valuable product growth insights to help you make data-driven decisions about optimizing your products’ performance.
This article will delve into the 14 key product health metrics you should track and analyze for your products.
Let’s start!
TL; DR
- Product health metrics are the key performance indicators that measure a product’s performance and success.
- Tracking these metrics helps you gain growth insights, track user engagement, and measure customer satisfaction.
- Conversion rate measures the percentage of users performing the desired action.
- Customer acquisition cost estimates the cost of acquiring a new customer to optimize customer marketing efforts.
- Lifetime value determines revenue potential from each customer.
- Monthly recurring revenue tracks expected revenue from all active subscriptions to understand business health.
- Expansion monthly recurring revenue assesses revenue generated from upgrades and add-ons.
- The retention rate measures the percentage of paying users retained over a period.
- Product onboarding engagement rate measures the percentage of newly engaged users who actively complete the onboarding process.
- The product activation rate determines the number of users successfully activating their accounts.
- Feature usage rate calculates the percentage of users repeatedly using important product features.
- The feature adoption rate represents the percentage of users who adopt a feature.
- Stickiness is the ratio of daily active users to monthly active users.
- Net Promoter Score (NPS) asks customers about their likelihood to recommend your product on a scale from 1 to 10.
- Customer satisfaction score (CSAT) measures satisfaction with a specific product or interaction.
- CES, or customer effort score, quantifies the level of effort a customer needs to interact with your product.
- Userpilot is the best platform to measure product health metrics for its multiple features to collect data, tag specific features, analyze product engagement, and create and send microsurveys to measure customer satisfaction.
What are product health metrics?
Product health metrics are the key performance indicators (KPIs) that product managers track to measure their products’ overall performance and success. These product metrics provide valuable insights into your product’s performance in various aspects and help identify areas for improvement.
Product growth metrics to gain growth insights
Here are some growth metrics your product team should track.
Conversion rate
The conversion rate refers to the percentage of users who take a desired action on your product. It helps you understand how your product is doing in terms of achieving its desired outcomes.
SaaS businesses track conversion rates for various cases:
- Website conversion rate to a free trial or demo to measure the effectiveness of marketing efforts
- Free trial to activation stage conversion rate to gauge the success of getting users to engage with the product.
- Freemium or free trial to paid conversion rate to understand the effectiveness of your strategies and pricing models to increase paid subscribers.
To calculate the conversion rate, divide the number of conversions by the total number of users of a cohort.
Customer acquisition cost (CAC)
CAC, or customer acquisition cost, is the average cost of acquiring one new customer. It is one of the key performance indicators for any product marketing team since it shows how much return marketing efforts bring in.
This metric helps you compare costs across different marketing channels and campaigns. Leveraging this data will help you forecast future revenue and expenses by estimating the CAC. Furthermore, it allows you to optimize future marketing budgets and maximize the ROI of product marketing resources.
You need to divide the total cost of sales and marketing by the number of new customers acquired to calculate CAC.

Customer lifetime value (CLV)
CLV, or customer lifetime value, is the amount of revenue you may expect to earn from each user while they are paying customers.
You should understand CLV to get an idea of your business growth. Then you should estimate it for different customer segments and prioritize the segments with the highest potential average customer lifetime value. As a result, generating more revenue and achieving long-term success becomes feasible.
This metric also helps you make informed strategic decisions about which markets to expand into or products to focus on.
You should divide the average revenue per account (ARPA) by the churn rate in a specific period to calculate CLV.

Monthly recurring revenue (MRR)
MRR, or monthly recurring revenue, is a critical product metric for subscription-based SaaS businesses. It refers to the expected revenue from all the active subscriptions each month.
MRR is more than just a calculation; it helps you understand your business’s health, growth potential, and future profitability. By tracking changes in MRR over time, you can identify whether your business is growing, stagnating, or even declining.
To calculate MRR, multiply the average revenue per user (ARPU) by the number of accounts in a month.

Expansion monthly recurring revenue rate
The expansion monthly recurring revenue (MRR) is the revenue generated from upgrades and add-ons in a given month.
It indicates the growth rate of your business by assessing the effectiveness of your customer retention and loyalty initiatives. Moreover, it measures the success of your upsell and cross-sell strategies by tracking expansion revenue generated by repeat customers.
To calculate expansion MRR, find the difference in expansion MRR at the beginning and end of the month. Then divide the difference by the expansion MRR at the beginning and multiply it by 100.

Retention rate
The customer retention rate is the percentage of paying users you retain in a given period, usually a month or a year. It’s a key product health metric for user growth, as improving it helps you increase retained customers and boost revenue.
It is the opposite of churn rate but interchangeable because they provide insights into the effectiveness of your retention efforts.
You need to divide the number of paying users at the end of a period by that of the beginning of the period. Then, multiply the ratio by 100 to get the retention rate percentage.

Product engagement metrics to track user engagement
Let’s look at the critical product health metrics that help you track user engagement.
Product onboarding engagement rate
It’s not enough to just have a great onboarding flow. You also need to measure its effectiveness through the product onboarding engagement rate, which measures the percentage of newly engaged users who actively complete the onboarding process.
This product health metric helps you identify the most effective onboarding strategies and how to utilize them better. It also determines the impact of changes to the onboarding process after implementing improvements.
To calculate the product onboarding engagement rate, measure the onboarding completion (goals/checklist) rate.

Product activation rate
The product activation rate is the number of users who successfully activate their account or access a key product feature.
It helps you make informed strategic decisions on where to focus your efforts and allocate resources accordingly. Additionally, you can develop targeted additional activation support by understanding which user segments are struggling with activation. The data will also be useful for prioritizing features requiring improvement.
You need to determine the number of users who complete activation goals to calculate the product activation rate.

Feature usage rate
The feature usage rate is the percentage of users repeatedly using your important features. It helps you determine the underused features and functionalities and work on encouraging more usage of them.
You can also use it for measuring the impact of new feature releases or product enhancements. Use the data to compare the historical feature usage rate with the rate after implementing the new features. You will then understand the effectiveness of your product enhancements and identify areas for improvement.
Calculate the feature usage rate by dividing the number of feature MAU by that of user logins in that period. Then multiply the ratio by 100.

Userpilot takes it a step ahead by letting you tag features and measure usage, that too without any coding knowledge.

Feature adoption rate
The feature adoption rate refers to the percentage of users who have adopted a feature based on the feature adoption funnel developed by Justin Butlion. This funnel helps you track the user journey from first awareness of the feature to the actual adoption.

This metric further offers you a clear picture of the effectiveness of your features and how well your target audience values them.
You need to calculate the 4 stages separately to calculate the feature adoption rate.
- Exposed: (number of users who have come in contact with a feature/total number of users) x 100.
- Activated: (number of users who activated the feature/number of exposed to the feature) x 100.
- Used: (number of users who used the feature at least once/ number of activated users) x 100.
- Used Again: (number of users who used the feature more than once/number of users who used the feature at least once) x 100.
Stickiness: Daily active users to Monthly active users ratio
In SaaS, stickiness refers to the ability of a product to keep its users engaged and come back over a period. It is basically the ratio of daily active users (DAU) and monthly active users (MAU).
The stickiness ratio measures the value that your product provides to your users. This data helps you take actionable strategies that make customers stick to your product while making your product a delightful one.
You can calculate the sticky ratio by dividing the DAU number by the MAU number.

Product satisfaction metrics to understand customer experience
Finally, we’ll go through product health metrics that let you understand customer experience better.
Net Promoter Score (NPS)
NPS, or Net Promoter Score, asks customers about their likelihood to recommend your product on a scale from 1 to 10. It is a simple yet effective way to measure customer loyalty and identify at-risk customers. After identifying at-risk customers, you know whom to offer targeted retention efforts.
In-app NPS surveys are useful for measuring the impact of new features on customer satisfaction. Tracking NPS helps you identify customer satisfaction trends and learn what to improve for a better customer experience.
You should subtract the percentage of detractors (respondents scoring 0 – 6) from that of promoters (respondents scoring 9 – 10) to calculate NPS.

Customer satisfaction score (CSAT)
CSAT, or customer satisfaction score, measures the satisfaction level of your customers with a specific product, feature, or even interaction. It’s a powerful tool to understand customer retention by identifying whether they will continue your product.
Measuring customer satisfaction helps you identify the friction points in the sales funnel and eliminate them. You can also put your performance against the customer satisfaction benchmark to learn how you’re doing in the market.
To calculate the satisfaction score, divide the number of happy customers by the number of customers asked.

This is what an in-app CSAT survey looks like:
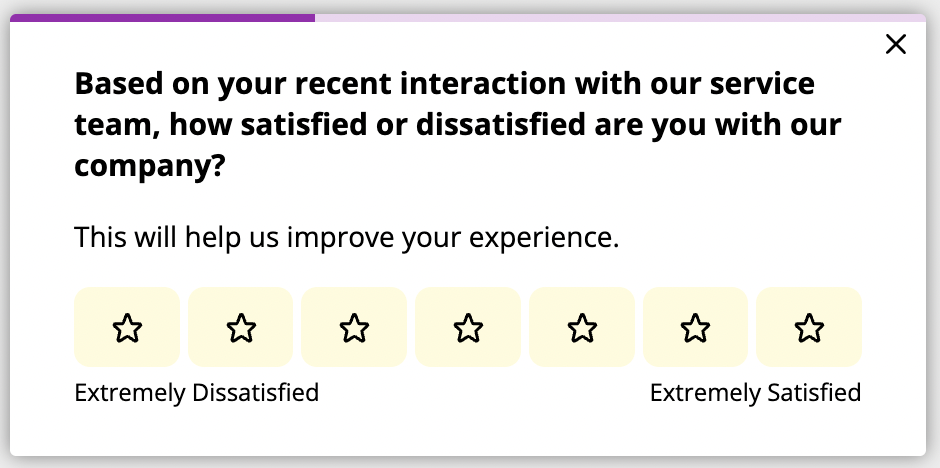
CSAT in-app survey example in Userpilot.
Customer effort score (CES)
The customer effort score (CES) measures and quantifies the level of effort a customer needs to put on to interact and engage with your products. It evaluates the ease of customer experience and also helps you identify pain points and potential frictions.
CES informs product improvements by enabling you to see where the customer experience can get easier. As a result, it is one of the key metrics for any SaaS business looking to create a seamless and user-friendly experience.
To calculate CES, divide the number of “agree” responses (ratings of 5, 6, and 7) by that of responses. Then, multiply the determined ratio by 100.

How to measure product health metrics using Userpilot?
Userpilot is a no-code solution for SaaS businesses to enhance user experience and improve product engagement. It’s incredibly helpful for collecting data to track product health metrics.
It collects user data by various contributing criteria, such as company affiliation, user ID, and content engagement. Correspondingly it ensures your analysis is laser-focused on what truly matters for your product team.

Userpilot allows you to tag specific features within your product and easily monitor feature usage. It helps you comprehend the value and effectiveness of your features to your customers.
You can also measure product engagement with onboarding elements like tooltips, checklists, etc. Incorporating no-code and code-based tracking events lets you understand how new users interact with your product. Additionally, it also enables you to create activation and adoption goals to measure your product’s success.

Userpilot offers you to create powerful surveys to listen to your customers by collecting valuable user feedback. It lets you measure customer satisfaction and curate your strategies for your customers’ needs.

Survey question templates in Userpilot.
Conclusion
Measuring product health metrics is an ongoing process for your SaaS business. So, continually learn from the metrics data and use those insights to evolve your product and exceed customer expectations.
Want to get started with product health metrics? Get a Userpilot Demo and see how you can optimize your product growth with valuable insights.

