How to take full advantage of your tabular data (by turning it into events data)

When most people hear the word “data,” their mind instantly fills with rows and columns. After all, tabular data (as this format is called) has been the de facto way to organize and store data since the days of pen-and-paper spreadsheets. But tables don’t necessarily provide the deepest insights when it comes to product (or most any other type) of analytics—events do.
What’s event-based data (or events data)? In general, it’s richer and more efficiently organized tabular data. More particularly, it’s the kind of data that Mixpanel captures and flows through all of its charts and dashboards. What a lot of people don’t realize is how easily they can turn almost any kind of tabular data into events data and what a powerful difference it can make for their analysis by doing this.
Let’s get into how this is possible, go over specific reasons you’d want to do it, and then touch on how you can put it together with the right tools.
Why tabular data can also be events data
For most people working with small amounts of data, the fundamental unit of organization is the data table. Arguably the oldest data structure there is, a data table is a way to organize data for machine processing and to present data visually for human consumption. The fundamental unit of organization for a relational database management system is a data table.
But using certain tools, you can easily transform your tabular data into events data and in doing so go from relational data modeling to events-based data modeling.
The bottom line: Data is data. Meaning, at its most foundational and fundamental level, data is just a bunch of ones and zeros being combined and uncombined and moved around in certain ways through certain tools.
The key, of course, isn’t worrying about what your data IS but what you can do with it via its manipulation. A lot of people, for example, think tabular data can only be used in certain ways, when in fact it can be used just like event-based data, as long as you know how to turn it into event-based data and then use a product analytics tool like Mixpanel to analyze that event-based data.
“But aren’t we talking about two inherently different kinds of data?” you ask. “How can we magically change one into the other?”
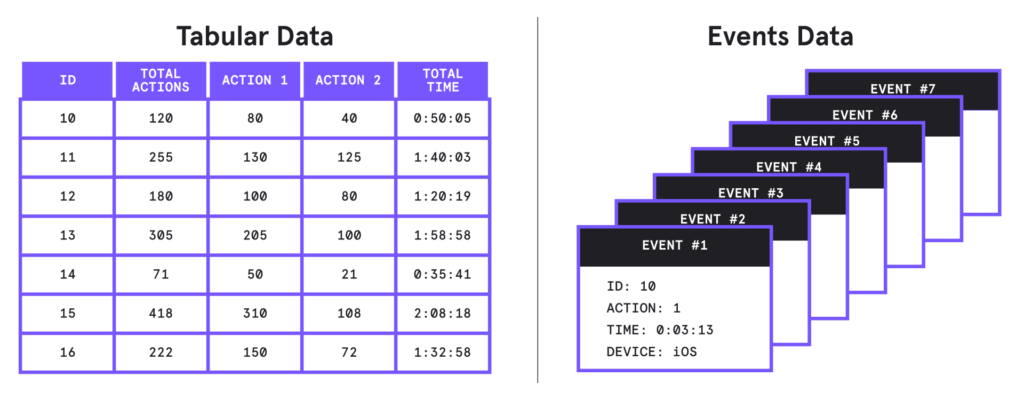
Remember: All we’re talking about is ones and zeros here. The words “tabular” and “events” don’t describe the nature of the data—they describe how we are organizing and using it. The only difference between tabular and events data is the way it’s stored and queried. It’s not about where it came from, what it represents, or how you got it. Hence, the question of “What’s the difference between tabular and events data?” is far less important than the question of “What can I get by transforming my tabular data into events data?”
First—let’s examine the “why,” then let’s look at the “how.”
The benefits of transforming tabular data into events data
The power of events data is that, unlike tabular data, it doesn’t just describe what something IS but what it DOES. That’s why events data is also commonly called “behavioral” data.
Events data contains three key pieces of information:
- Action, or the thing that’s happening (e.g., “click”)
- Timestamp, or when this thing is happening
- State, or all the other known relevant information about this event, such as the name of the person doing it and the type of software they are using to do it
In addition to containing this information, events data has certain qualities. For one, it’s denormalized, meaning it can be grouped and/or duplicated to make it easily accessible, which is a key reason why Mixpanel queries (especially funnels) are so much faster and easier than SQL queries.
Of course, these key differences between tabular and events data also account for why you would want to change your tabular data into events data. Simply put: Events data is richer, more flexible, more accessible, and hence, far more versatile and valuable.
Some examples are:
1. Gaming: You can use analytics of events-based data to analyze the actions the gamers take within a game and then apply that information to improving the user experience and thereby improve user loyalty (e.g., does giving a player a new sword extend user sessions?)
2. Music: You can record plays to pay your rights holders by keeping a table of playlists that you can map to users.
3. E-commerce: An order is a perfect event to analyze because it has a timestamp, a date, an amount, a number, a shipping method, etc. So one thing you could do is analyze repeat customers (e.g., Are customers who use a coupon code the first time they shop more likely to come back?) using only a single table.
Mixpanel + reverse ETL integration
Now that you understand WHY you’d want to turn your tabular data into events data, let’s (briefly) look at HOW to do it.
If you already have a quality Mixpanel integration, events data from your product is created and captured on the fly. But you can event-ify all your other kinds of data with a reverse ETL—extract, load, and transform—tool like Census. This could be marketing, sales, or other operational data—and from any database to which you have access, including BigQuery.
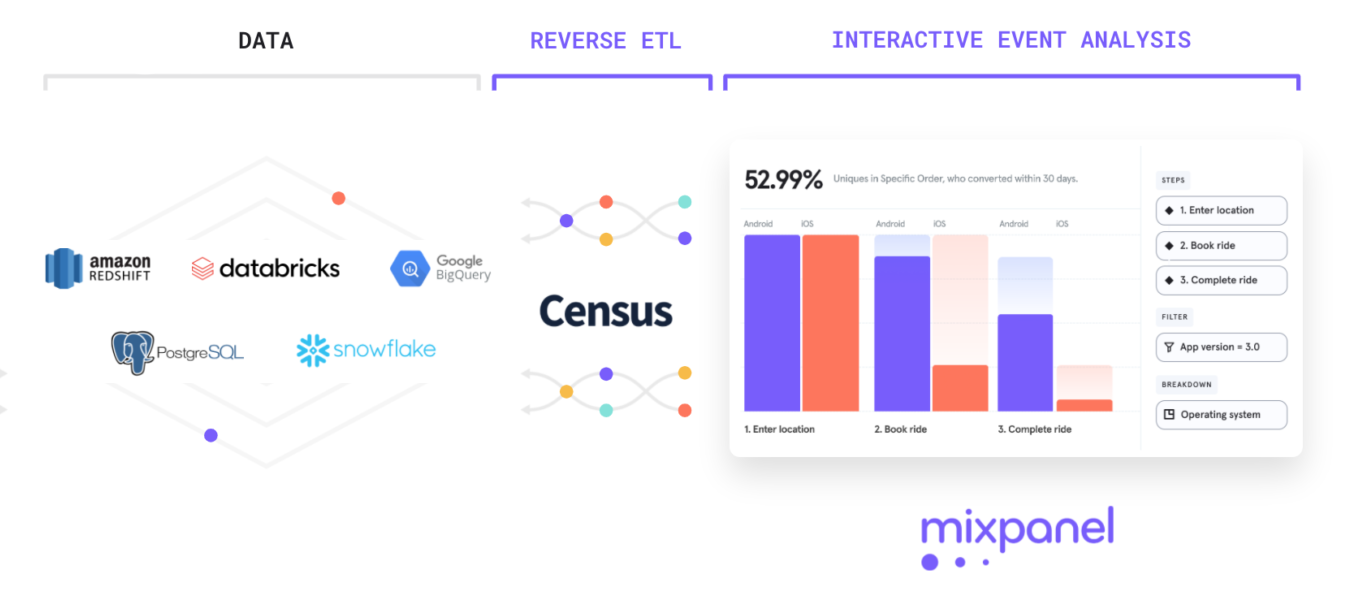
In doing so, you can bring tabular first- and third-party data from your product database, CRM, marketing automation, and other applications together to create event-based data that provides more granular user segmentation and better analyses, without having to write a single line of custom code or worry about your ETL pipeline.
For a deeper look into how the Census/Mixpanel integration works, click here.
Gain insights into how best to convert, engage, and retain your users with Mixpanel’s powerful product analytics. Try it free.