From Looker to Mixpanel: How and why Mixpanel’s analytics team is making the transition

Mixpanel is an analytics company, so I don’t have to tell you that we highly value using analytics to make better decisions and optimize the running of our business. As our Head of Data and Analytics, my team and I have been at the forefront of making analytics on our own internal data state of the art, and I’m thrilled to say that today we’re able to transition all of our business analytics to Mixpanel.
Why is this so important to share?
Our data scientists and analysts—with over 40 years of combined experience at companies including Zoom, Meta, Reddit, Twitter, and Google—require powerful and sophisticated tooling for business operation and revenue data analysis. Up until now, that was handled by Mixpanel and Looker, our BI (business intelligence) solution of choice. But with recent advancements to Mixpanel, our data team can now use it to implement and govern full company data, making Mixpanel a complete analytics solution for us—and, we hope, for you.
I’d like to share how we worked with our product, engineering, and design teams to inspire and dogfood the best business analytics solution and what we’re gaining today by moving off of Looker.
Early experiments with Mixpanel for business data
From the time I joined the company, I’ve been intrigued by the idea of using Mixpanel to analyze all types of business data, not just product usage data. The reason Mixpanel is so great for product analytics is that it has a simple event-based data model, where events are equivalent to fact or transaction tables and profiles are equivalent to dimension tables. By standardizing on a simple data model and using custom infrastructure, Mixpanel unlocks fast, powerful exploration and analysis of data in an intuitive interface that any of my stakeholders can use. That solves what has been a problem in every analytics team I’ve been a part of in the past, where the team is deluged with ad-hoc data requests that consume all of our bandwidth, leaving no time for deeper exploration or building more powerful analytical frameworks. The result is a burnt-out, demoralized team and a long queue of frustrated customers waiting for their seemingly simple data requests. Solving this problem across all business domains rather than just product would be a dream come true.
[Mixpanel] solves what has been a problem in every analytics team I’ve been a part of in the past, where the team is deluged with ad-hoc data requests that consume all of our bandwidth, leaving no time for deeper exploration or building more powerful analytical frameworks.
The promise of event analytics for everything
As soon as I began building an analytics team here, we started experimenting with putting all of our business data in Mixpanel, in addition to our product data. We exported all of our sales, business, and revenue data to BigQuery, used dbt to transform it all into event and profile tables, and used reverse ETL tools to push the data into Mixpanel. These early experiments were promising but pretty far from a usable solution.
On the promising side, we could see that our basic intuition was correct: Mixpanel’s event-based model works with business data. We could quickly build a funnel to see where in the sales process prospects were dropping off, then we could break it down by sales segment and region to pinpoint problems. The most powerful thing, though, was being able to get answers to big company-wide questions faster with business and product usage data combined.
- How much revenue is associated with usage of various product features?
- What types of product usage are positive or negative indicators during a sales cycle?
- What types of product usage most often lead to plan upgrades in the next renewal cycle?
We knew Mixpanel needed to grow in functionality
There were several significant data governance problems that stood in the way of fully adopting Mixpanel for business data, though.
First, Mixpanel only kept the most recently synced profile property values. Since the revenue associated with each customer was stored as a group profile property, for example, we could not look at revenue growth over time in Mixpanel. Second, event tables were immutable. That means that once an event was synced to Mixpanel, it could not be changed. It’s routine to catch and fix errors in the data stored in your data warehouse from time to time, but none of those fixes would make it into Mixpanel, meaning our analysis would diverge from the source of truth (the warehouse) and couldn’t be fully trusted. Lastly, not all of our business metrics could be defined in Mixpanel, and there was no consistent way to govern metrics definitions between Mixpanel and Looker.
Looker and Mixpanel
With all of the enthusiasm we’ve had for using Mixpanel to analyze business data, it may be surprising that we’ve also used Looker. To best serve an organization, analytics teams need to provide three things:
- Metrics reporting
- Ad-hoc analysis
- More complex analysis involving new analytical frameworks and models.
The third category is beyond the scope of this post. It is important to explain the difference between metrics reporting and ad-hoc analysis, though.
Metrics reporting is valuable because it creates alignment. As companies grow, communication and alignment become exponentially more difficult. If different teams, departments, or organizations in a company use different data and different metrics definitions, chaos ensues. Different people can develop completely different perceptions of what is happening in the business. If we can’t all agree on basic facts, what hope do we have to work together effectively to achieve ambitious goals? Analytics teams can add a lot of value by working with multiple stakeholders to define shared metrics, making clear visualizations of those metrics available to everyone, and governing the metrics and underlying data to ensure high quality. This is the essence of metrics reporting.
Ad-hoc analysis, on the other hand, has to do with answering questions not already addressed in the available metrics dashboards. Everyone needs to make decisions informed by data, and oftentimes that requires looking at the data in some new way. It is not possible or even desirable for an analytics team to anticipate every possible question and create dashboards up front to answer them all. Additionally, there are many metrics that only a single individual or team will care about, and they should be free to define those metrics as they see fit without the analytics team becoming a bottleneck or gatekeeper.
We decided early on to use Looker for metrics reporting even as we experimented with Mixpanel for ad-hoc analysis on our business data. Traditional BI tools have an interface amenable to locking in dashboards to specific views of the data, enabling alignment across departments. However, here, too, we ran into problems.
If different teams, departments, or organizations in a company use different data and different metrics definitions, chaos ensues.
The problems that came out of using two tools
First, many metrics are defined twice, once for Looker and again for Mixpanel. This makes it likely that discrepancies in the definitions will appear. Second, cost became an issue. Looker and other BI tools have a seat-based pricing model. Getting a seat for everyone at the company was prohibitively expensive, yet the whole purpose of adopting Looker was to create alignment through everyone looking at the same metrics. Lastly, our customers, Mixpanel employees, were often confused about when to use Looker and when to use Mixpanel. Even when they did know, switching from one tool to another added friction to the experience. It is natural to start with a standardized dashboard and then explore from there.
What we really wanted was one tool that could solve both metrics reporting and self-serve ad-hoc analysis seamlessly. We either needed a BI tool that could do fast, powerful, intuitive ad-hoc analysis like Mixpanel (one problem: this doesn’t exist), or we needed Mixpanel to support our metrics reporting use cases in addition to solving for the problems that made ad-hoc analysis with business data problematic. Luckily, the analytics team were far from the only ones at Mixpanel who saw what a game-changer solving these problems would be.
My dream business analytics tool is now a reality
Many people at Mixpanel had long had the same intuition I did about the value of bringing business data into Mixpanel. My team’s early experiments helped validate these intuitions, and our product, design, and engineering teams executed on a series of pretty fundamental changes to Mixpanel to bring this to reality. As early versions of these features became available, our analytics team got early access so we could test them out and give feedback. It has been, and continues to be, a really productive collaboration, and it ensures that we’re building features that we ourselves rely on every day. That, in turn, gives us the confidence and conviction that our customers will also use and love them.
The new Mixpanel features that make all of this possible
The most important features in question (so far) are:
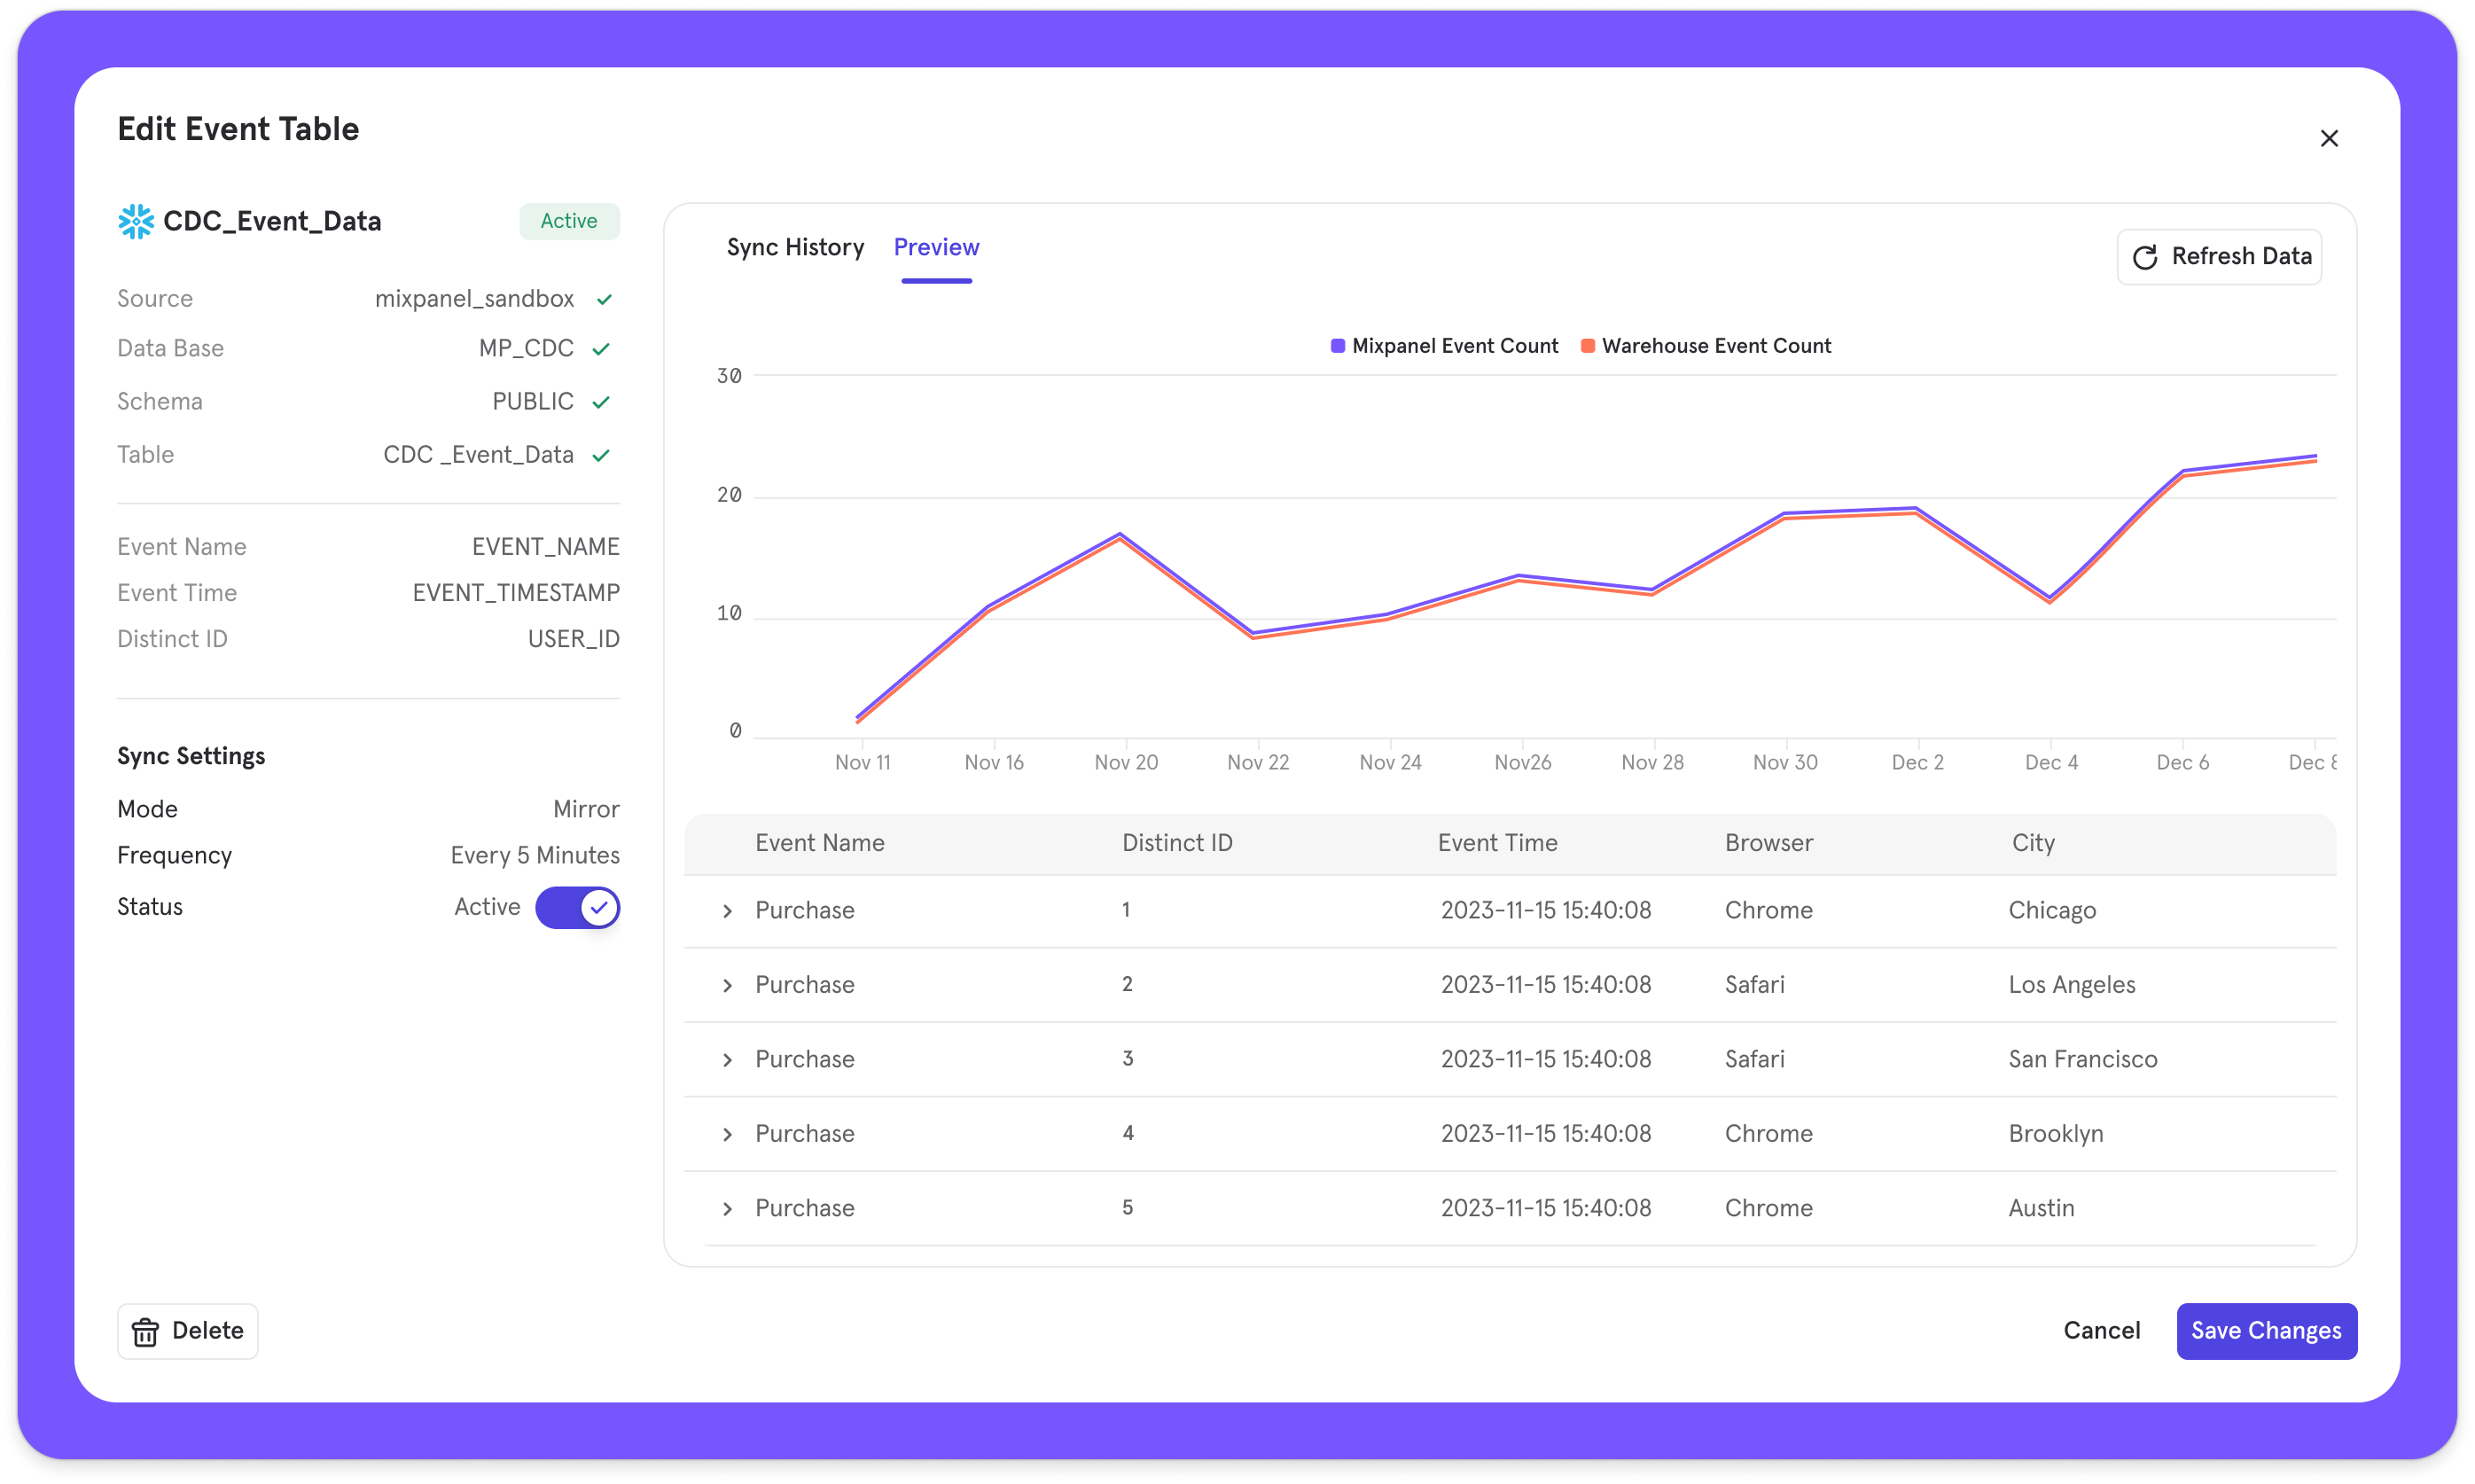
- Warehouse Connectors: We can easily send events and profile tables from our data warehouse to Mixpanel.
- Profile History: Mixpanel retains history on profile property values so you can now see things like how revenue has grown over time.
- Mirror: When you make retroactive changes to event and profile tables in your data warehouse, those changes are then reflected in Mixpanel. That means you can fix quality issues in historical data or enrich your events and profiles with more properties and have them available for past events and profile property values.
- Sharing and Permission Controls: Standardized metrics and Boards can be locked in so the data team can ensure consistency and quality.
We’re also shipping a host of changes to add reporting and visualization flexibility, and more governance functionality to manage and govern shared metrics are on the way, too.
The new functionality that’s now available has allowed us to migrate our top-level company dashboards from Looker to Mixpanel. We’re now in the process of migrating all of our operational dashboards over too. We’re already starting to see the dream of self-serve ad-hoc business analytics realized across the company, with our team of experienced data scientists and analysts freed up to spend more time working on complex analysis.
Try Mixpanel for business data today
All of the new Mixpanel features that make this possible are now either available generally or in beta. If you want to try them out for yourself, you can go here for more information or contact your account team.
I’ve been working in data and analytics for many years, and I’ve finally got the analytics tooI I always wished existed. I hope all of you love it as much as I do, especially those of you on data and analytics teams that want to solve these problems for your customers, too.