How to Analyze NPS Responses for Actionable NPS Insights

Are you a SaaS product manager wondering how to analyze NPS responses effectively and get enough data to draw actionable insights that will help you grow your business?
Then keep reading!
TLDR;
- The NPS score measures customer loyalty – it asks how likely they are to recommend the product to their friends or network.
- NPS works by surveying customers and then organizing them into three categories: Promoters (happy customers who scored 9-10), Passives (neutral customers who scored 7-8), and Detractors (unhappy customers who scored 6 or below).
- To get the actual NPS score, you subtract the percentage of detractors from promoters.
- A good NPS score depends on your industry. In SaaS, a score between 1-30 is acceptable, a score between 30-50 is solid, and a score of 50+ is excellent.
- There are three ways to collect NPS data accurately: use surveys across your entire customer journey, follow up and gather qualitative data, and send the surveys to a medium-sized sample of people.
- To analyze NPS responses, visualize the data on a dashboard, track changes to the score over time, tag and categorize open-ended responses, and perform a root cause analysis.
- You can also cross-reference NPS data with your product usage analytics, group responses by user segment, and chart NPS against other CX metrics (like CSAT and CES).
- To improve your NPS score, share the results with your entire team to make changes and close the feedback loop by reaching out to respondents with solutions.
- Use Userpilot to create and analyze NPS surveys code-free. Book a demo today to improve user sentiment and customer loyalty.
![]()
Try Userpilot to Create and Analyze NPS

What is the Net Promoter Score (NPS)?
Net promoter score (NPS) is a CX metric that measures loyalty by asking how likely you are to recommend the product or service to a friend or colleague.

Net Promoter Score (NPS)
How does the Net Promoter Score work? Promoters, passives, and detractors
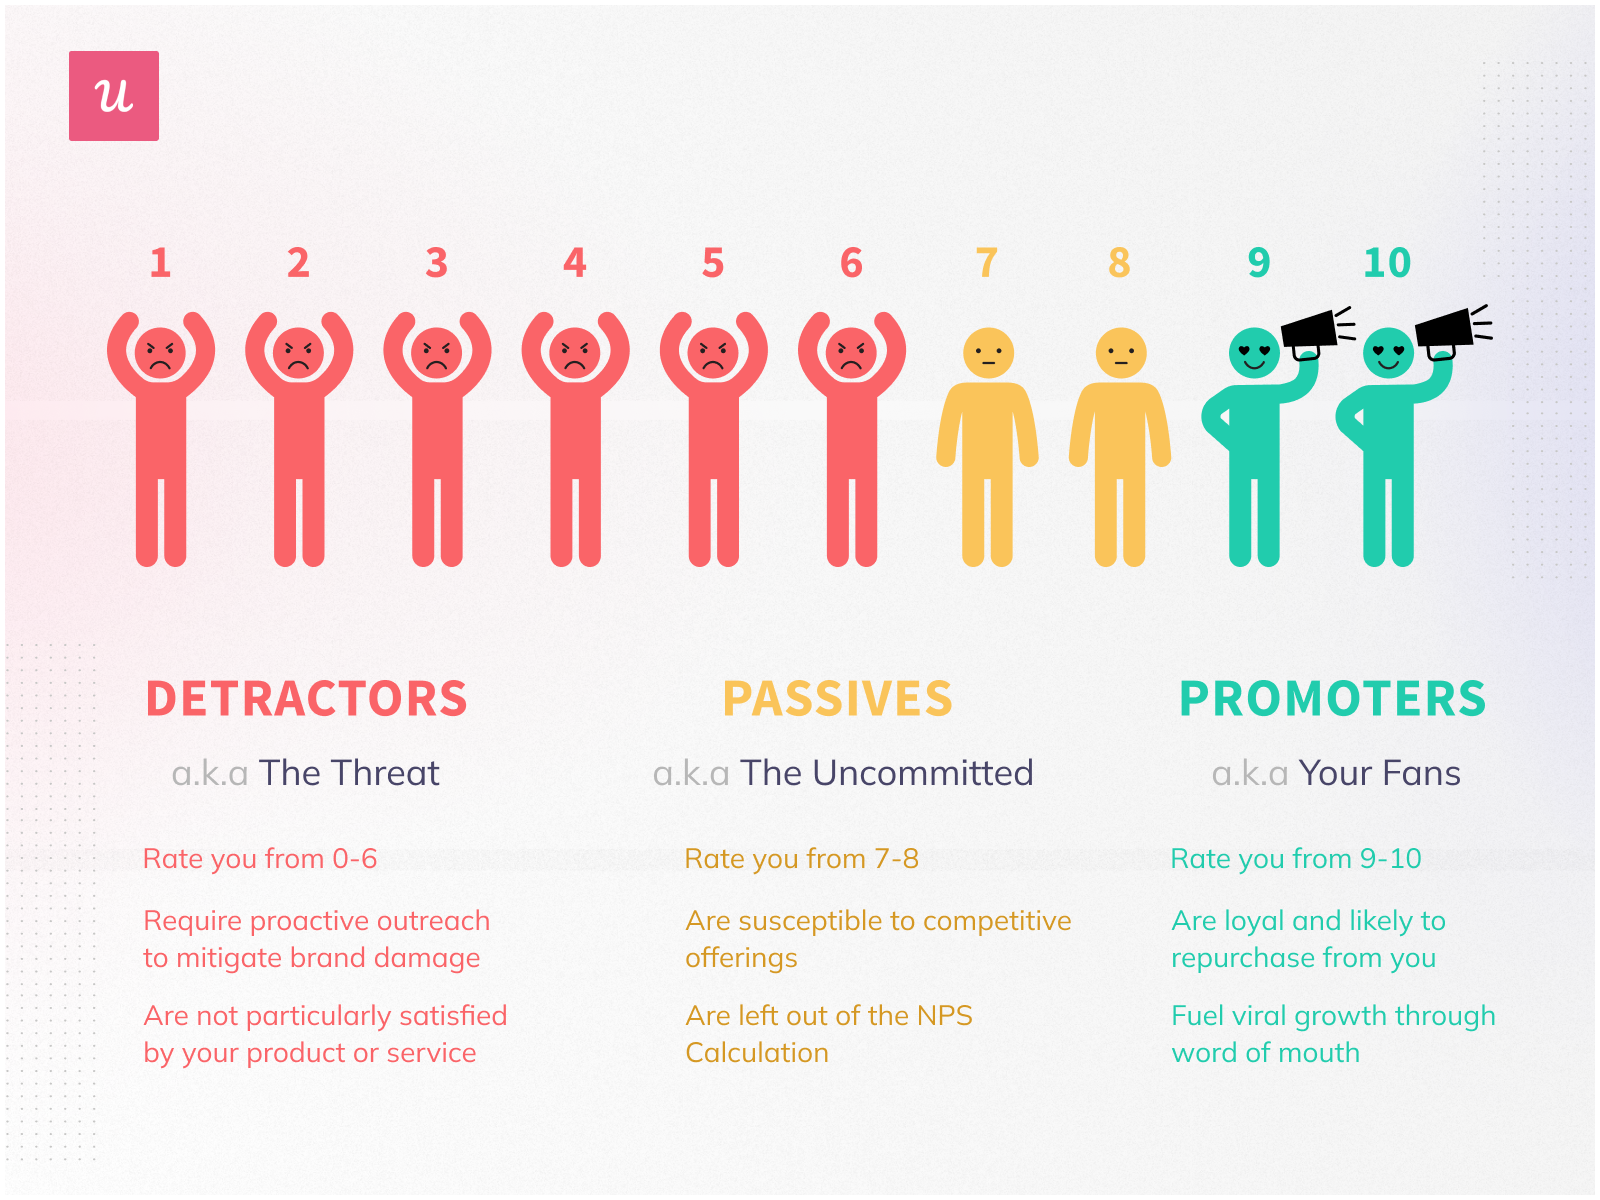
Net promoter score analysis works by surveying customers about products or services and then dividing respondents into 3 categories:
- Promoters ( scored 9 or 10) – Promoters represent a company’s most passionate and loyal customers. They act as brand spokesmen – go out of their way to support you, spread positive word-of-mouth, and drive referrals, helping fuel the company’s growth.
- Detractors (0 to 6 )– these are unhappy customers with a negative sentiment toward your brand. They’re likely to churn and often may even dissuade people from using your product with negative word of mouth.
- Passives (7-8) – those are customers who are on the fence about your company. They are closer to promoters – generally satisfied with your service but not happy enough to recommend it to others.
To calculate NPS, substruct the percentage of detractors from promoters. Passives are always left out of the equation.
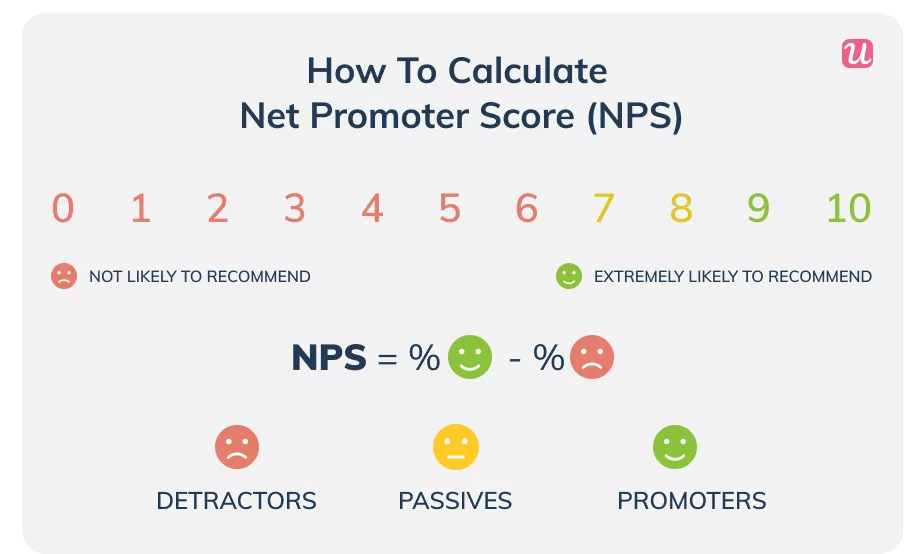
How to calculate NPS
High NPS scores signify customer satisfaction and loyalty.
What is a good NPS score?
To do a proper NPS data analysis, you need to know your benchmarks – what a good NPS score is. That being said, industry averages differ.
For SaaS, the average NPS is 41.
In general, a score between 1-30 is acceptable – it means you have more promoters than detractors. A score between 30-50 is solid, and a score of 50+ is excellent. Anyone scoring above the numerical score of 50+ is doubling down on customer experience and customer satisfaction.
How to collect NPS data accurately
Before you can analyze NPS results and responses, you need to ensure you are collecting data accurately. Otherwise, your final results will be skewed and may do more harm than good.
Here are three ways to collect and use NPS and survey data effectively:
Use NPS surveys at multiple stages of the user journey
You won’t get a well-rounded look at customer feedback unless you send surveys at every stage of the customer journey. By analyzing customer survey responses across the entire lifecycle, you can narrow down your ideas for how to further improve customer loyalty at every stage.
You’ll also notice areas of friction where negative feedback is higher, so you can prioritize those areas to improve.
For example, when you survey customers right after they finish onboarding, you can get valuable insights into the onboarding experience. Based on the average NPS rating, you can see if your onboarding process is effective.
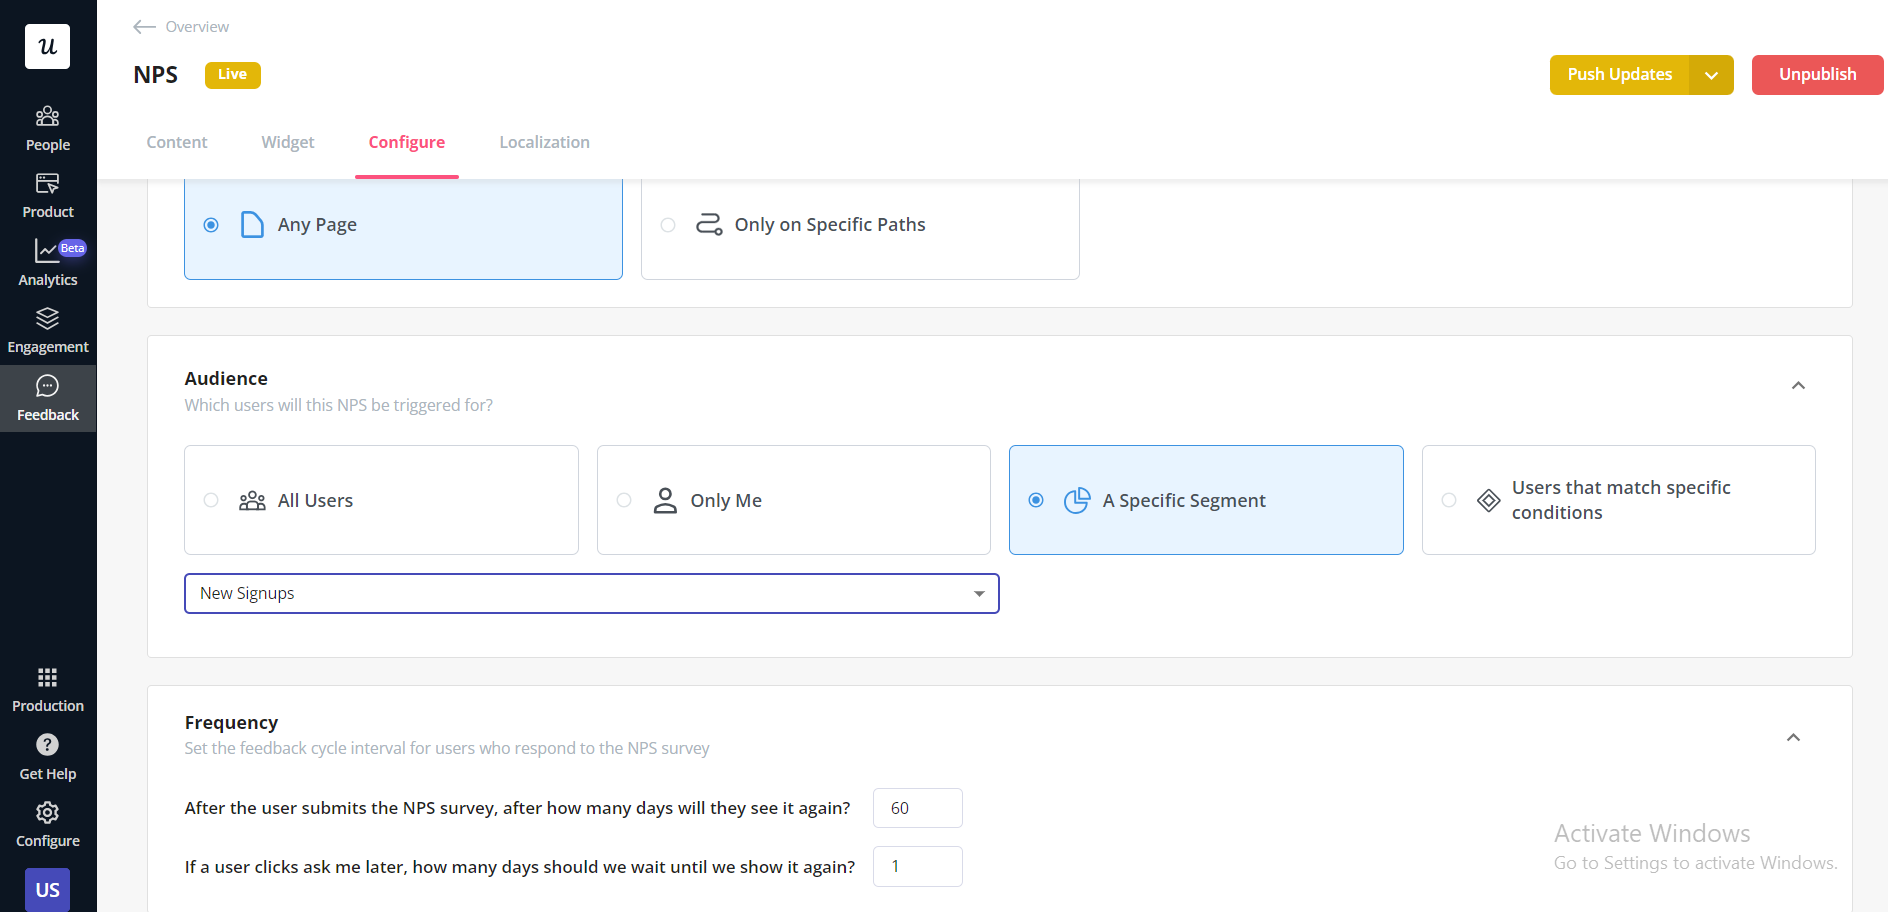
Choose when to show NPS surveys in the customer journey in Userpilot.
Here are some other important points in the user journey to gather NPS survey data:
- After users have reached activation: This is the moment when customers achieve value with your product for the first time. It’s different for every product – for example, an email marketing tool’s activation point will be when a customer sends their first email.
- After adoption: This is when customers have accepted the product as a part of their routine, using it daily or weekly.
- Unique date-set. These are unique dates you set that are critical in the customer lifecycle – for example, you can send out an NPS survey after they’ve invited a user to join their team.
Follow up and gather qualitative data
The Net Promoter system is a great way to gauge your company’s current success, but not useful when it comes to knowing what changes to make.
This is where follow-up qualitative questions come in handy – they help you uncover the reasons behind your customer’s ratings.
You can gain deeper insights from the qualitative NPS responses that will help you to drive real change.
Tip: Personalize the follow-up questions for customers’ responses across all 3 customer categories. Asking tailored and relevant questions will encourage engagement and increase your survey response rate.
Moreover, there are even tools like Userpilot that will help you to take this to the next level- automate the process and send customized follow-up questions based on score immediately.

Easily create score-based follow-up questions for NPS surveys in Userpilot.
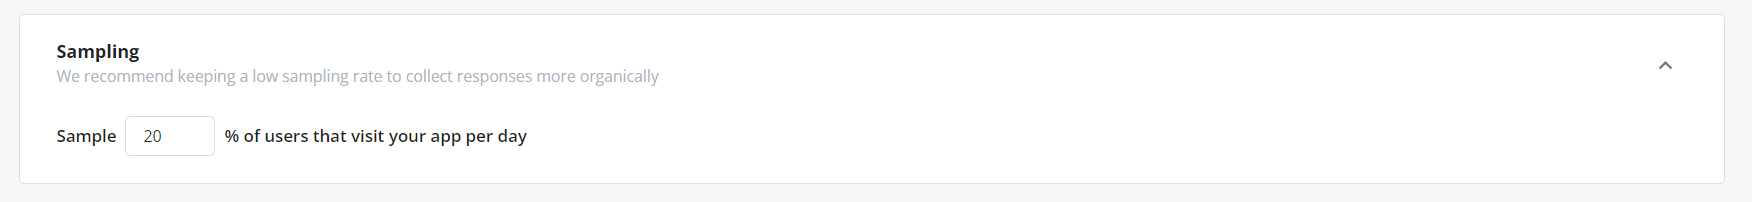
Send NPS survey to the right number of customers
The sample size is an important factor when you run NPS surveys. If you have too much feedback or too little, it will affect the accuracy of the data.
Aim for a medium-sized sample size of NPS respondents for the best results. Otherwise, your NPS survey responses might be skewed.
How to analyze NPS responses
Here are 8 techniques for analyzing NPS survey data and drawing actionable insights that will help you improve the customer experience and boost loyalty.
Visualize the NPS data on a dashboard
Get a unified view of your NPS data with a dashboard.
User feedback software like Userpilot pulls all the data such as response rates, percentages of detractors and promoters, overall NPS score at the moment, and NPS over time.
It makes sentiment analysis easy, so you can focus more time on improving your own net promoter score analysis.
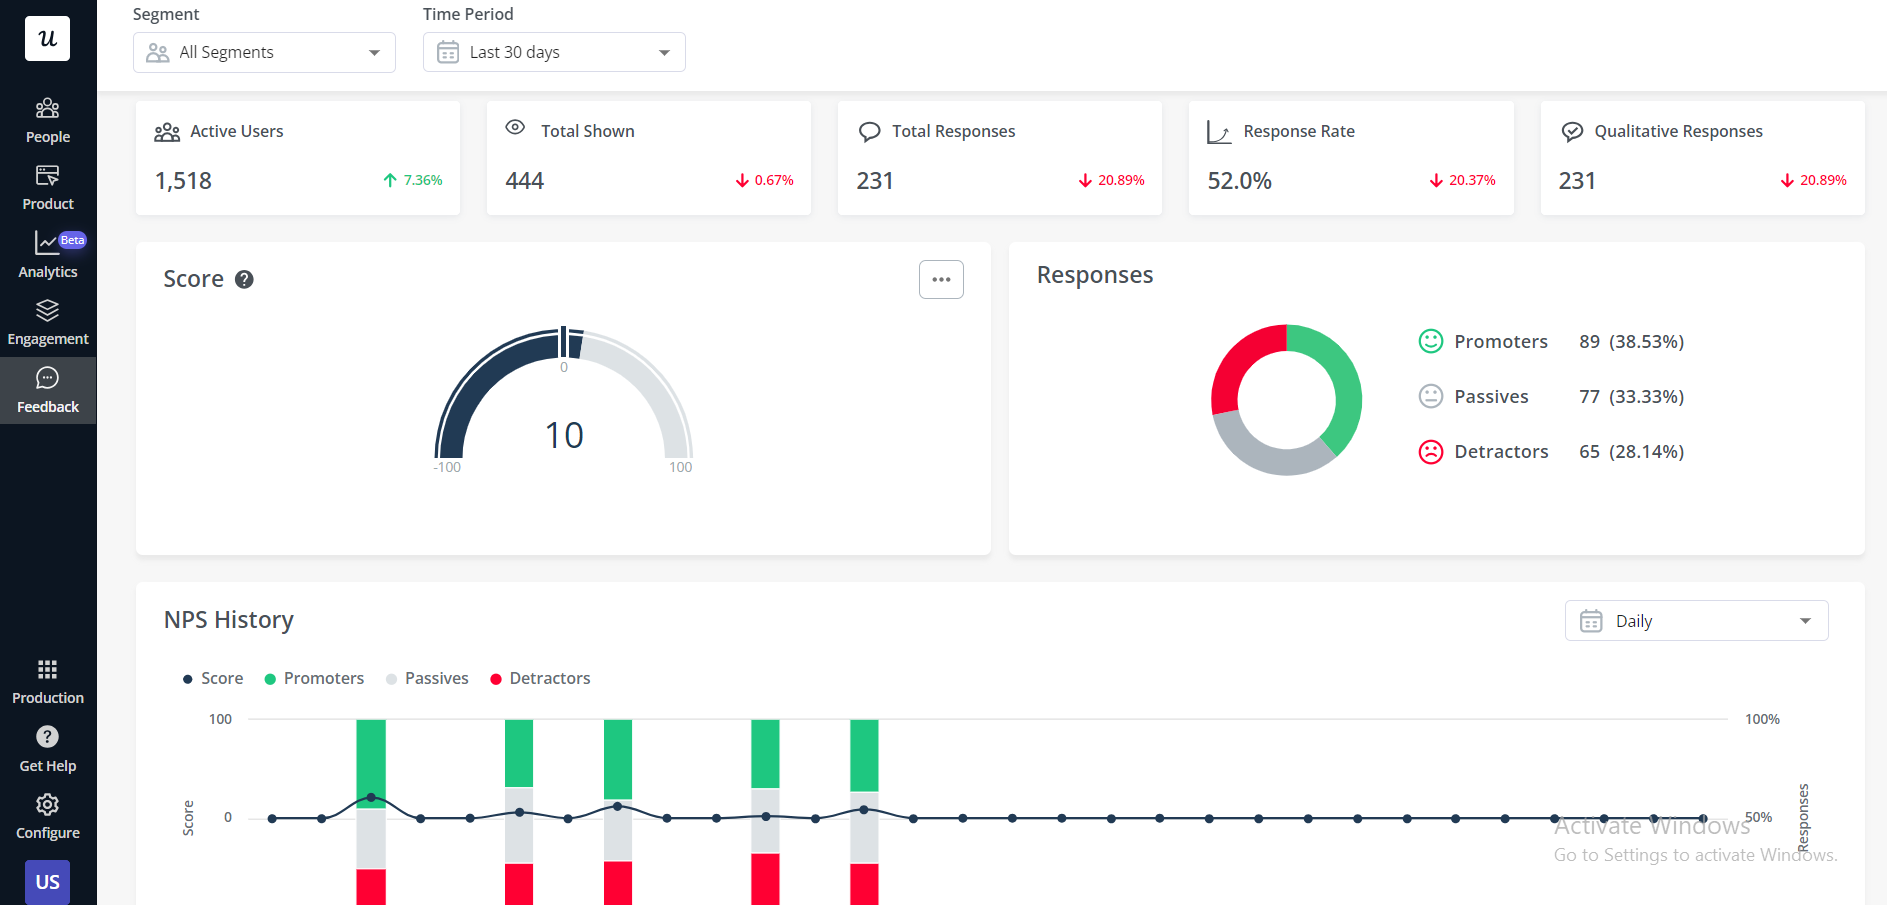
Visualize NPS data with a comprehensive dashboard in Userpilot.
Use NPS to detect trends and measure changes over time
NPS survey results aren’t just beneficial at the moment – they’re a great tool to detect emerging trends and measure changes over time.
Send NPS surveys every 90 days to keep tabs on customer satisfaction from quarter to quarter.
For example, maybe the net promoter score is lower one quarter because you’ve removed a certain feature. If you take on that customer feedback and replace that feature or bring it back, you may notice customer responses leaner more positively in the next quarter.
Tag and categorize qualitative responses
NPS responses can help identify common customer pain points by grouping feedback into theme buckets (tags), allowing you to understand how to improve.
To do this, manually go through open-ended responses and categorize each one into predefined topics such as Functionality, Usability, and Reliability.
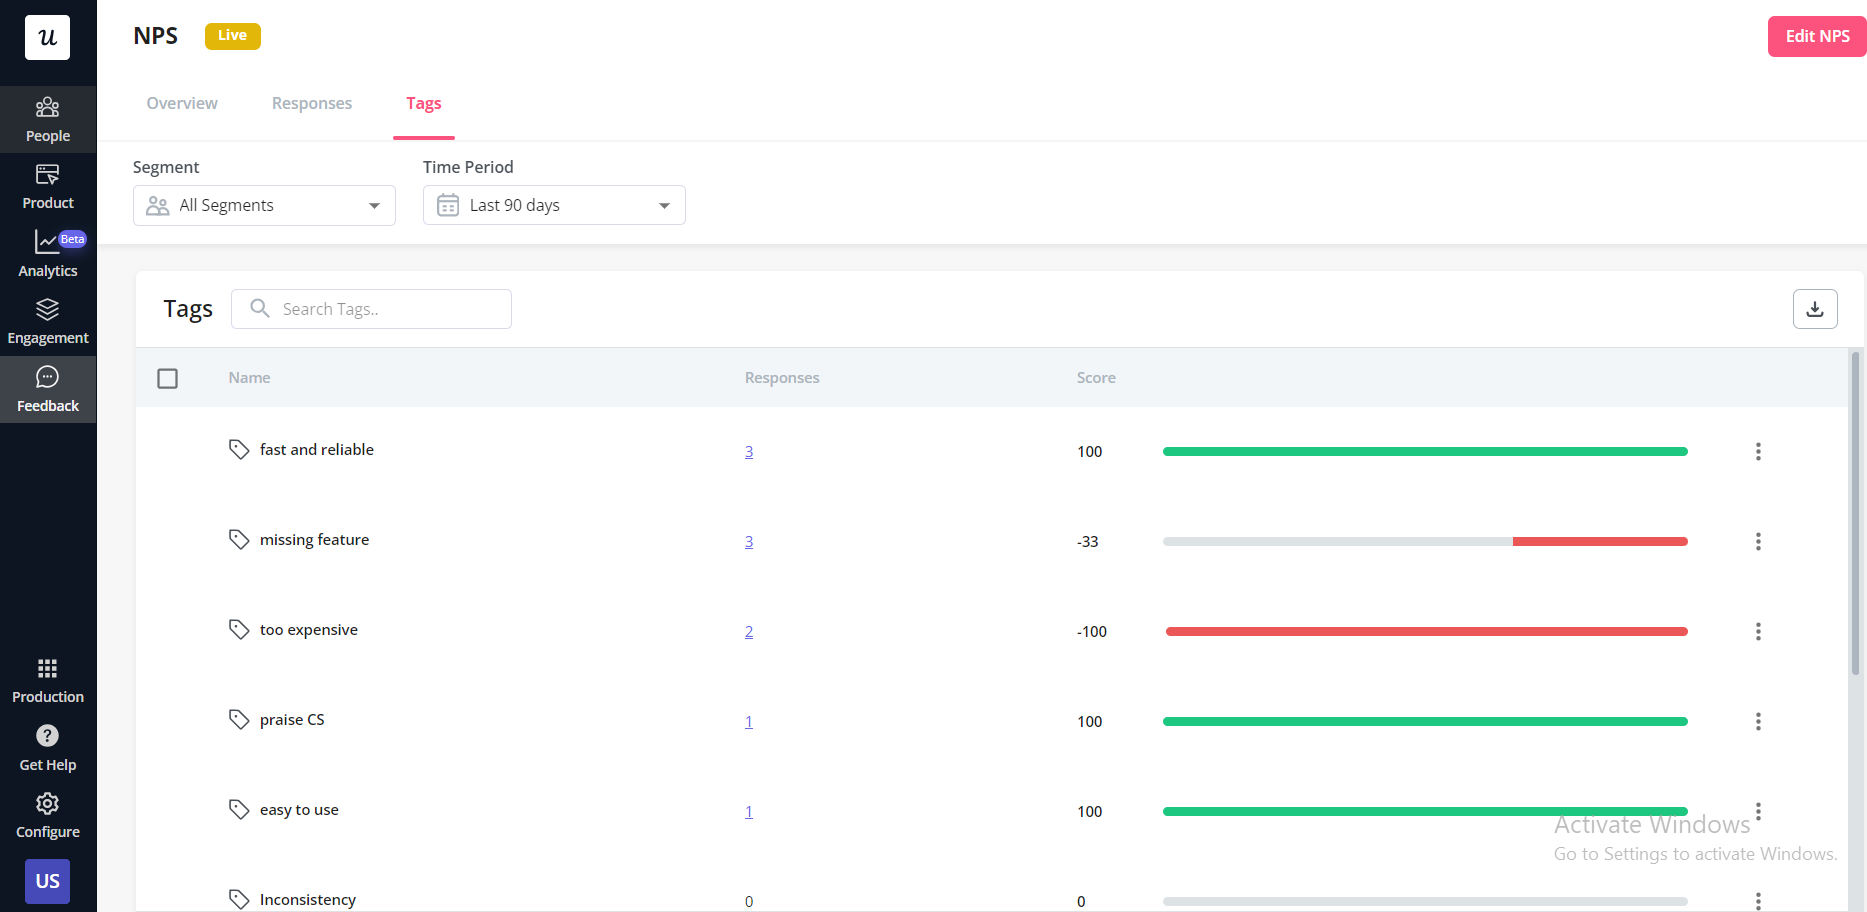
Easily tag and categorize NPS qualitative responses in Userpilot.
Identify common themes and patterns
Group the Promoters, Passives, and Detractors, and find the most prevalent tags in their responses.
For example, detractors may complain of a missing feature. On the other hand, all promoters may agree the company provides good customer support.
These insights will tell you where to double down and how to improve.
Perform a root cause analysis using “The 5 Whys” approach
Root cause analysis involves finding the reason behind given NPS responses. There are a few approaches you can take to do a root cause analysis, including the “The 5 Whys” method.
This involves digging deeper into a root cause by asking yourself five questions that expand upon each other.
Let’s see this process in action with an example:
Say you have a survey response that says: “Customer service is too slow.” Here’s how you could use the “5 Whys” approach to arrive at the root cause or causes for the feedback.
- 1st Why: We have 50+ support tickets coming in every single day and they take at least 20 minutes to respond to each one.
- 2nd Why: We don’t have documented processes to answer FAQs faster or direct customer service reps on how to answer more complex issues faster.
- 3rd Why: Creating a list of FAQs and responses is a big project that requires hours of someone’s time.
- 4th Why: Customer service reps are already too busy responding to tickets to create these processes.
- 5th Why: We didn’t hire someone to write these processes as a separate project.
Now, with this process of finding the root cause for an issue, you can get to work fixing the problem.
Cross-reference NPS with product usage analytics
Look into the product usage patterns of your promoters, detractors, and passives.
What paths do promoters take? What features do they engage with? How much time do they spend on average using the platform? How do their usage patterns differ from other segments?
![]()
Think of the valuable insights this process can give you! For example, if you can see what features your promoters use the most, you can create in-app walkthroughs that educate every user on how to use this feature (and its benefits).
Correlate NPS responses with segmentation data
To be able to draw more actionable insights and conclusions from sentiment analysis, break down the scores according to demographics, geography, and other dimensions.
This helps you to figure out what works and what doesn’t for a certain user segment.
The most common ways to segment NPS include:
- Demographics
Demographic segments make it easier to target your marketing campaigns based on factors like job role.
- Geography
Different cultures rate products more favorably or less favorably. For the most accurate view, segment your customer’s feedback based on their geographical location so that results aren’t skewed.
- Company size
It’s valuable to know the average NPS score across different company sizes so you know who your target audience is. For example, maybe enterprise customers respond better to your product than small businesses do.
- Stage in the customer journey
Do first-time users enjoy your product more? Or does it take time to grow to love your product? These data points are helpful to know where to optimize the customer experience in the journey.
- Purchases/service levels
NPS data that’s segmented based on the purchase or service level gives you insights into what customer sentiment is like around different pricing plans.
Chart NPS against other customer experience metrics
Net promoter score isn’t the only customer experience metric your company should be tracking. To get a complete and accurate picture of customer satisfaction, run CSAT and CES surveys as well to compare results.
For example, a customer satisfaction survey (CSAT) will measure customer sentiment around specific areas, like a new feature. So, if you compare that to your overall NPS score, you can see if just one area needs immediate attention or if the whole company needs an overhaul.
As well, CES surveys (customer effort score) tell you how much perceived effort a customer feels they have to put in to get value. It will also help you gain a deeper analysis of what areas need to be ironed out.
Act upon NPS analysis and improve customer experience
Now that you have your NPS analysis complete, here are four ways you can act on that data to boost overall customer loyalty:
Close the feedback loop
Collecting feedback isn’t enough, you should also close the loop.
Closing the loop means analyzing the data collected, deciding how to best solve customer pain points, and then getting in touch with customers and letting them know what you are up to.
Implementing all the changes customers have asked for can take quite some time. Meanwhile, not hearing from you for a long period can be disappointing for customers and ruin your relationship permanently.
Therefore, it’s not a must to follow up only after you did what they asked.
Very often, customers feel that just sending a simple message thanking customers for their feedback and letting them know that you are processing it, is enough.

Share NPS results with relevant teams in your company
Making the NPS results visible to your entire company will help most teams to understand your customers better and make informed decisions.
For instance, if customers are complaining about bugs in your product, you should share the NPS results with the product team so they can brainstorm ways to address the problem.
For instance, if your customers want more comprehensive subscription plans that are affordable, you can share your NPS results with your finance and product teams and they can work on creating plans that suit your customer needs.
Conclusion
Analyzing your NPS and driving actionable NPS insights will help reduce customer churn and get more loyal customers – which all contribute to more revenue in the long run.
Want to get started with analyzing NPS responses? Get a Userpilot Demo and see how you can run NPS surveys, tag responses, and then build in-app experiences to improve your score.
Create and Analyze NPS Code-Free with Userpilot

