How to Measure User Experience: 7 Key UX Metrics

Wondering how to properly measure user experience and what metrics to track?
Let’s explore what the user experience is, the types of metrics you can use, and how to measure them to improve product engagement.
TL;DR
- User experience encompasses all aspects of a user’s interaction with a product; it includes every factor that provides value to the user, such as ease of use, relevance, and efficient UI.
- Measuring UX is a stepping stone toward enhancing customer retention, understanding user behaviors, and improving the product from feedback
- There are seven types of UX metrics you can use, and they include:
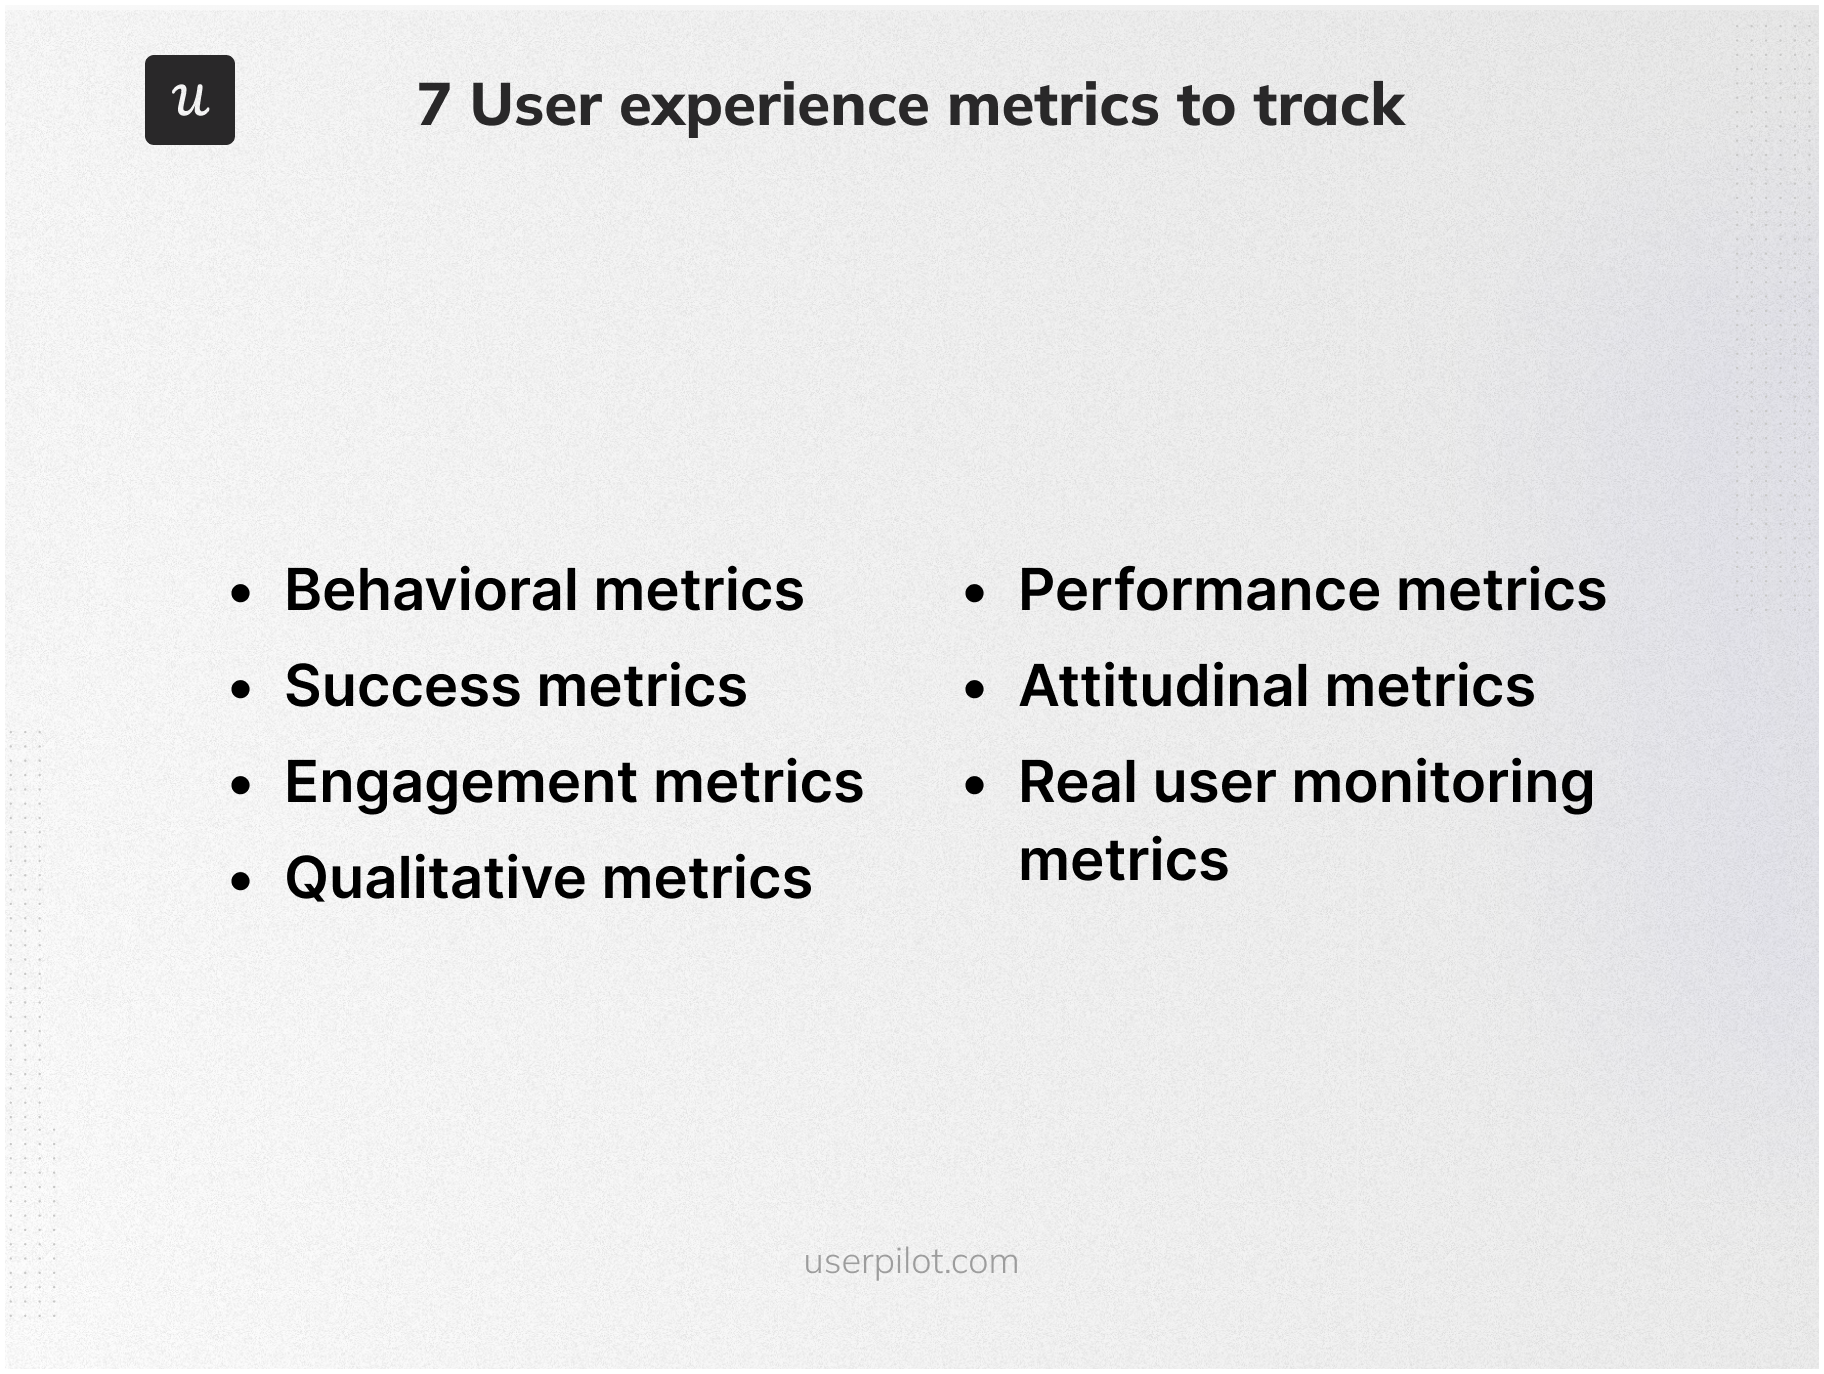
- Behavioral Metrics: They provide insights based on user actions within the product.
- Success Metrics: These evaluate the financial and strategic success of a product.
- Engagement Metrics: Track how users behave or stick with the product.
- Qualitative Metrics: Offer a deeper understanding of user opinions and feelings about the product.
- Performance Metrics: Quantitative data measurements that provide insights into how users interact with the product
- Attitudinal Metrics: Provide insights into user attitudes and satisfaction with your product, which are predictive of future behaviors and helpful in building loyalty.
- Real User Monitoring Metrics: Capture real-time interactions, offering a continuous look at user activity and engagement.
- Here’s how you can measure UX with the right metrics:
- Choose metrics that align with specific goals.
- Select tools that can consistently track chosen metrics.
- Analyze data to identify areas for enhancement, using insights to refine UX strategies.
- Let’s go over the optimal times to track UX:
- During customer onboarding.
- Before the end of a free trial.
- The moment a user interacts with a specific feature.
- After every support interaction:
- If you need the right tool to unlock these valuable insights. Why not book a Userpilot demo to see how you can unlock new opportunities to improve UX?
![]()
Try Userpilot and Take Your User Experience to the Next Level

What is user experience?
The user experience involves every feeling, process, and result that a user gets when interacting with a product.
It includes every factor that provides value to the user such as ease of use, relevance, efficient UI, and essentially, being effective at solving a problem or getting a job done.
Why measure user experience?
In SaaS, retaining users is essential for sustainable growth and it unlocks many benefits such as:
- The ability to increase customer retention as you improve your product’s UX.
- Understand how your customers interact with a product and build a product that fits their needs.
- Receiving customer feedback can help you enhance your product experience and solve friction.
7 User experience metrics to track
Not all metrics are equal or are measured with the same goals in mind.
That’s why we’re going to explore different types of UX metrics, as well as look at some key KPIs for each of them.
Behavioral metrics
Behavioral metrics are calculated based on the actions that your users perform with your product.
Their goal is to illustrate how users are interacting with your product and advancing through the user journey.
Some of these metrics include:
- Time to value. The time it takes users to realize the value of your product (i.e. the AHA moment). It serves as a metric to measure the effectiveness of your onboarding process.
- Depth/breadth of adoption. The frequency of use (depth) and number of users (breadth) of a particular feature. It’s calculated to gauge and compare the adoption level of your product features.
- Freemium to premium conversion rate. The percentage of free users who convert into paid customers. Its primary goal is to measure how effective your freemium model is at demonstrating its value to potential customers.
- Documentation used. Tracks how often a user has required support (either from a resource center or customer service reps). It works as a benchmark to optimize your customer service processes.
- Task success rate (or task completion rate). Calculates the percentage of tasks that were completed. The higher the rate, the more effective is your in-app guidance and UI.
- User error rate. It’s the opposite of task success rate and calculates the percentage of errors that users make when performing a task. Its goal is to measure friction within your app so you can design a smoother experience.
Success metrics
Success metrics focus on evaluating the success of a product or business in achieving its strategic goals. They are essential for understanding the financial outcomes of your UX strategies.
These metrics include:
- Customer Acquisition Cost (CAC): Measures the cost associated with acquiring a new customer. It’s essential for understanding the efficiency of marketing and sales efforts.
- Monthly Recurring Revenue (MRR): This represents the predictable revenue generated each month. It helps you see the short-term effect of product strategies on revenue.
- Total Revenue: The complete sum of income generated from all sources. It indicates the overall financial health of your business.
Engagement metrics
Engagement metrics provide insights into how users interact and stick with a product. They are vital for understanding user commitment and predicting long-term user retention.
These include:
- Lifetime Value to Customer Acquisition Cost Ratio (LTV: CAC): It’s the lifetime value of a customer to the cost of acquiring them. It’s measured to indicate the profitability of acquiring new customers.
- Activation Rate: Measures the percentage of new users who activate. It serves as a metric to track the effectiveness of your onboarding process.
- Feature Engagement: Tracks how frequently users interact with specific features. It illustrates its importance and utility.
- Product Adoption Rate: Indicates the rate at which new users become regular users. It measures the effectiveness of the onboarding processes.
- Active Users: The number of users interacting with the product within a specific timeframe. Defines how healthy your user base is in terms of engagement.
- Average Session Duration: Measures the average time users spend on the product during a session. It shows how engaged users are with your product.
- Customer Retention Rate: The percentage of customers who remain active over a specific period. It represents how good your product is at keeping customers active.
- Churn Rate: The rate at which customers stop using the product. It represents how many users are leaving your product.
Qualitative metrics
Qualitative metrics assess user opinions and sentiments about your product. It provides deeper insights into the user experience—the factors you can’t measure with numerical data.
These include:
- Customer Feedback: Direct responses from customers about their experience. They offer valuable insights into product strengths and weaknesses.
- Customer Reviews: Reviews that were written and published by customers. They serve as a way to understand what your product is doing right or wrong, as well as provide social proof.
- NPS Response Tags: It’s the categorizations of qualitative NPS survey responses. It can show common themes brought by detractors, as well as what drives customer loyalty.
- Customer Support Interactions: Tracks the frequency and nature of interactions with customer support. It indicates areas needing improvement.
Performance metrics
Performance metrics are quantitative data measurements that provide insights into how users interact with the product and the impact of those interactions on the sentiment of the users.
- Trial Sign-up Rate: The percentage of visitors or leads who sign up for a trial of the product, indicating initial interest.
- Customer Satisfaction Score (CSAT): Measures satisfaction levels among current users, often collected through surveys post-interaction.
- Net Promoter Score (NPS): Assesses overall customer satisfaction and loyalty, crucial for gauging brand strength.
- Referral Rate: The rate at which existing customers refer new customers, indicating satisfaction and product advocacy.
Attitudinal metrics
Attitudinal metrics gauge user attitudes toward a product. It can help you predict future behaviors, so you can build loyalty in the future.
These include:
- Customer Effort Score (CES): Assesses how much effort a customer must exert to perform tasks. It can directly measure the ease of use of a product, or even a specific feature.
- Customer Satisfaction Score (CSAT): Measures immediate customer satisfaction with an experience or service they just received. It can help you spot tasks, processes, or services that are not providing enough value to users.
- Trends Reports: Analyzes changes in customer behaviors over time. It helps you identify peaks in user activity and correlate them with specific campaigns.
- System Usability Scale (SUS): Provides a reliable tool to evaluate the usability of various aspects of a product. It serves as a direct way to measure how usable and accessible your product is.
- Usability Metric for User Experience (UMUX): Measures usability and user experience based on user feedback. It can tell you how users perceive your product.
Real user monitoring metrics
Real-user monitoring metrics capture user interactions in real time.
These include:
- Session Duration: The total time a user has spent in your app in one session. It indicates engagement levels.
- Click Tracking Data: Analyze where users click within an application. It can identify popular features and potential usability issues.
- Usability Testing: Empirical testing where users are observed using the product to identify usability problems and gather qualitative data.
How to measure user experience?
Now, you can’t just track every single metric we just covered—it’d do more harm than good.
These are the steps to measure user experience:
Decide on the metrics and KPIs you want to track
First, you need to decide what metrics you want to focus on based on your goals.
Do you need to increase in-app engagement or do you want to improve user sentiment around your product? These questions will determine the right metrics for you.
For this, a best practice is to follow a goal-setting framework like SMART (Specific, Measurable, Achievable, Relevant, and Time-bound) to align your goals with the results your business needs.
Choose a dedicated tool
After determining the right metrics for you, figure out what tools can help you track them most consistently.
For example, here are five great options you can adopt to start measuring user experience:
- Userpilot. Top-pick for measuring in-app user experience with advanced product analytics and surveys.
- Google Analytics. Default tool to track UX metrics on your website.
- Mixpanel. Excels particularly at user journey analytics, as it has cross-platform analytics which allows you to track how users move between your native apps, mobile apps, and web pages.
- Amplitude. It’s particularly good at tracking users’ real-time interactions, which means you’ll always be looking at the most current information.
- Appcues. Great option for tracking the user experience of mobile apps.
Measure and improve
Once you start to collect customer data, you can identify areas where engagement is high or low.
This allows you to improve and iterate your user experience strategies depending on what your metrics show—and get closer to your goals.
When to measure UX success?
What’s the best time to measure the user experience? Let’s go over four essential instances where you should do some tracking:
During customer onboarding
Customer onboarding is the first real interaction users have with your product.
Here, you can calculate task success rate or time to activation, and collect user feedback to identify if users understand your product’s core features. It’s the perfect moment to gauge early user engagement and adjust as needed to ensure a clean user experience.

Before the trial ends
The period before a trial ends is critical, it’s the point where users considering upgrading to a plan are more likely to make a decision.
Tracking user engagement, feature usage, and overall satisfaction during this phase can provide insights into what might persuade users to convert into paying customers.
You can also take it as an opportunity to collect direct feedback, here’s an example:

After users interact with a certain feature
Measuring UX after users interact with a specific feature can reveal how that feature is perceived and how well it meets the needs of your users.
You can analyze data such as feature usage frequency, user satisfaction with a feature, and performance metrics. This way, you can identify whether the feature is adding value or if it needs refinement.

After support-user interaction
Asking users for feedback after interactions with support teams provides insights into how these interactions affect overall user satisfaction.
For example, you can trigger CSAT or NPS survey post-support interactions to evaluate how your team resolves user issues and how efficient they are.

How to measure user experience in-app with Userpilot
Userpilot is a product management tool that not only helps you watch over your data but also provides multiple ways to collect both behavioral data and user feedback.
Here’s what you can get from Userpilot:

- Tag NPS responses to find common keywords among detractors or promoters.

- Product analytics dashboards to watch over your app’s performance, including DAUs, MAUs, and conversion rates.

- Feature tags and event-tracking to monitor user behaviors. As well as feature heatmaps to understand product adoption.

- Look at individual profiles to analyze when and for how long they log into your app.

- Trend reports can tell what strategies are bringing value to your user base.

Conclusion
In SaaS, learning how to measure user experience is indispensable for understanding how your users interact with your product. It provides actionable data that can guide you to improve your product’s relevance, competitiveness, and profitability.
But remember, you need the right tool to unlock these valuable insights. So why not book a Userpilot demo to see how you can unlock new opportunities to improve UX?
![]()
Try Userpilot and Take Your User Experience to the Next Level

