Analytics For Product Managers: What to Track and How to Act Upon Data
Is there such a thing as analytics for product managers? Data analytics is a must for every team in a SaaS company if you want to make decisions based on data.
This article explicitly explains what metrics are essential to product management teams and how to collect the data.
Keep reading for the good stuff!
TL;DR
- Product analytics is about collecting and analyzing user interactions across the product to understand what drives product adoption and long-term retention.
- With product analytics, product teams are able to understand and address true customers’ needs and pain points and spot product friction.
- Product analytics helps product managers determine how many customers are using their products and what obstacles the average user encounters throughout the road. It also gives an understanding of how sticky the product is.
- It helps understand product engagement trends across different cohorts to find patterns, make informed decisions based on the data, and test new features and product experiences.
- The product management team should collect and act on product engagement, activation, adoption, and retention metrics.
- The product manager or data scientists use analytics tools to perform behavioral analysis and segment customers based on shared traits to perform an in-depth analysis.
- Conduct a cohort analysis to see what a subsection of your users is doing with your software at a certain period.
- Funnel analysis will answer questions like how many users have completed the onboarding flow and where they drop off.
- Userpilot offers a complete product analytics (and engagement) tool to aid product managers in achieving remarkable metrics. Book a demo to learn more.
Userpilot: The Ultimate Growth Tool for Product Managers

What is product analytics?
Product analytics is about collecting and analyzing user interactions across the product in an effort to understand what drives product adoption and long-term retention. It enables product teams to understand and address true customers’ needs and pain points and spot product friction.
Product management analytics lead to improved retention and conversation rates, resulting in revenue growth.
The typical questions product analytics answer are:
- What actions do users take? And why?
- How much time do they spend with the product?
- What is the churn rate, and how to decrease it?
- What features to develop to get a larger market share by satisfying customers?
How do product analytics differ from marketing analytics?
Marketing analytics only explain the first step in the user journey. It draws insights into how visitors engage with the site and what marketing messages and channels attract relevant user segments.
Marketing teams aim to understand what converts customers and how to convert as many as possible.
Marketers rely on Google Analytics, Google Search Console, and other data visualization tools to analyze the first step in the user journey.
Likewise, product management analytics focuses on user engagement throughout the entire customer journey. It aims to understand what features users like/dislike and their customer experience.
The primary goal is to gather tons of information to build a product-led company, delivering the best solutions to the market’s needs.
How data analytics can help product managers
In short, data analysis enables companies to make data-driven business decisions on further product development to ensure product-market fit.
Let’s discover more benefits of product management analytics.
Product analytics help product managers determine how people are using their products
To do so, an analytics product manager relies on tracking specific user events. This translates into understanding how users use the product:
- Which features are used or get abandoned?
- What is the user workflow?
- Are newly introduced features quickly adopted or not?
To track these analytics, product managers rely on analytics platforms (like Userpilot) to collect and analyze data. For example, you can set up custom events to collect data on completed milestones in feature adoption and the frequency of feature usage.
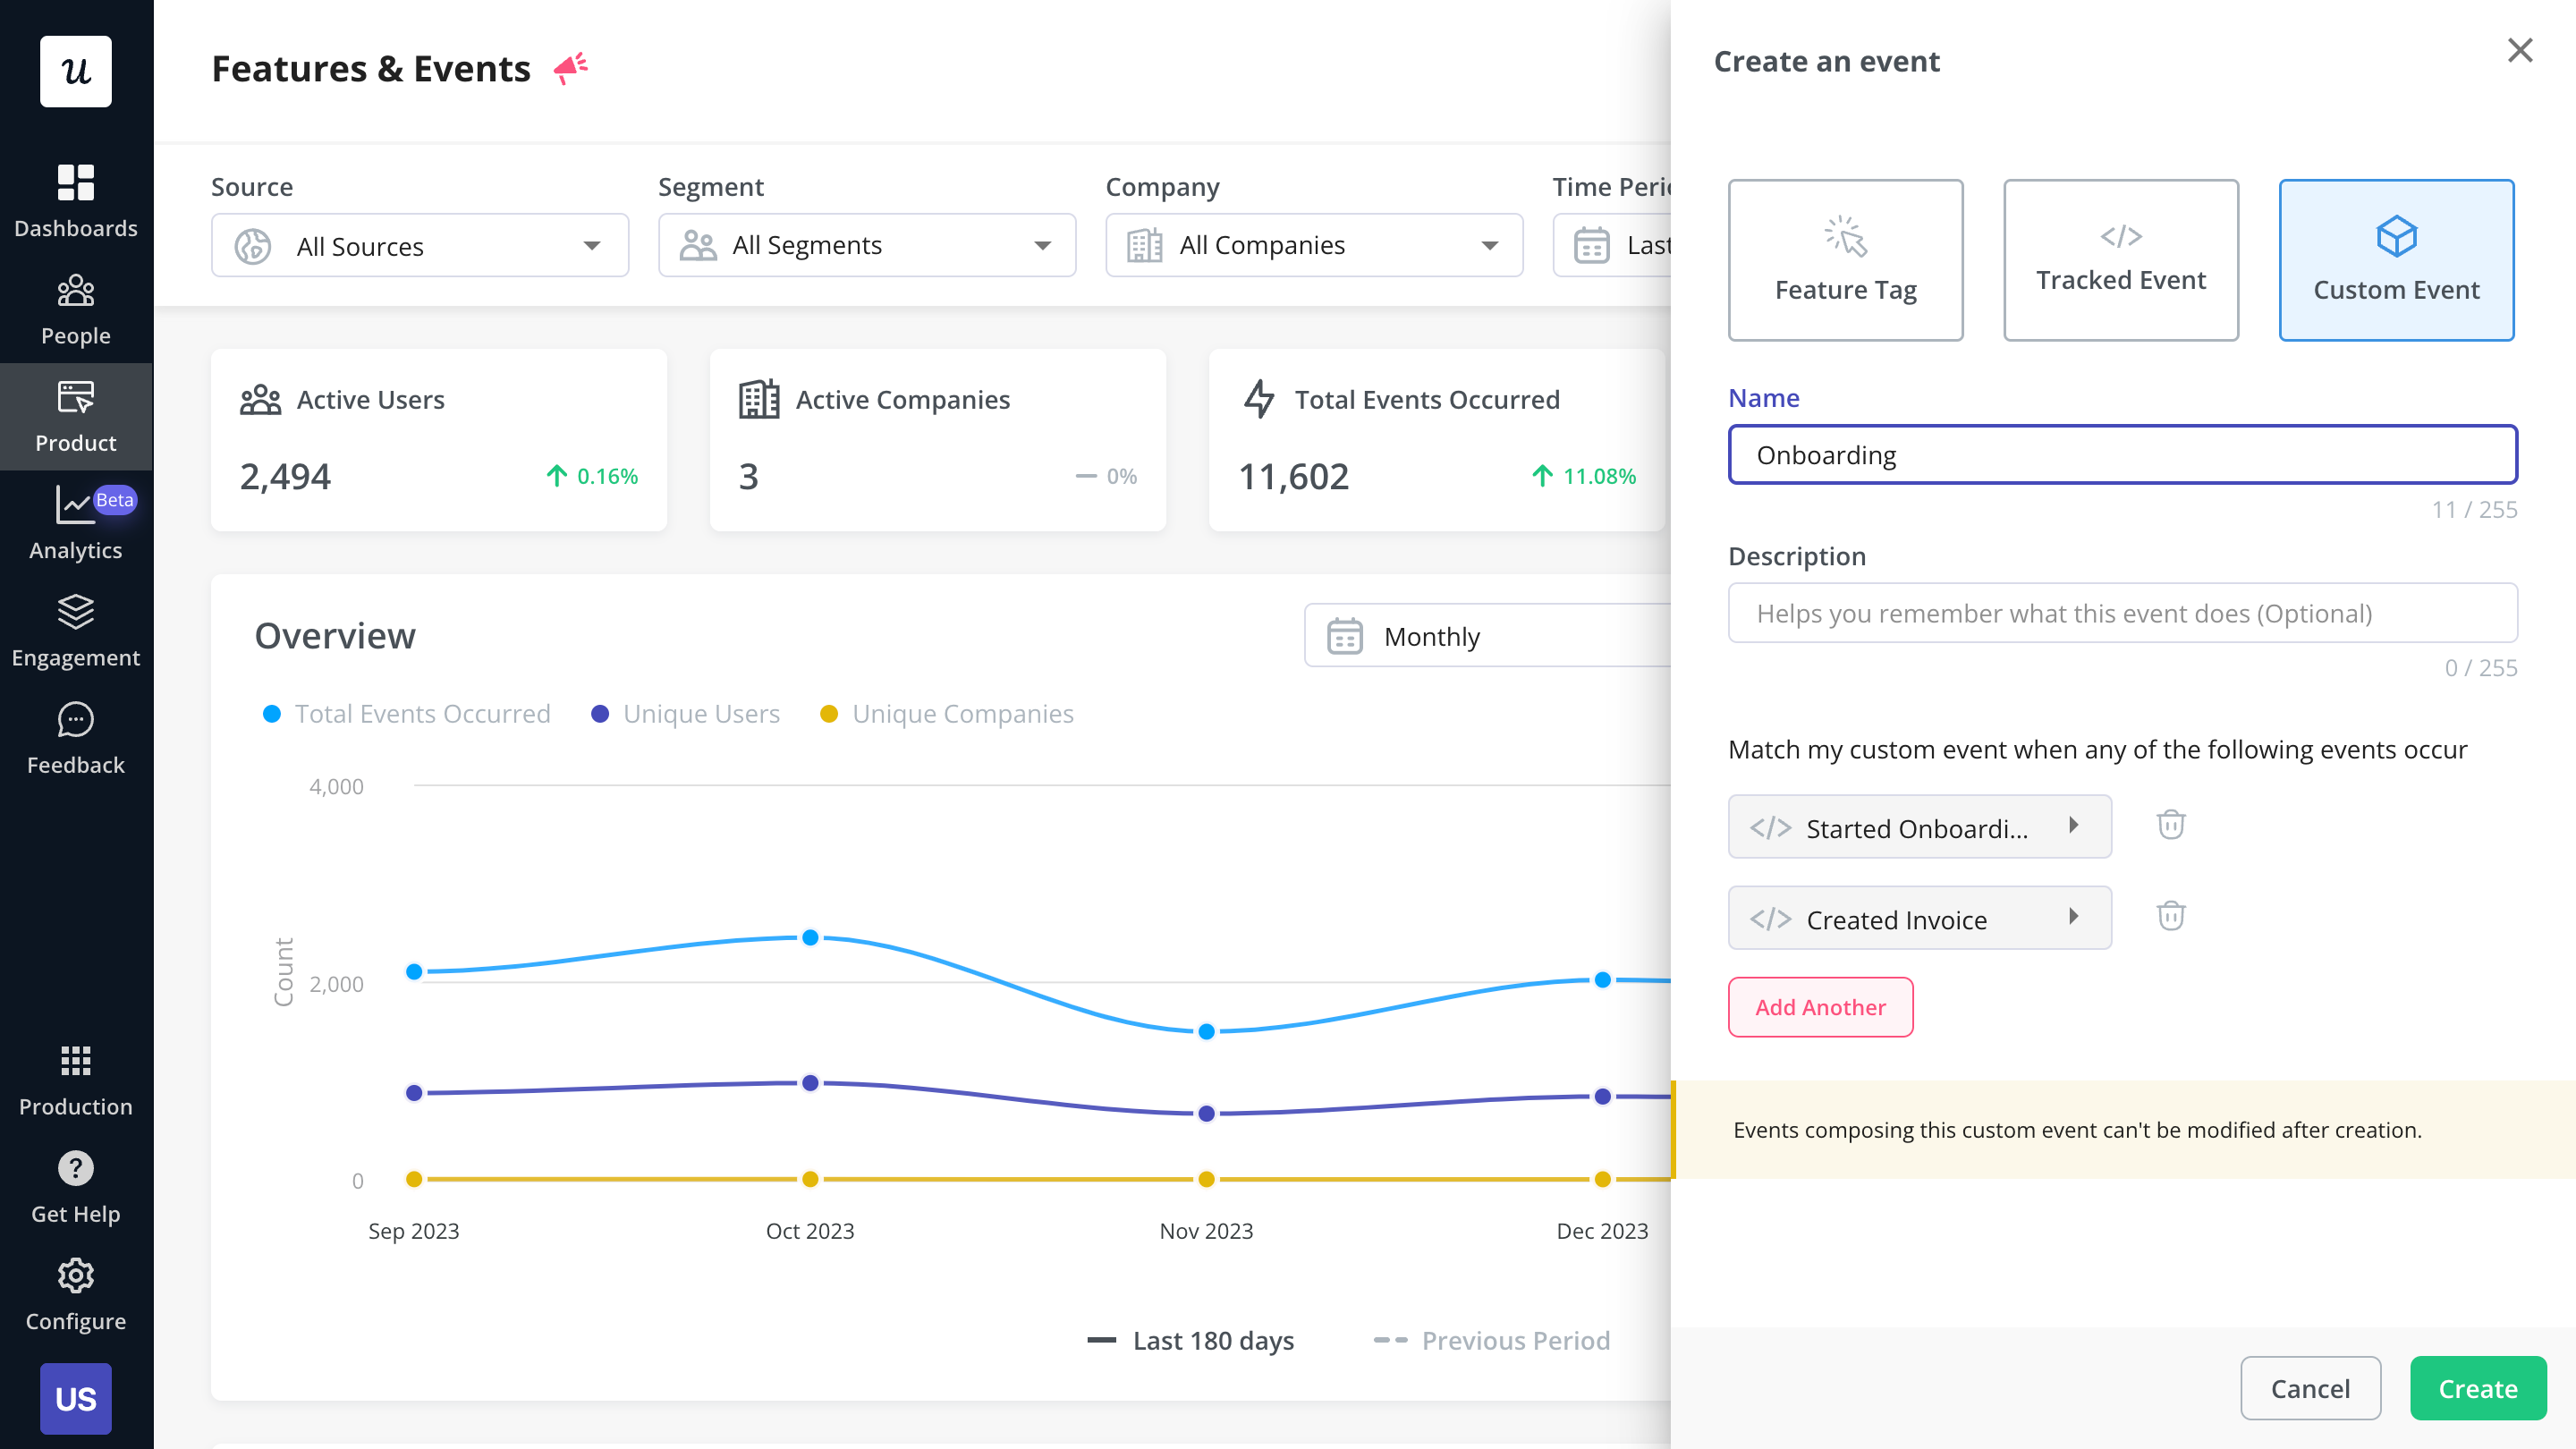
Custom events in Userpilot
Product analytics’ retention metrics can tell product managers how sticky the product is
Customer retention is the metric that shows the percentage of recurrent customers (aka those who pay monthly and continue using your product).
For SaaS, it’s one of the vital product management analytics metrics that literally highlights whether businesses make it or break it.
Combine retention and usage metrics to understand how sticky your product is, and why.
Product analytics help product managers understand trends
Track how different user segments engage with the app and how this changes over time. And analyze product engagement across different cohorts over time to find patterns and make informed decisions based on the data.
For instance, you can learn that some features need to be sunset, or there are friction points in the customer journey that are causing churn and drop-offs.
What decisions can a product manager make based on product analytics?
Product analytics give product management teams insight into various aspects of the business and help them make data-driven decisions regarding questions like:
- What product tweak will lead to increased revenue?
- Which features are no longer of interest and practical use?
- What change in the onboarding flow will get users to complete product adoption faster?
- Why are some features getting abandoned?
- Do users follow the happy path?
- What customer segment drives the most revenue growth? What does their journey look like?
Tie customer insights with user analytics to drive product vision and impact key business results.
How can product managers track product analytics?
For analytics to make sense and guide your decisions, you need to combine insights, ask logical questions, and experiment with your data.
Create hypotheses, and test them to see how they work out in reality.
Here’s how product manager analytics helps with that.
Segmentation helps product managers perform an in-depth analysis of data
Customer segmentation is the process of grouping users by certain characteristics that they share (in-app behavior, sign-up date, goal, events).
For instance, needs-based customer segments allow you to compare how fast users of the cheapest plan adopt the product versus the enterprise ones.
You can see this by building segments based on the answers you collect through user feedback, and then tracking how each segment engages with your product. You can also conduct customer interviews from these segments to collect qualitative data to back the quantitative data from your analysis.
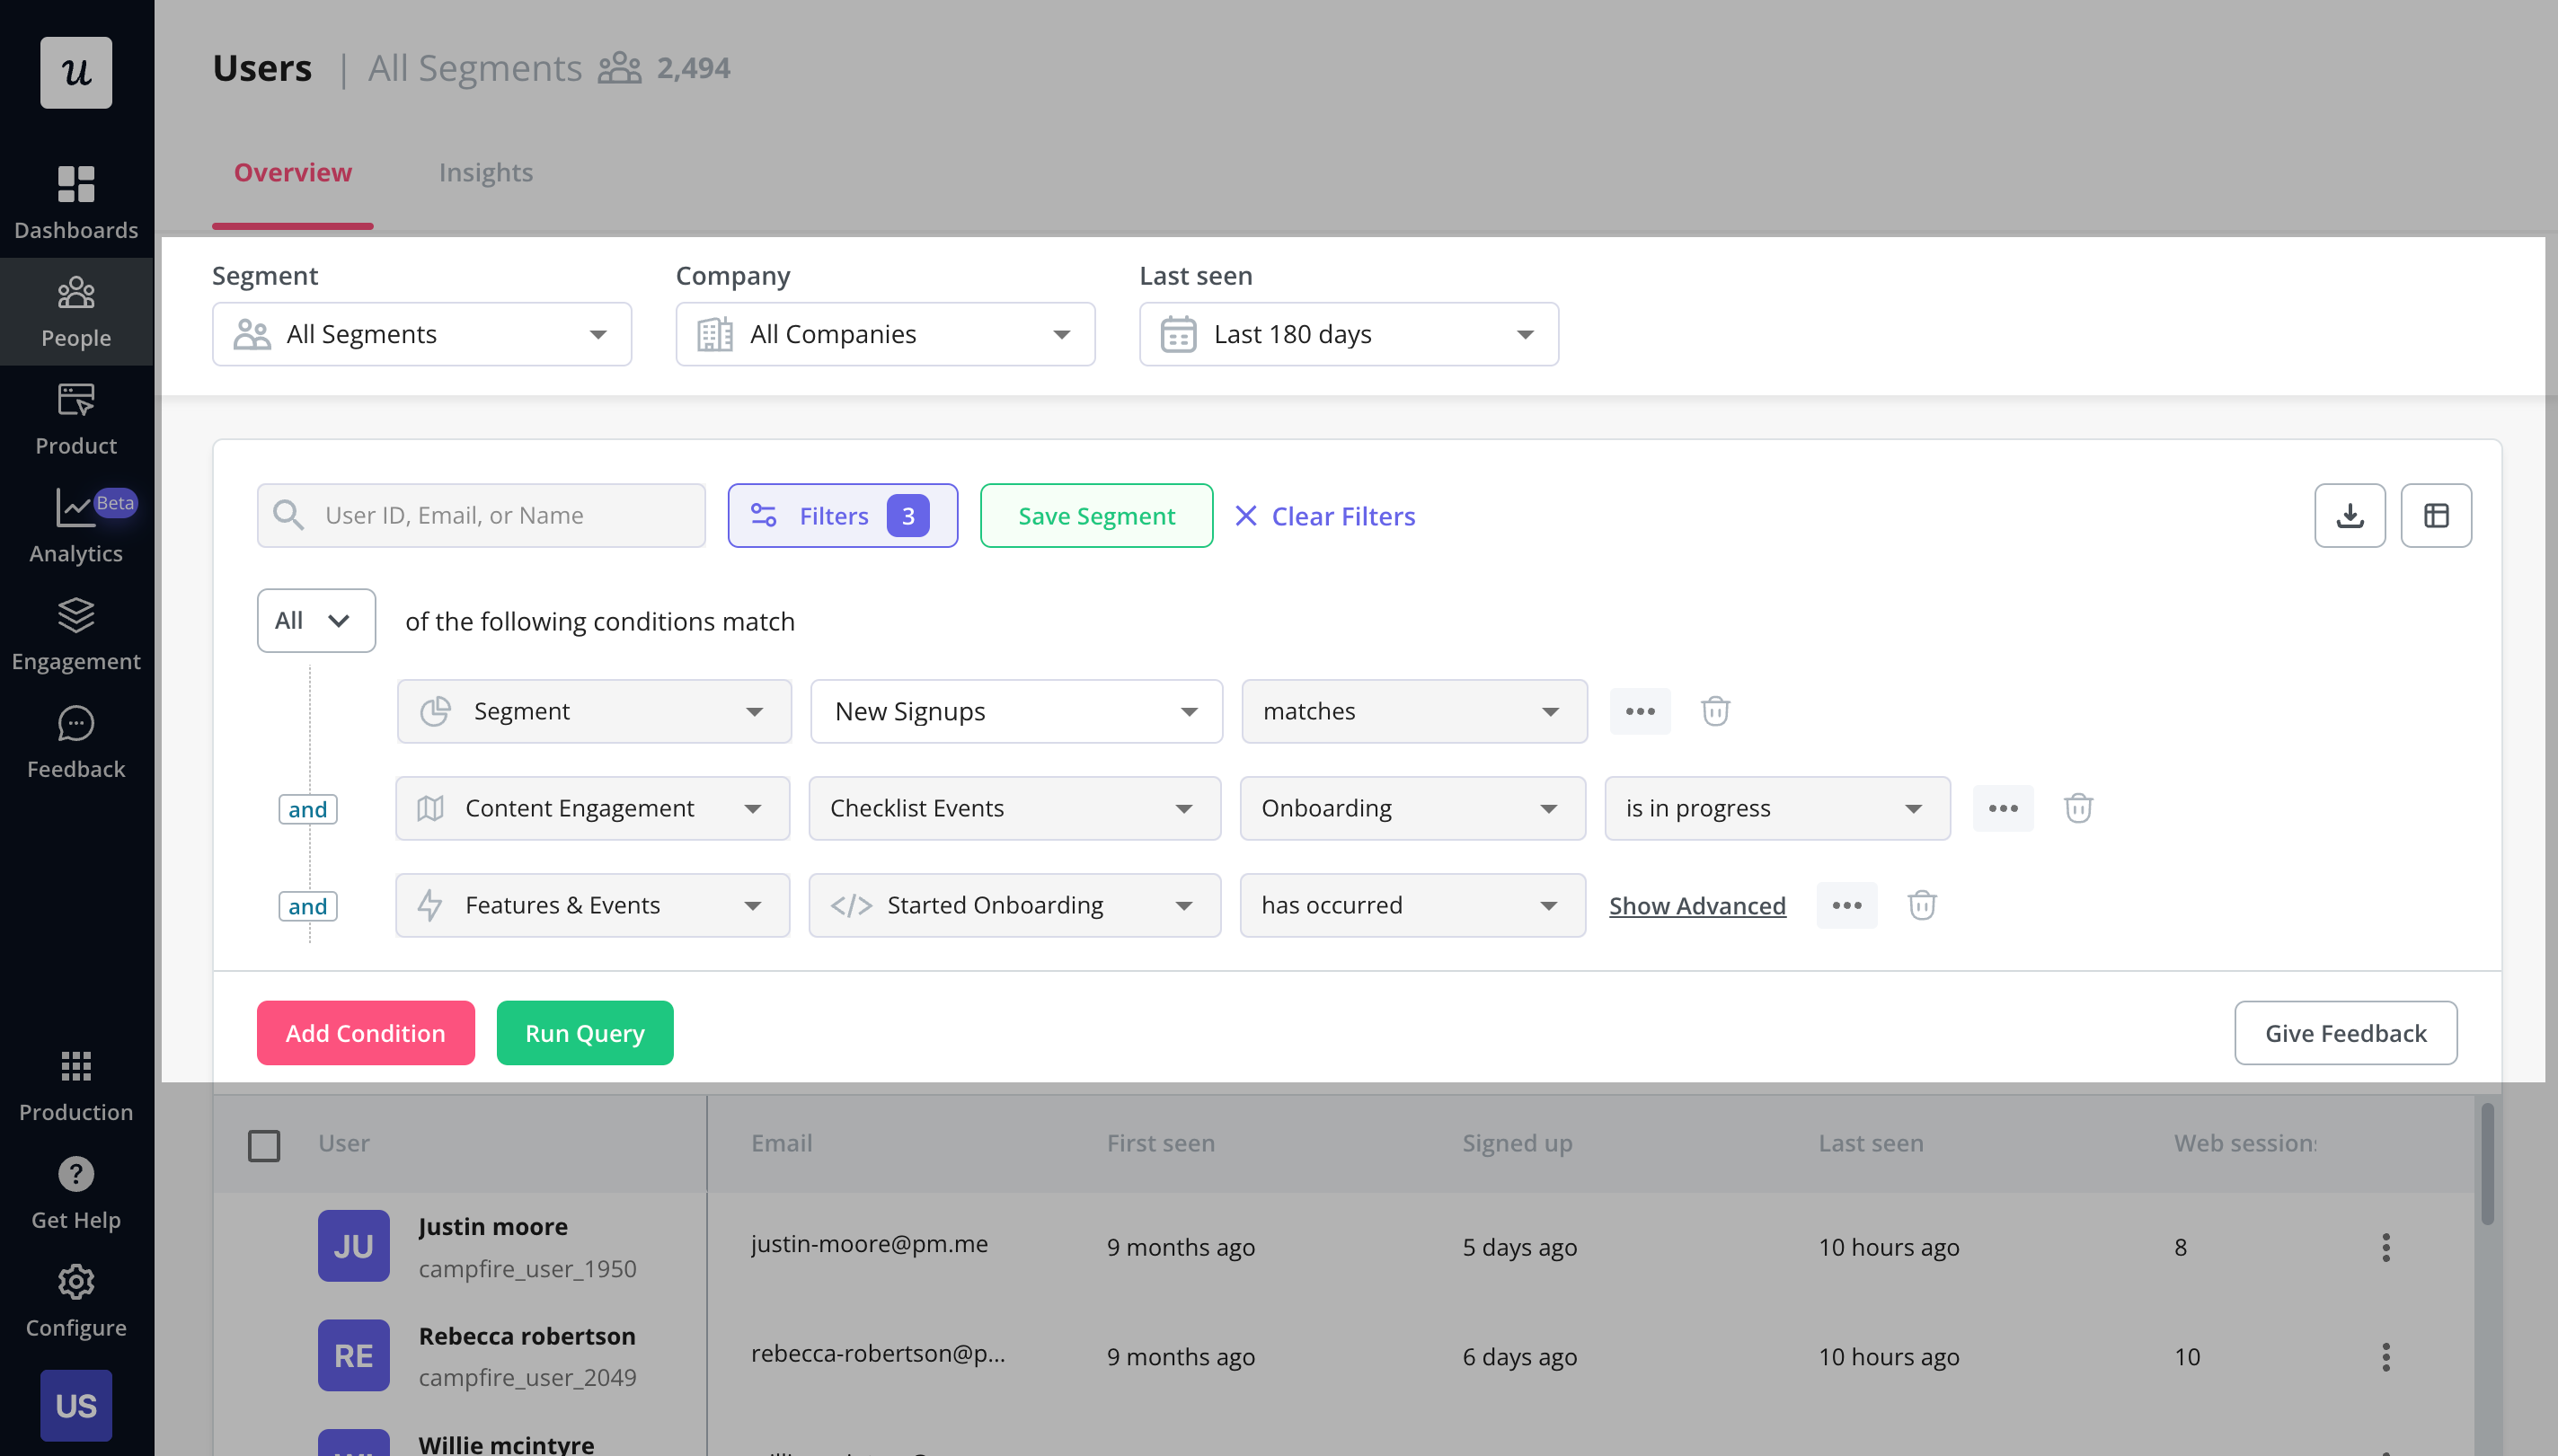
Segmentation in Userpilot
Cohort analysis gives granular insights into user behavior
Customer segments linked to a given period of time are called cohorts. Conduct a cohort analysis to see what a subsection of your users is doing with your software/tool at a certain time period.
There are two types of cohort analysis: absolute and relative. Absolute cohorts are created based on fixed groups of users. For example, those who completed product adoption within a week after you rolled out a new onboarding flow.
Relative cohorts analyze shifting groups of users (e.g., those who signed up within the past 15 days).
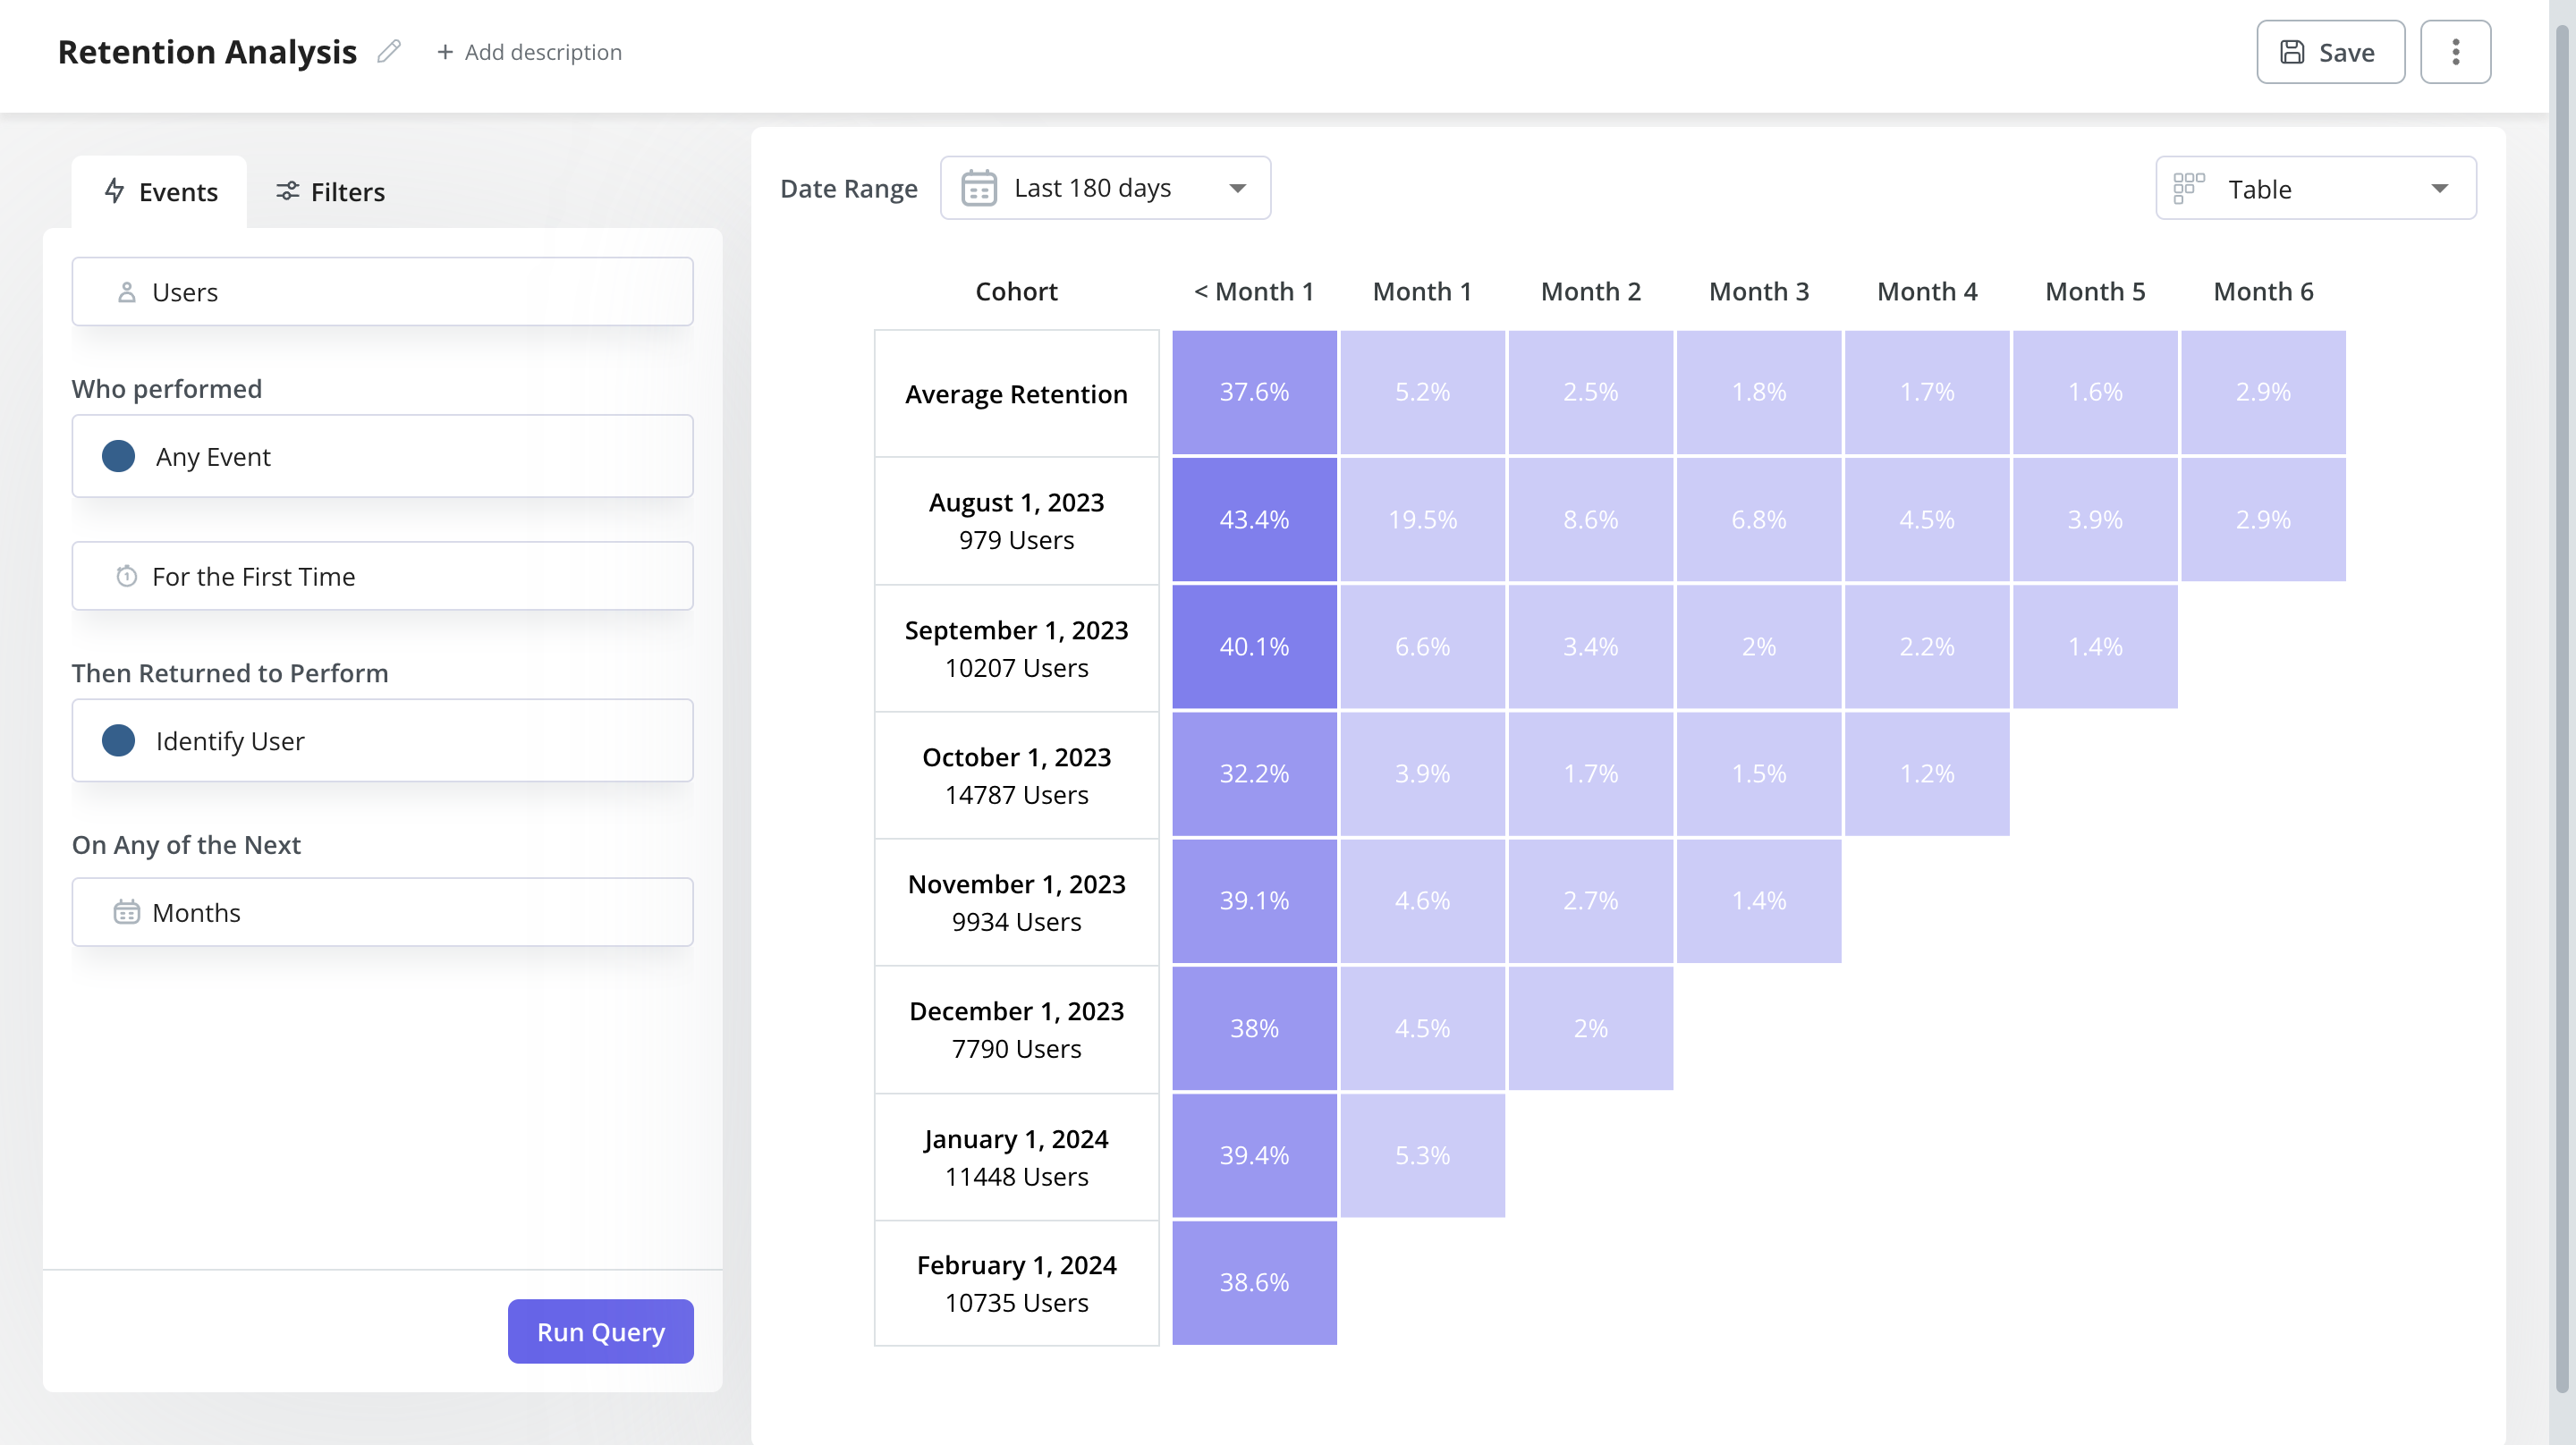
Cohort retention analysis in Userpilot
Funnel analysis helps reveal friction points
A funnel measures the steps that users take toward a specific goal. It also answers questions like how many users have completed the onboarding flow (activation funnel steps completed) and where they drop off.
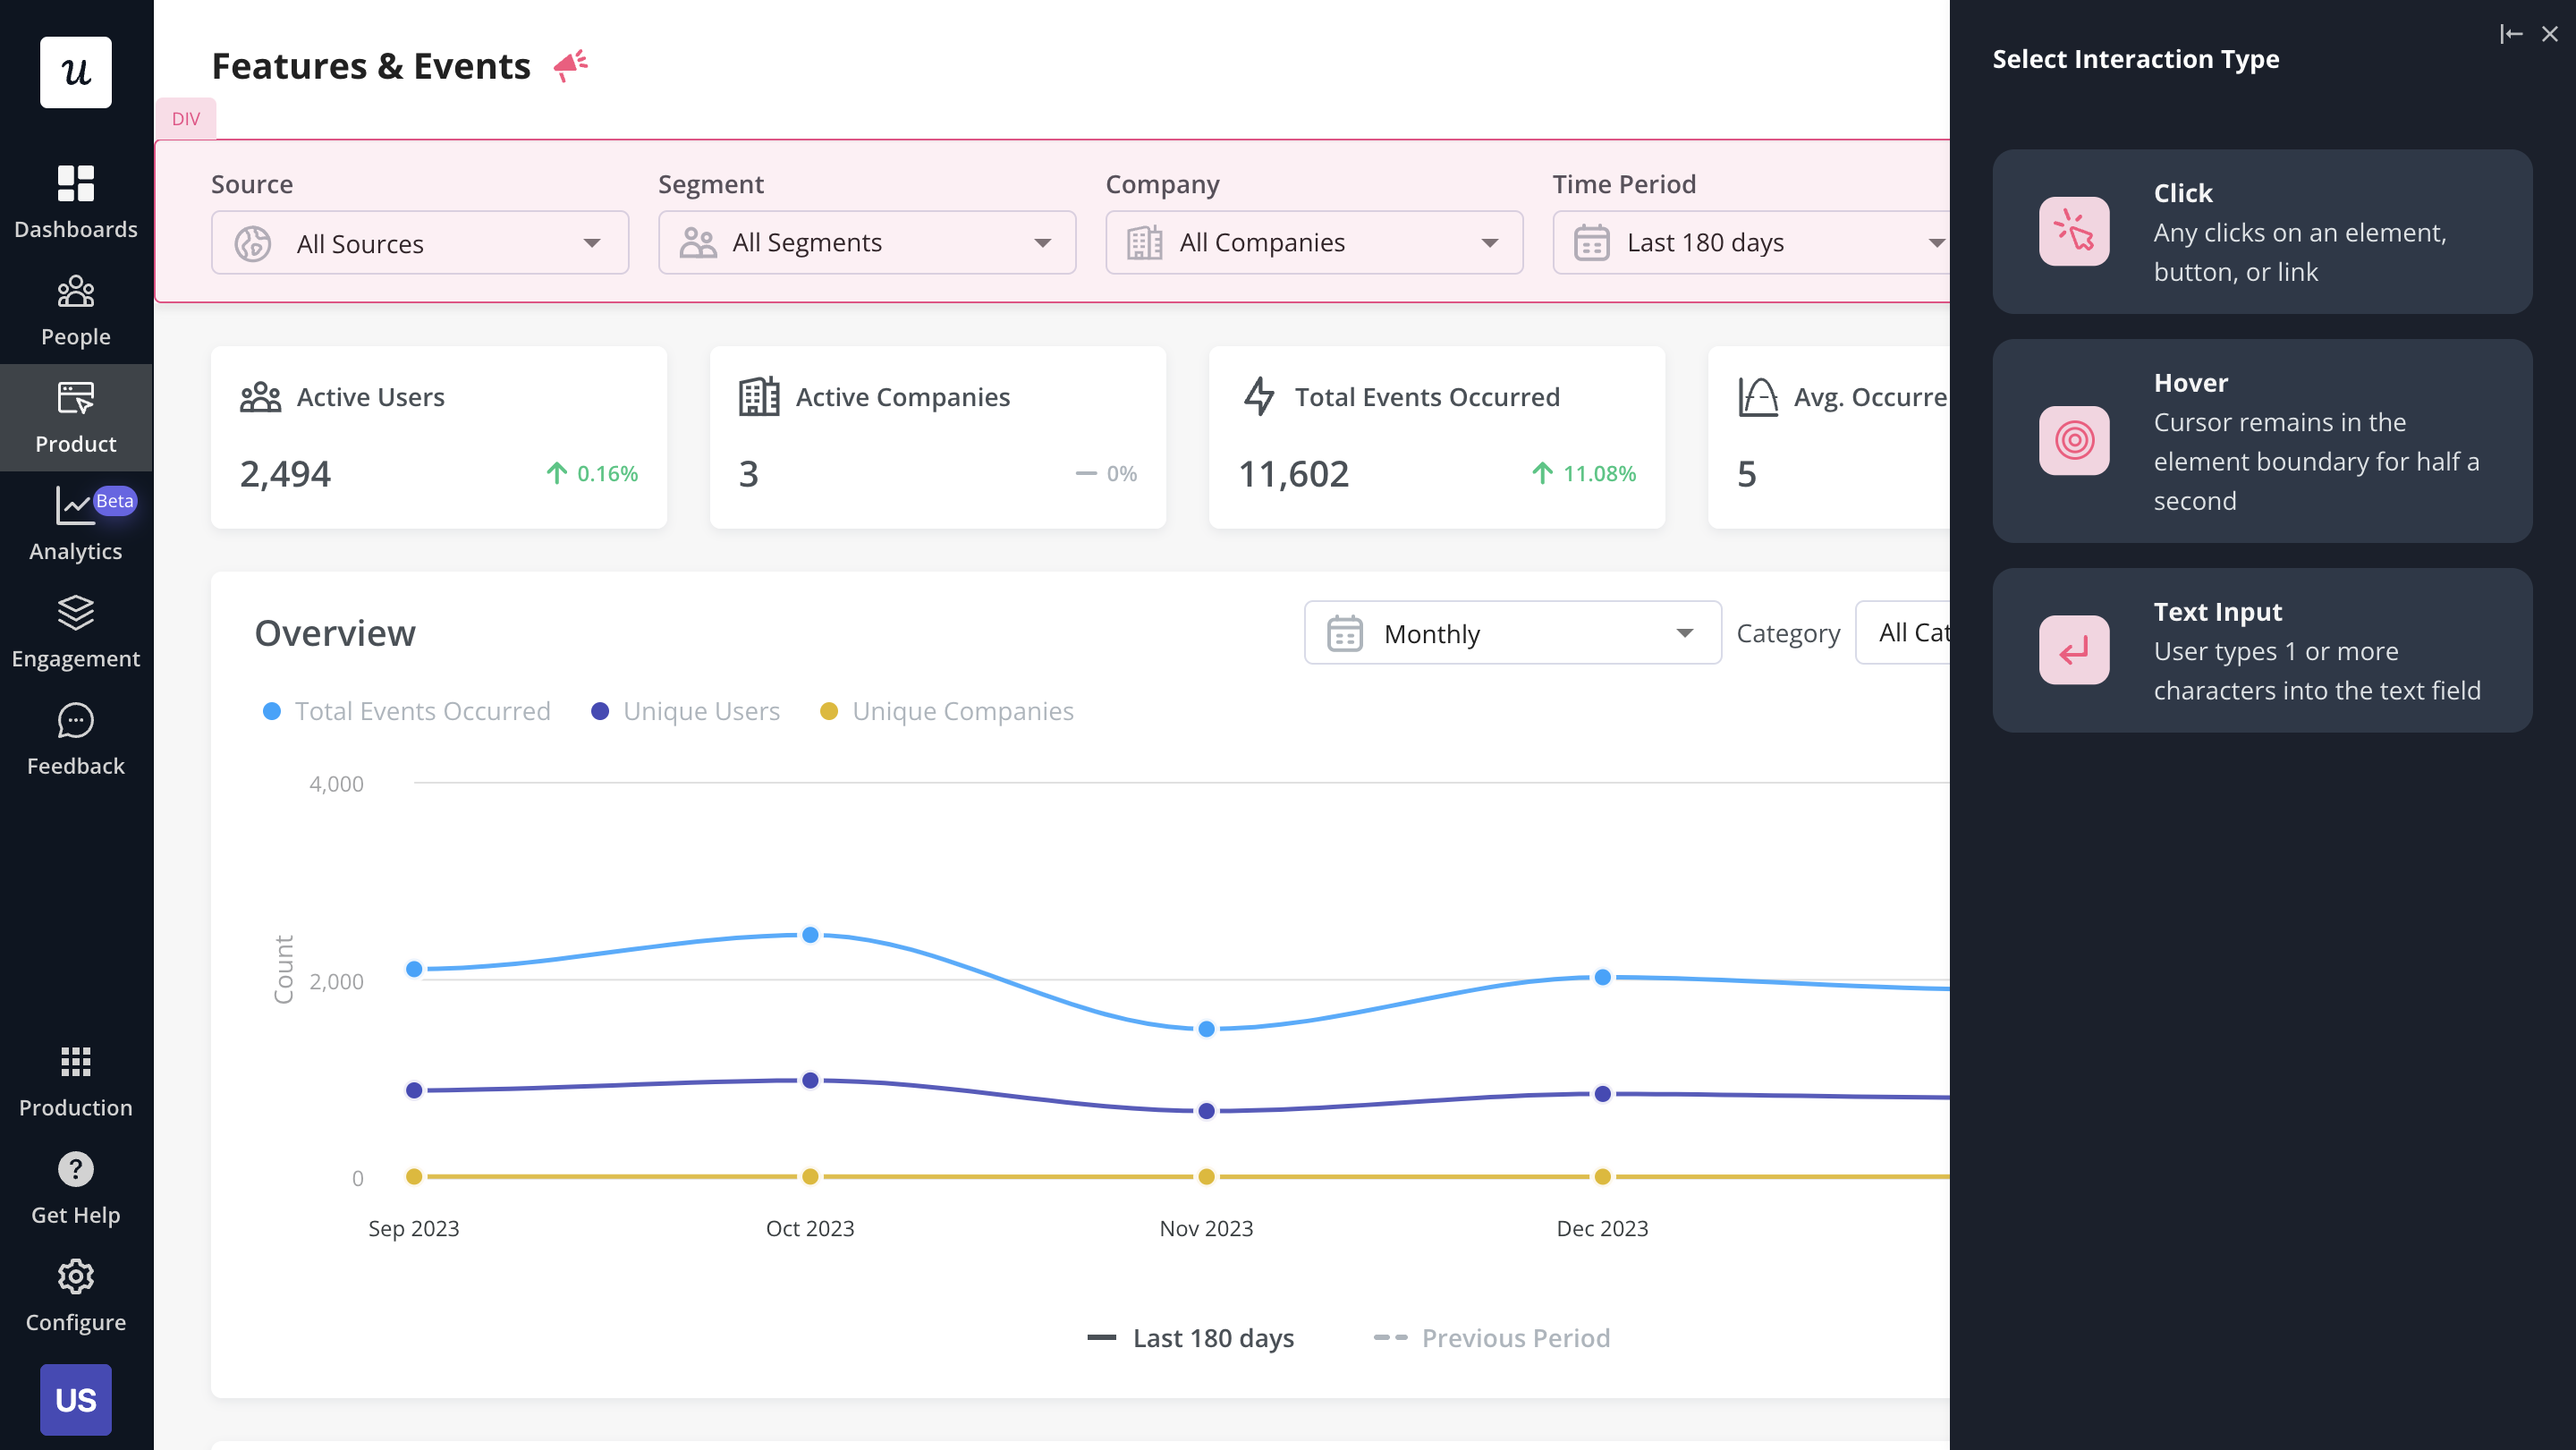
For instance, you can use Userpilot’s events to track user interactions across the product’s interface:
- Clicks
- Form fills
- Hovers
And you can tag these interactions as “features” directly using the Chrome Extension.
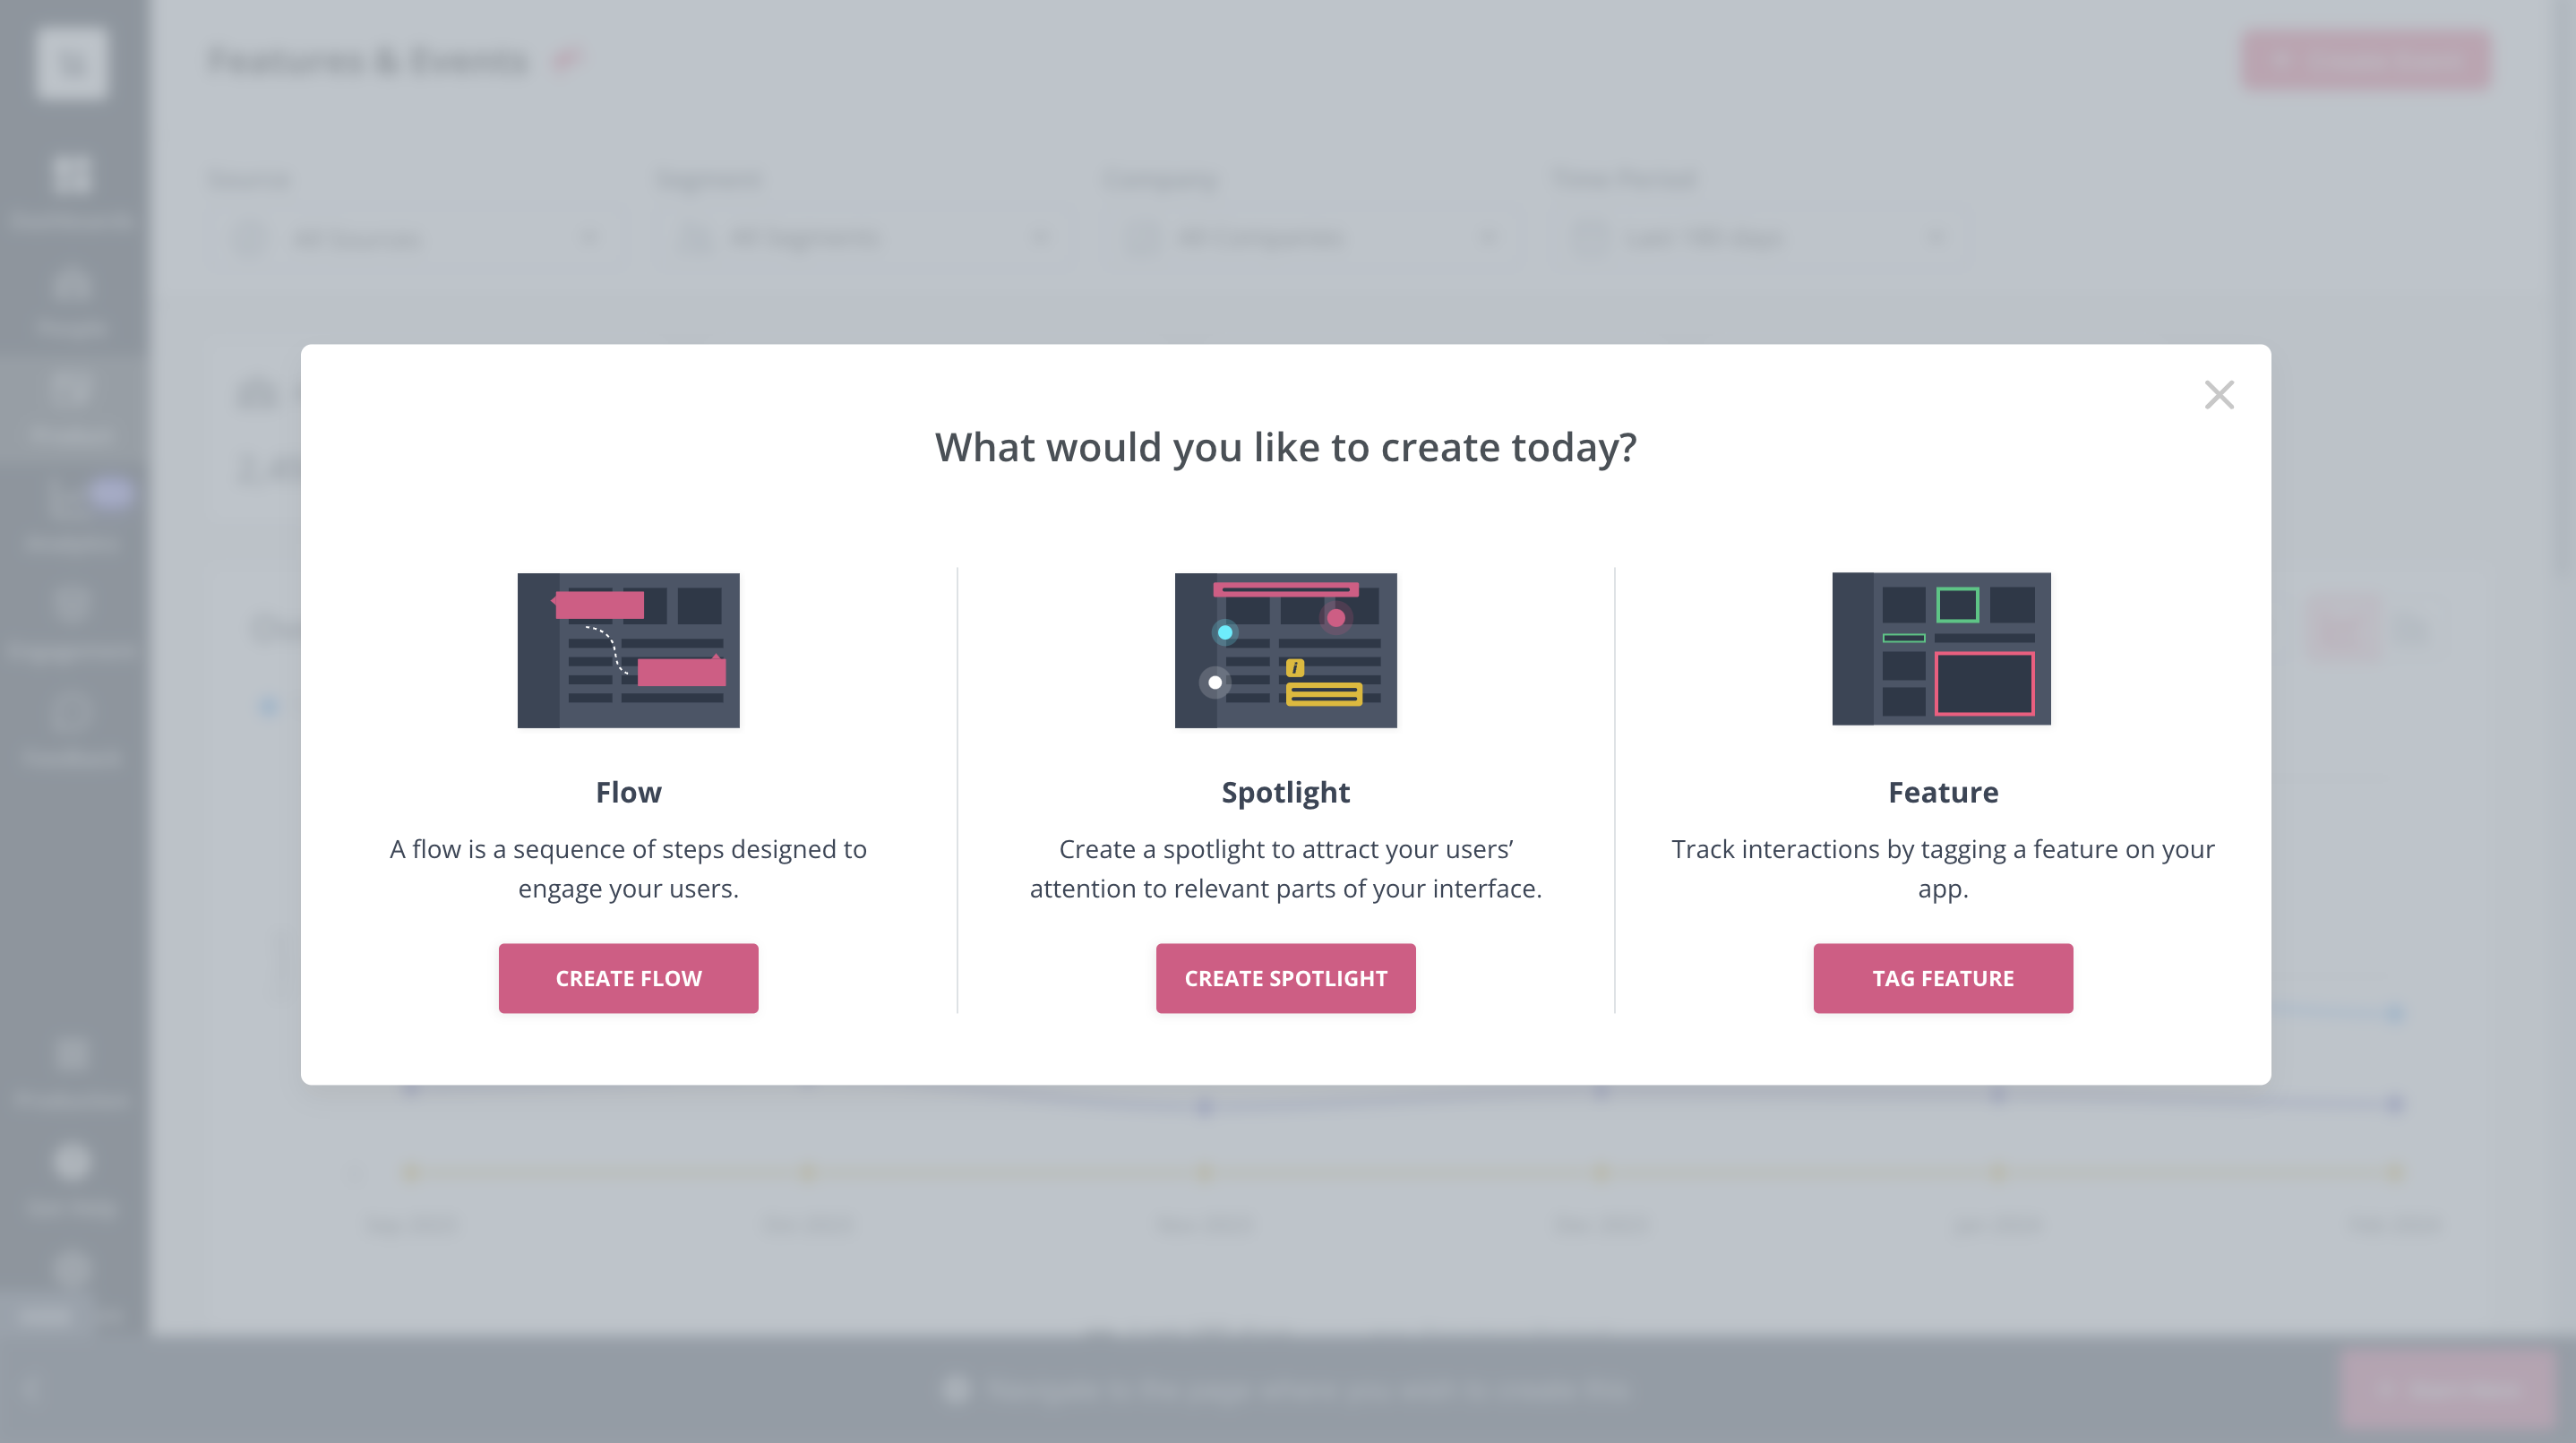
Build a flow, spotlight, or tag a feature with Userpilot.
Once you’ve set the features you want to track, it’s also possible to test them, so you can be sure you are tracking accurately.
You can then visualize these tagged interactions via funnel analysis and use that to identify friction and drop-off points.
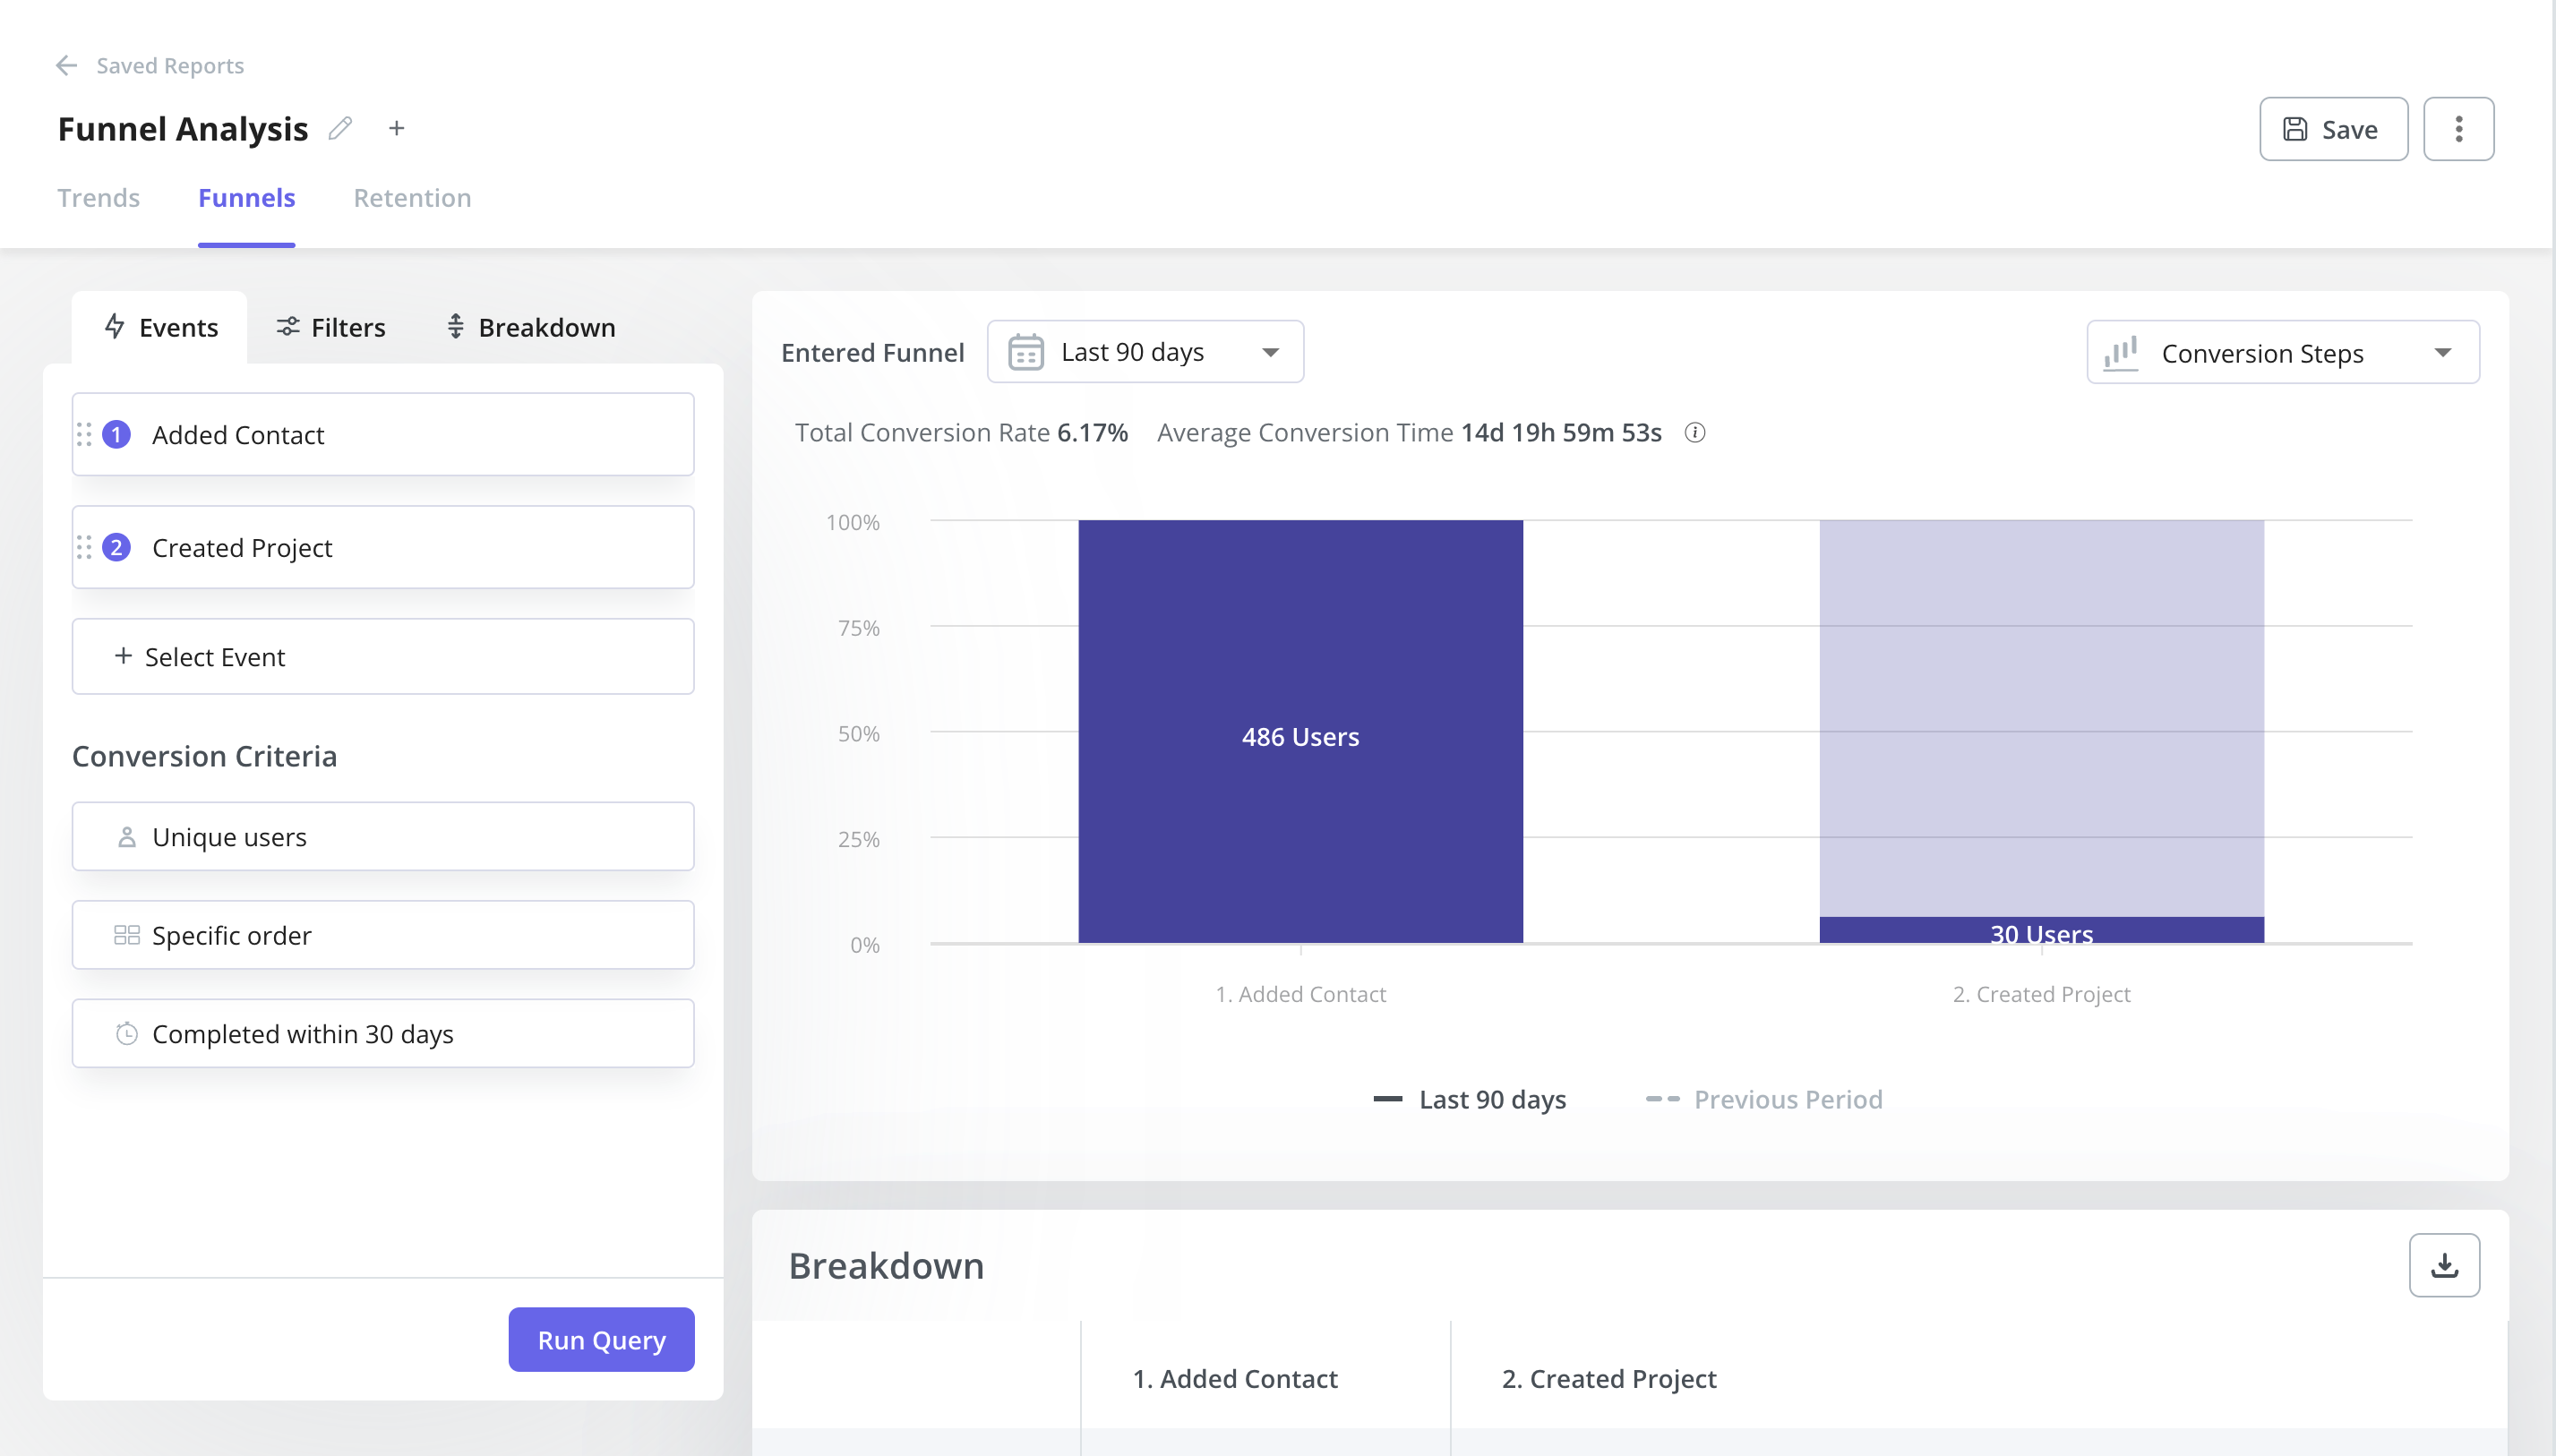
Funnel analysis in Userpilot
Behavioral analysis allows product managers to understand customers on a deeper level
Behavioral analysis is a strategy of grouping customers based on how they interact with your product. Product teams use behavioral analysis to improve in-app experiences and promote customer expansion.
It also helps to predict future customer behavior, monitor growth patterns, and discover what drives growth.
You can also use session recordings (coming to Userpilot in Q2 2024) to collect relevant data and determine which features are working and which can be improved.

Hotjar session recordings
Path analysis shows the ideal customer path to value
Path analysis helps product managers discover the different paths users take. You can use this technique to find the happy path, which is the shortest path to value. Once you figure this out, you can replicate it for other customer segments to drive them toward product success.
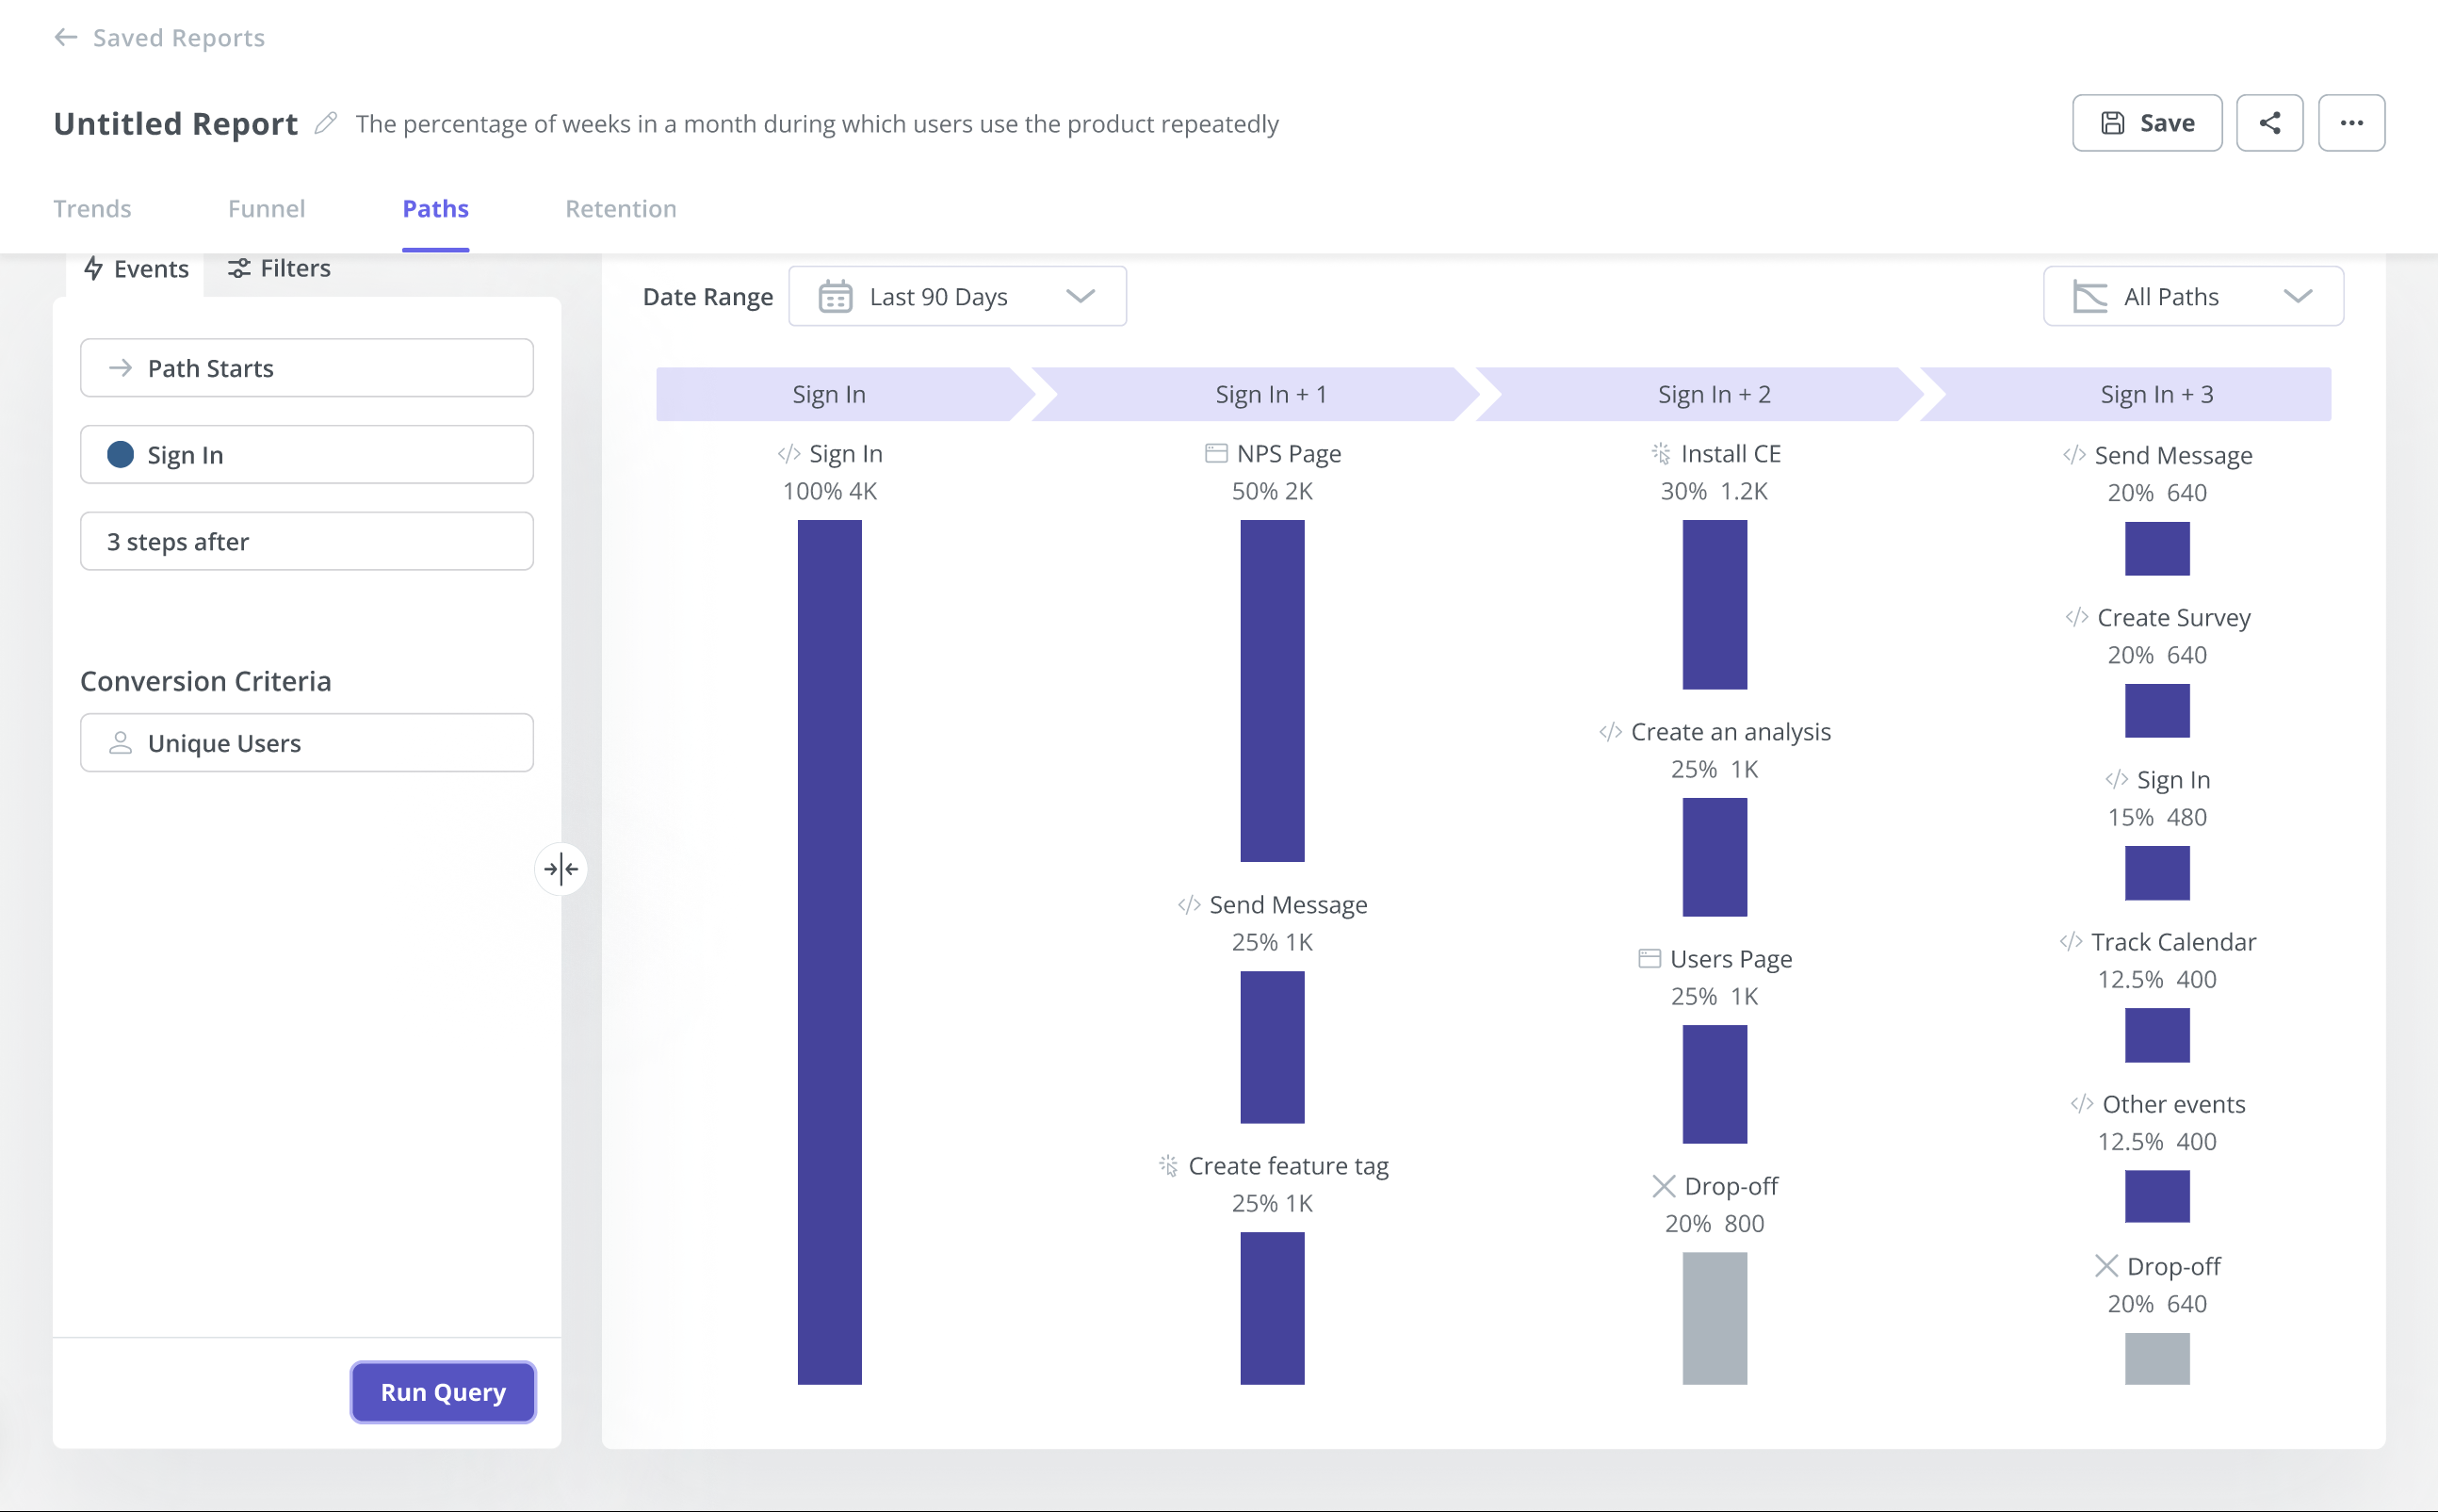
Path analysis in Userpilot
Product analytics to track to make data-driven decisions
It’s essential to understand and track the main product manager analytics metrics that move the needle. This section will talk about essential product metrics that boost business growth.
Let’s learn all of them.
Product engagement analytics and metrics
Product engagement analytics tell you what product features are popular, how much time users spend using your product, and whether users are getting value from the product.
You can use this analysis to improve your retention with:
- Interactive walkthroughs — guide your users through the product once they sign up. Personalized experiences based on user persona.
- In-app guides — explain to your users how to get the most value out of new features, filters, etc.
- Short checklists — prompt users to engage with particular features by giving them a set of actions.
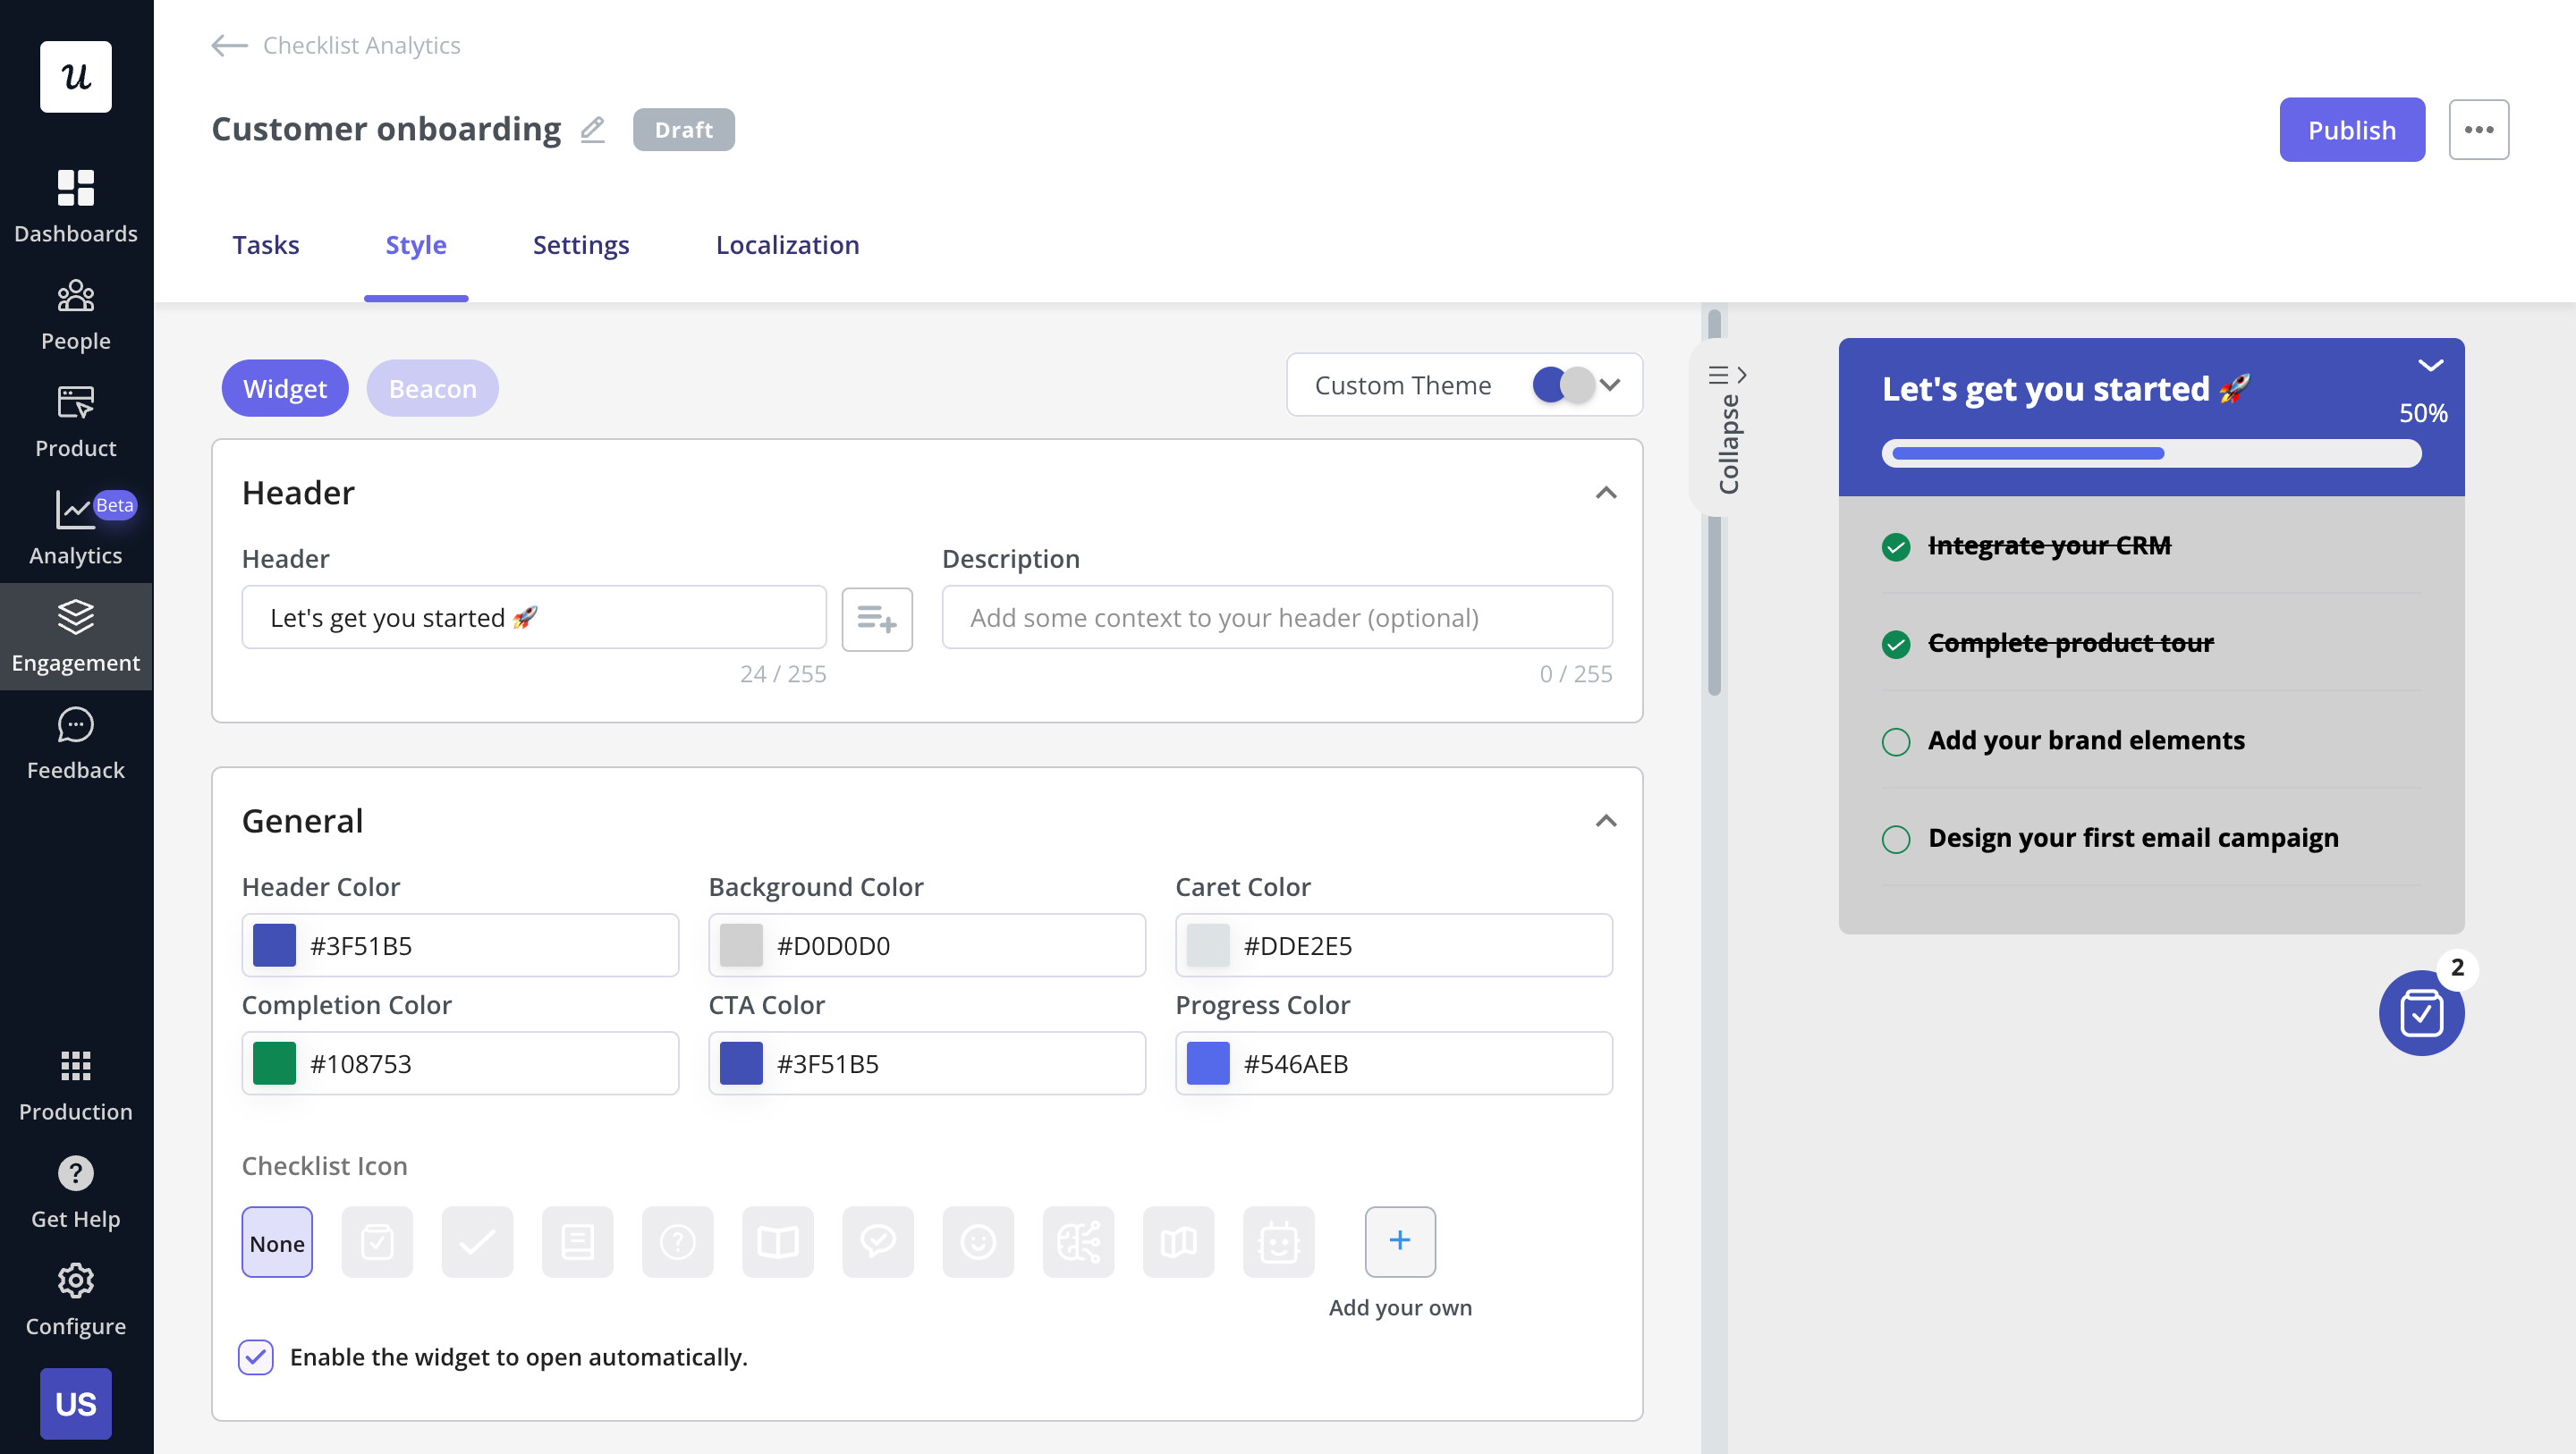
Onboarding checklist created in Userpilot
Here are several essential metrics of product engagement to keep an eye on:
- Customer churn rate — the percentage of users that terminate subscriptions to all paid users. High churn rates are a sign of unmet customer needs. Compare your churn rate against your engagement rate to find the pattern and act on it.
- NPS score (net promoter score) — a customer feedback survey that measures customer loyalty and satisfaction.
- Feature usage — gathers data on the most/least used features.
You can use Userpilot’s core feature engagement dashboard to view these metrics in a single place. You can always customize these dashboards to suit your needs.
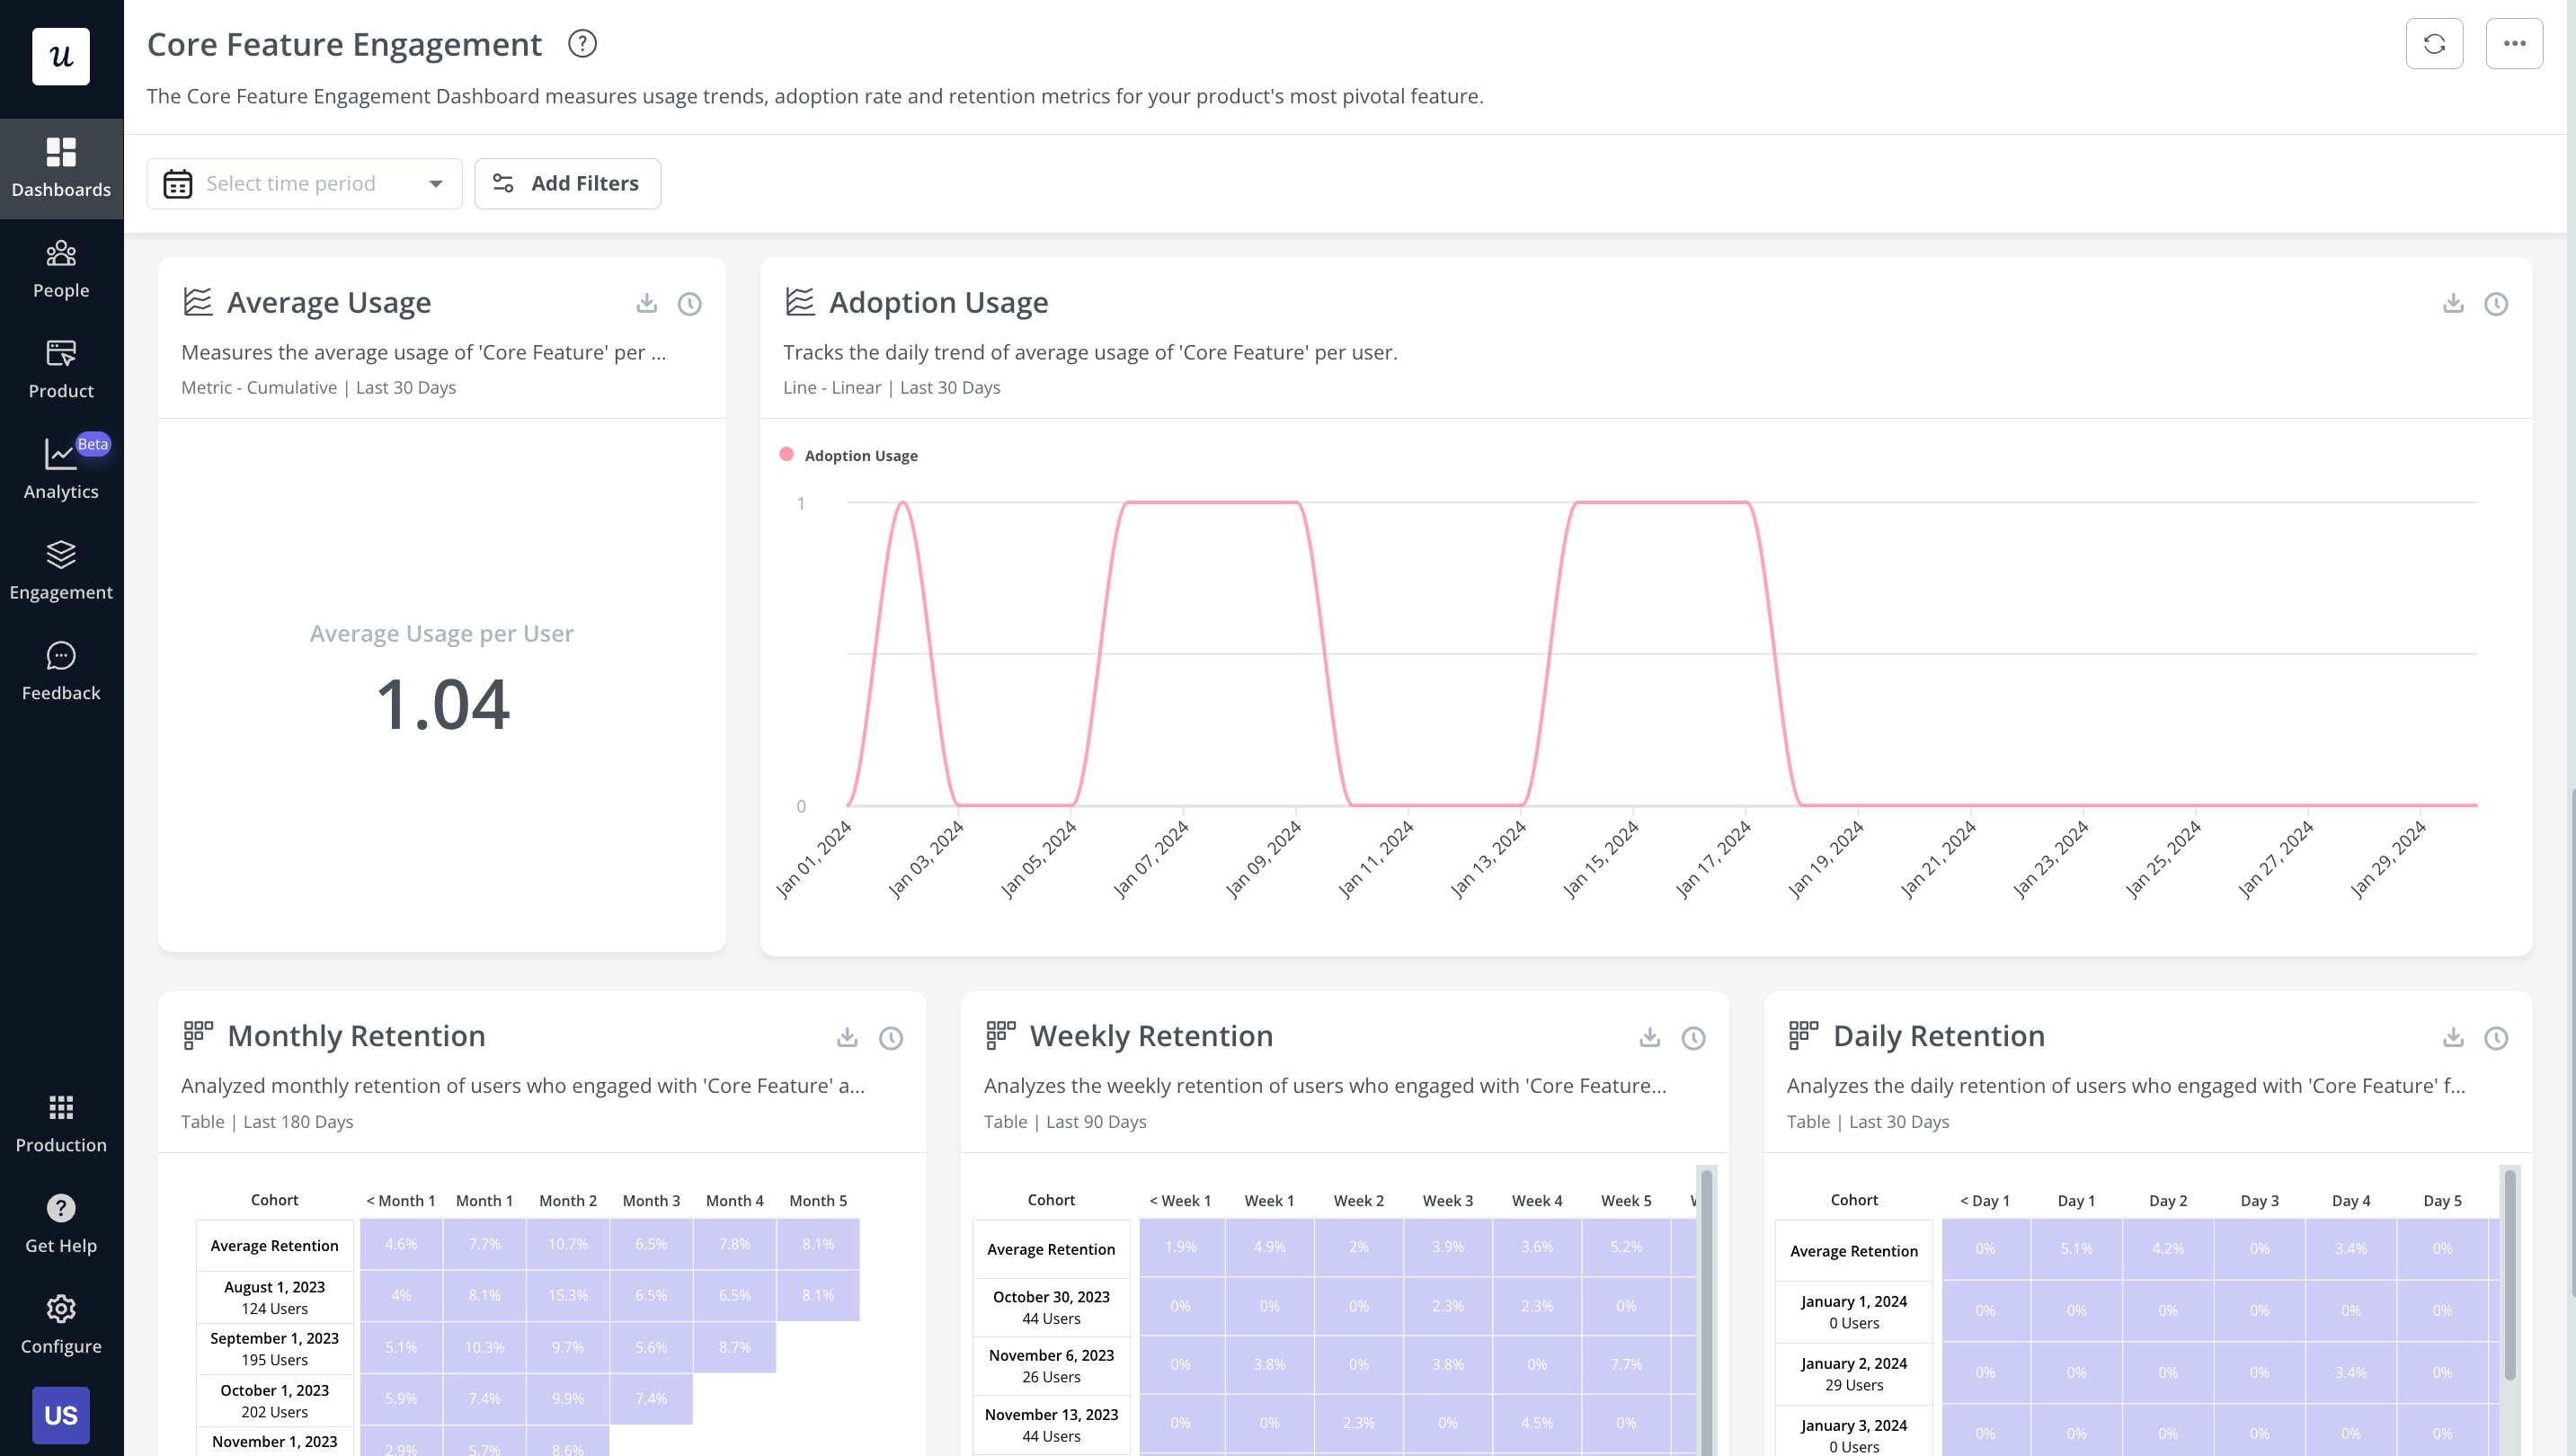
Core feature engagement dashboard
Product adoption analytics and metrics
Product adoption occurs when your users start using your product purposefully. In order to measure product adoption effectively, you need to understand the breadth, depth, and duration of feature adoption.
Some metrics needed to measure product adoption are:
- Feature adoption rate — the percentage of new customers that use a feature.
- Time-to-value — tracks the time it takes for a user to reach the “AHA moment.”
- Customer engagement score — indicates how engaged your customers and free trial prospects are.
- Activation rate — measures the number of users reaching the activation point in the user journey.
- Product-qualified leads (PQLs) — how many active users have experienced the value of the product? These may likely become paying customers.
Userpilot’s product usage dashboard shows product managers all relevant metrics to make data-driven decisions.
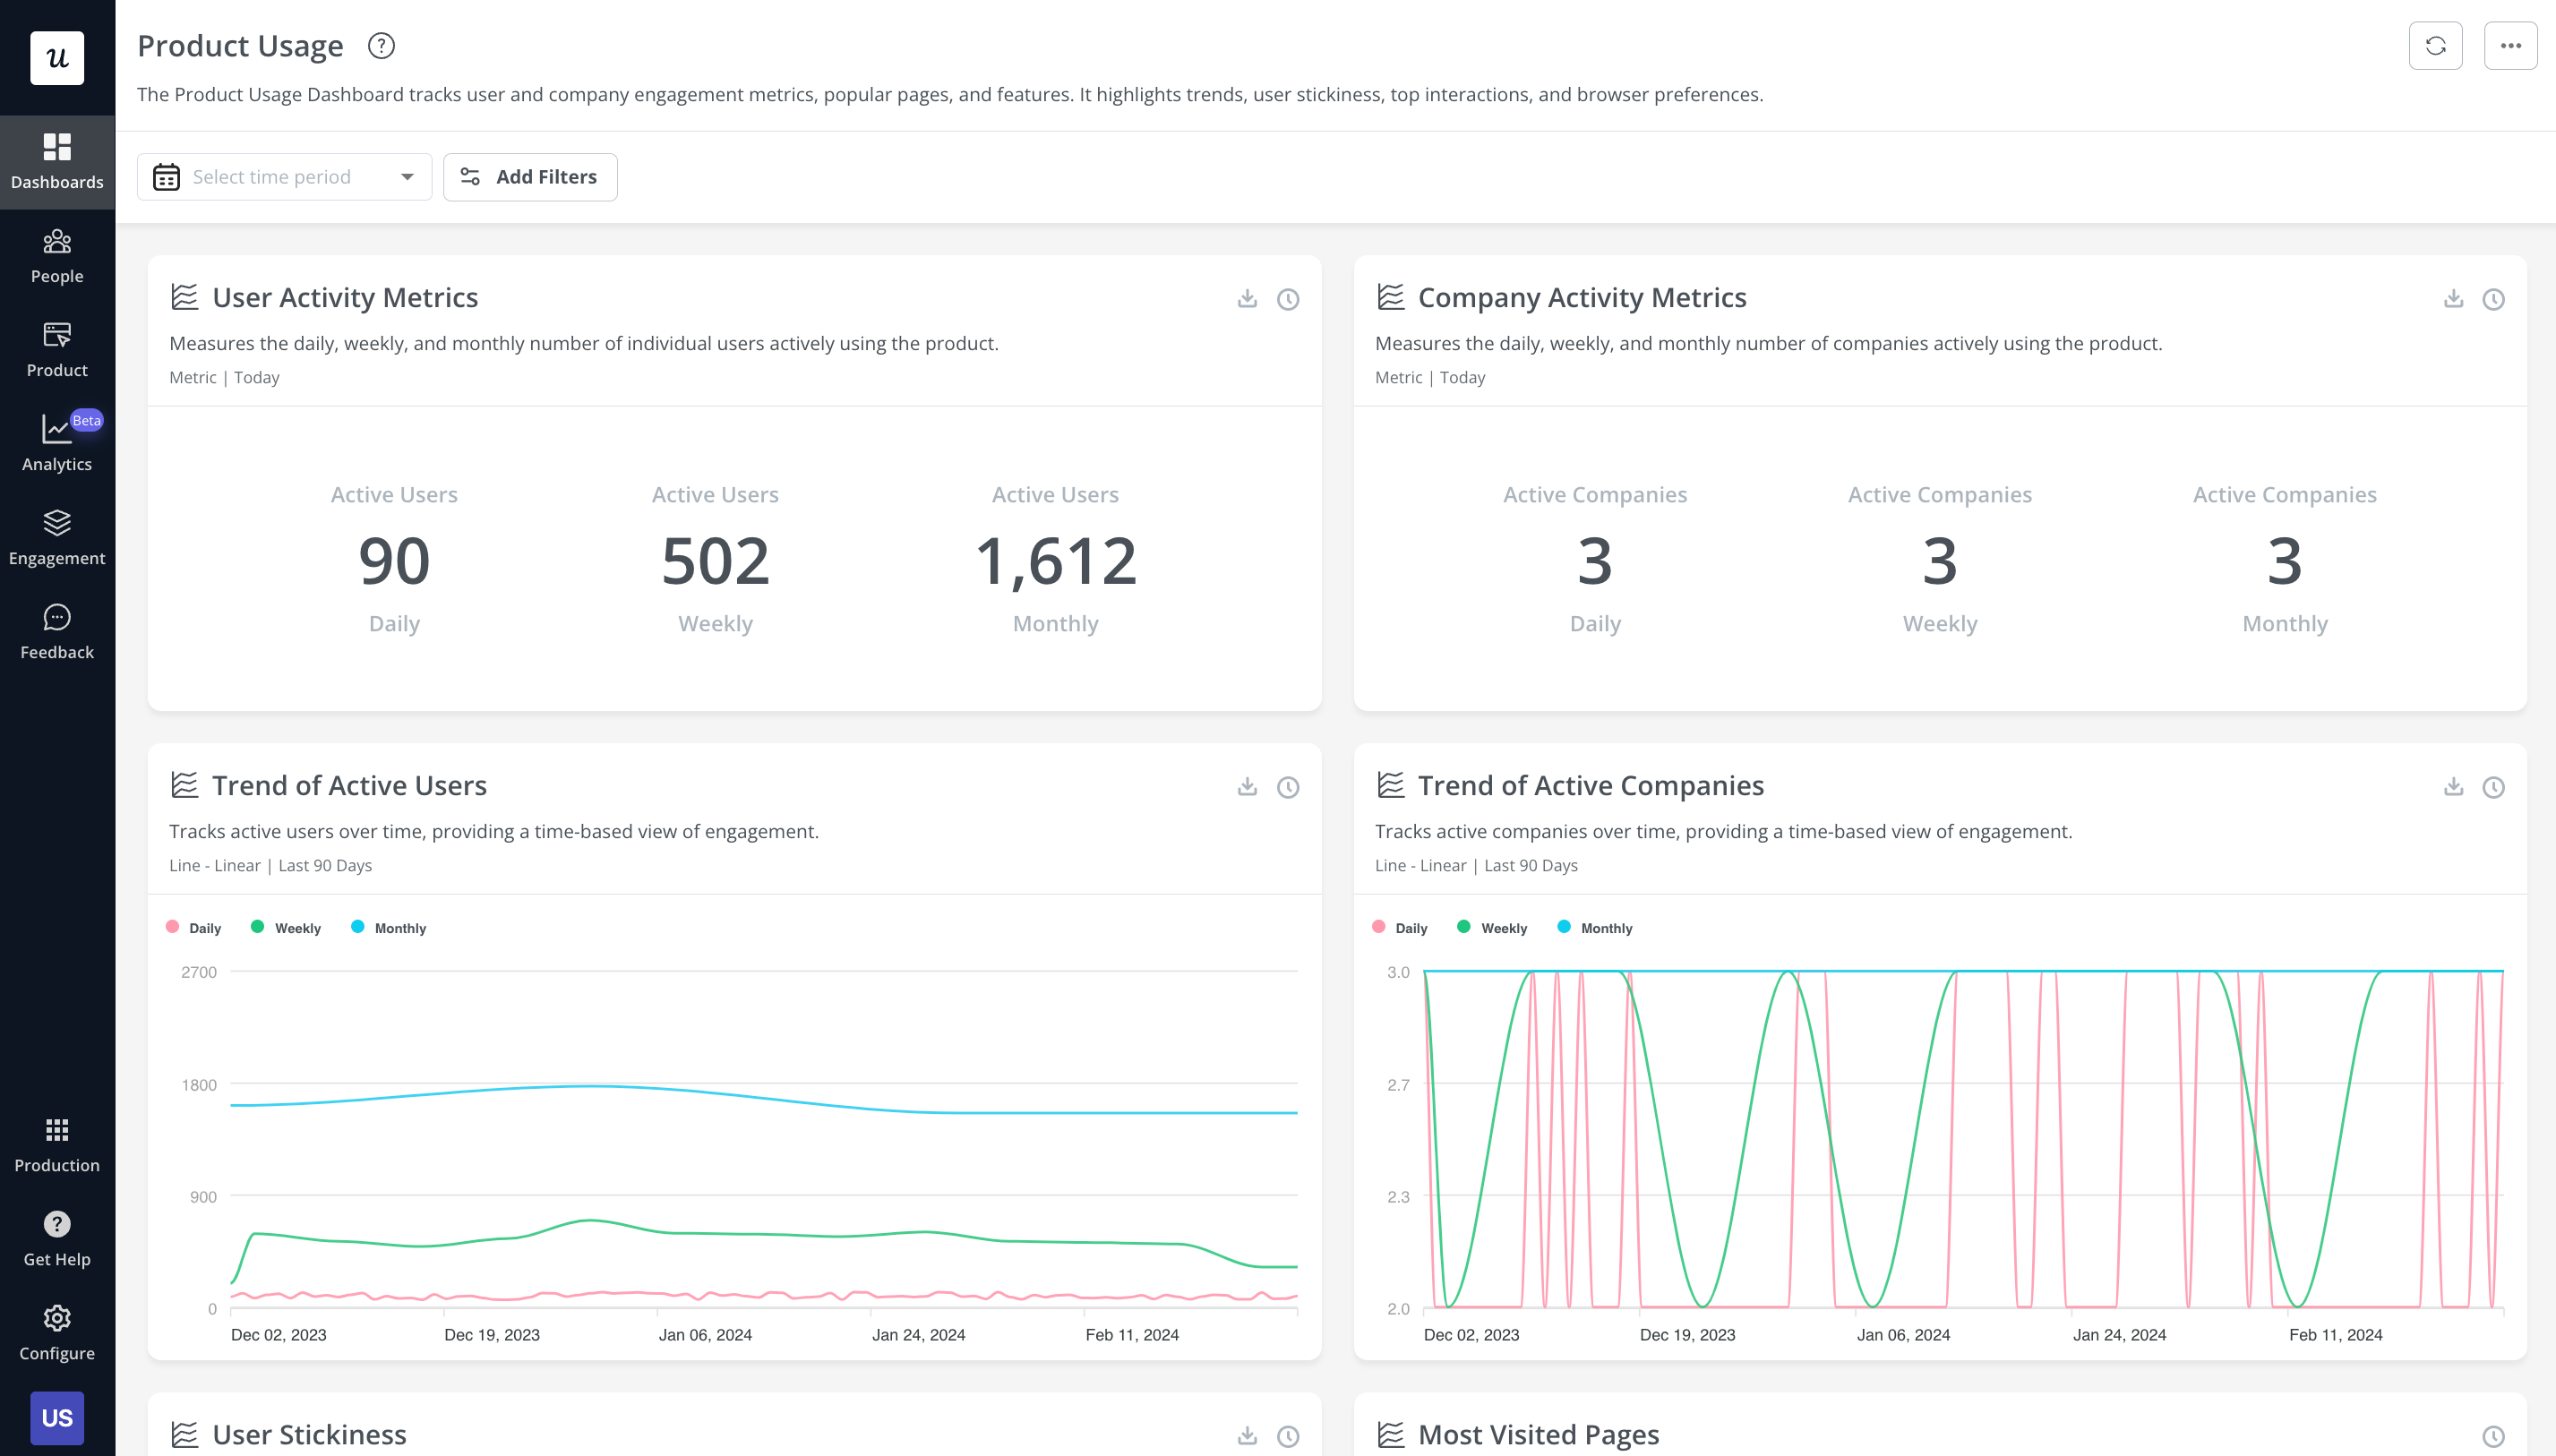
Product usage dashboard in Userpilot
Product retention analytics and metrics
Product retention is critical for business growth as it increases your customer’s lifetime value.
Important product retention metrics include:
- Product stickiness — the DAU to MAU rate.
- Monthly recurring revenue (MRR) — is the guaranteed revenue a business will earn every month.
- Customer retention rate — the number of customers you retain over time.
Userpilot has a dashboard for user retention as well. You can use it to view the retention rate for different time periods and user segments.
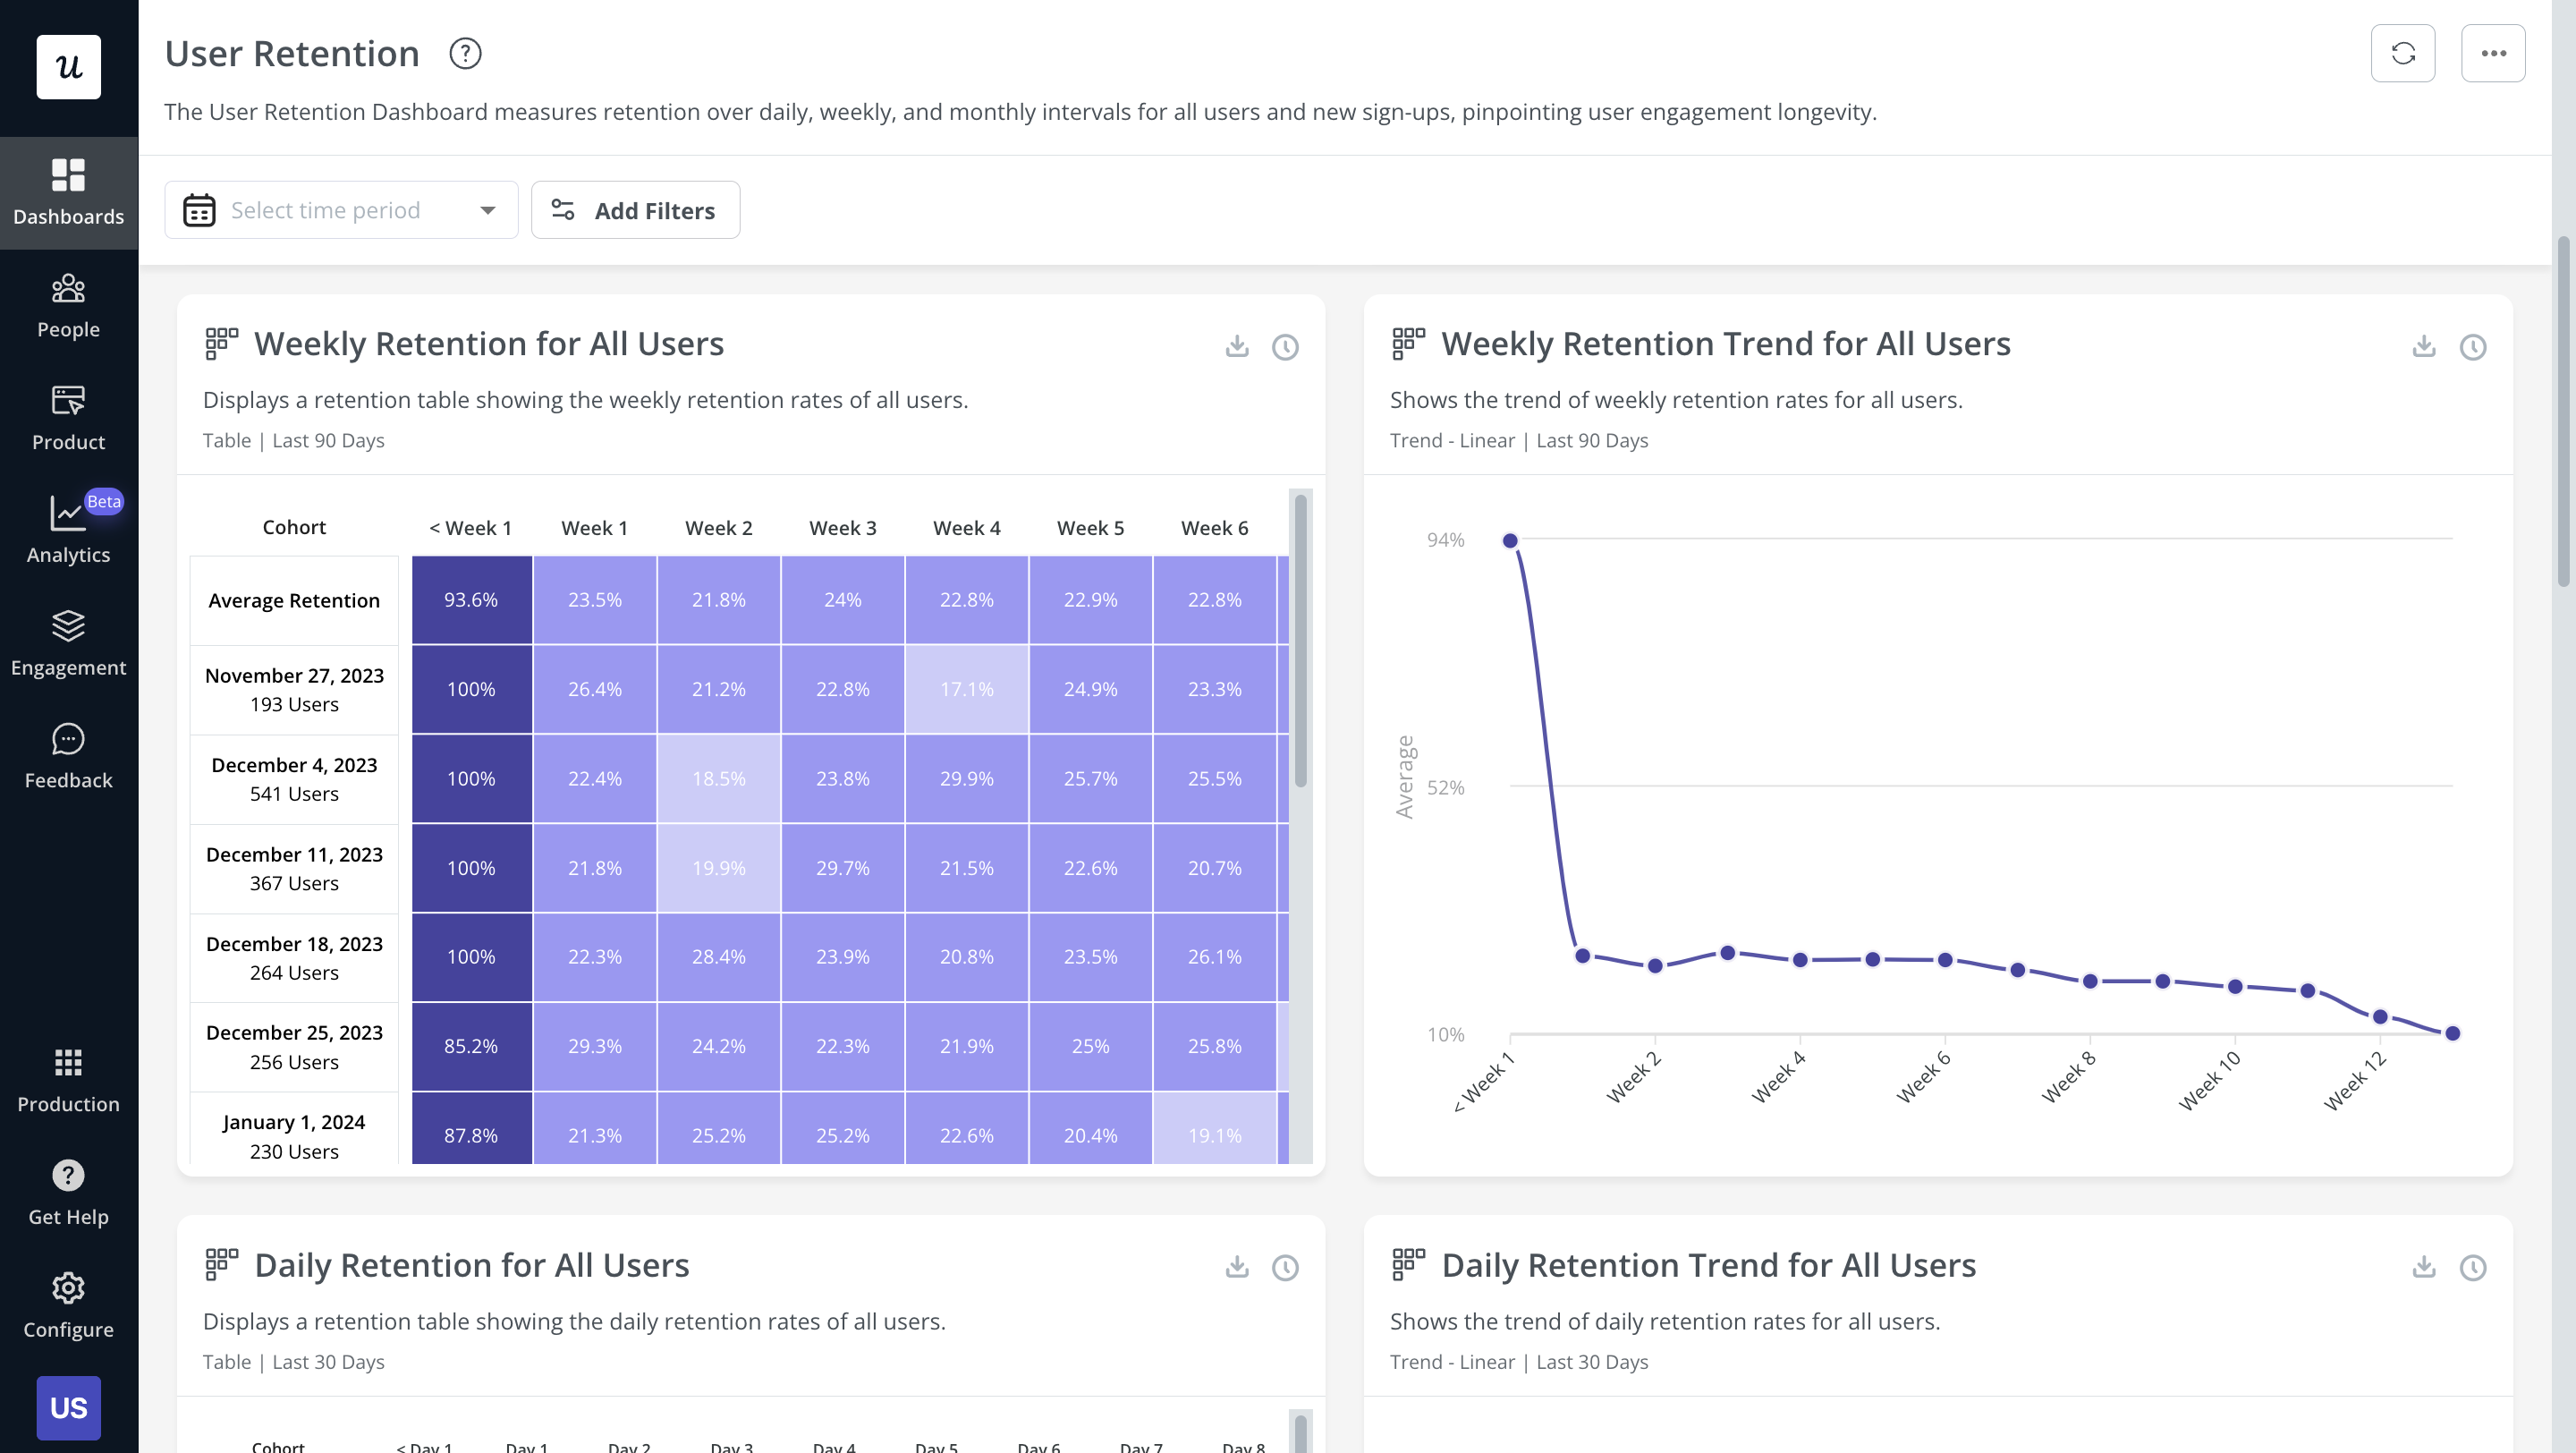
User retention dashboard in Userpilot
Financial product analytics and metrics
Common examples of financial metrics are:
- The average revenue per daily active user (ARPDAU) — helps you understand how well your app generates revenue.
- Customer lifetime value (CLV) — is the total expected earnings per paying customer over the course of their relationship with you.
- Revenue growth rate — a quarterly growth rate is the most common for SaaS companies.
Userpilot: The best product analytics tool for product managers
Out of the many product analytics tools in the market, Userpilot stands out. This is because of the advanced analytics functionality along with engagement features to act on the insights collected.
Here are Userpilot’s top product analytics features:
- Feature tagging: Userpilot’s click-to-track feature tagger lets you view how many times a feature has been used and by how many users to measure its adoption. Users on the Starter plan can add up to 15 feature tags while those on the Growth or Enterprise tier can create unlimited tags.
- Trends, funnels, cohorts, and paths: Userpilot’s reports let you extract actionable insights from big data and monitor drop-offs.
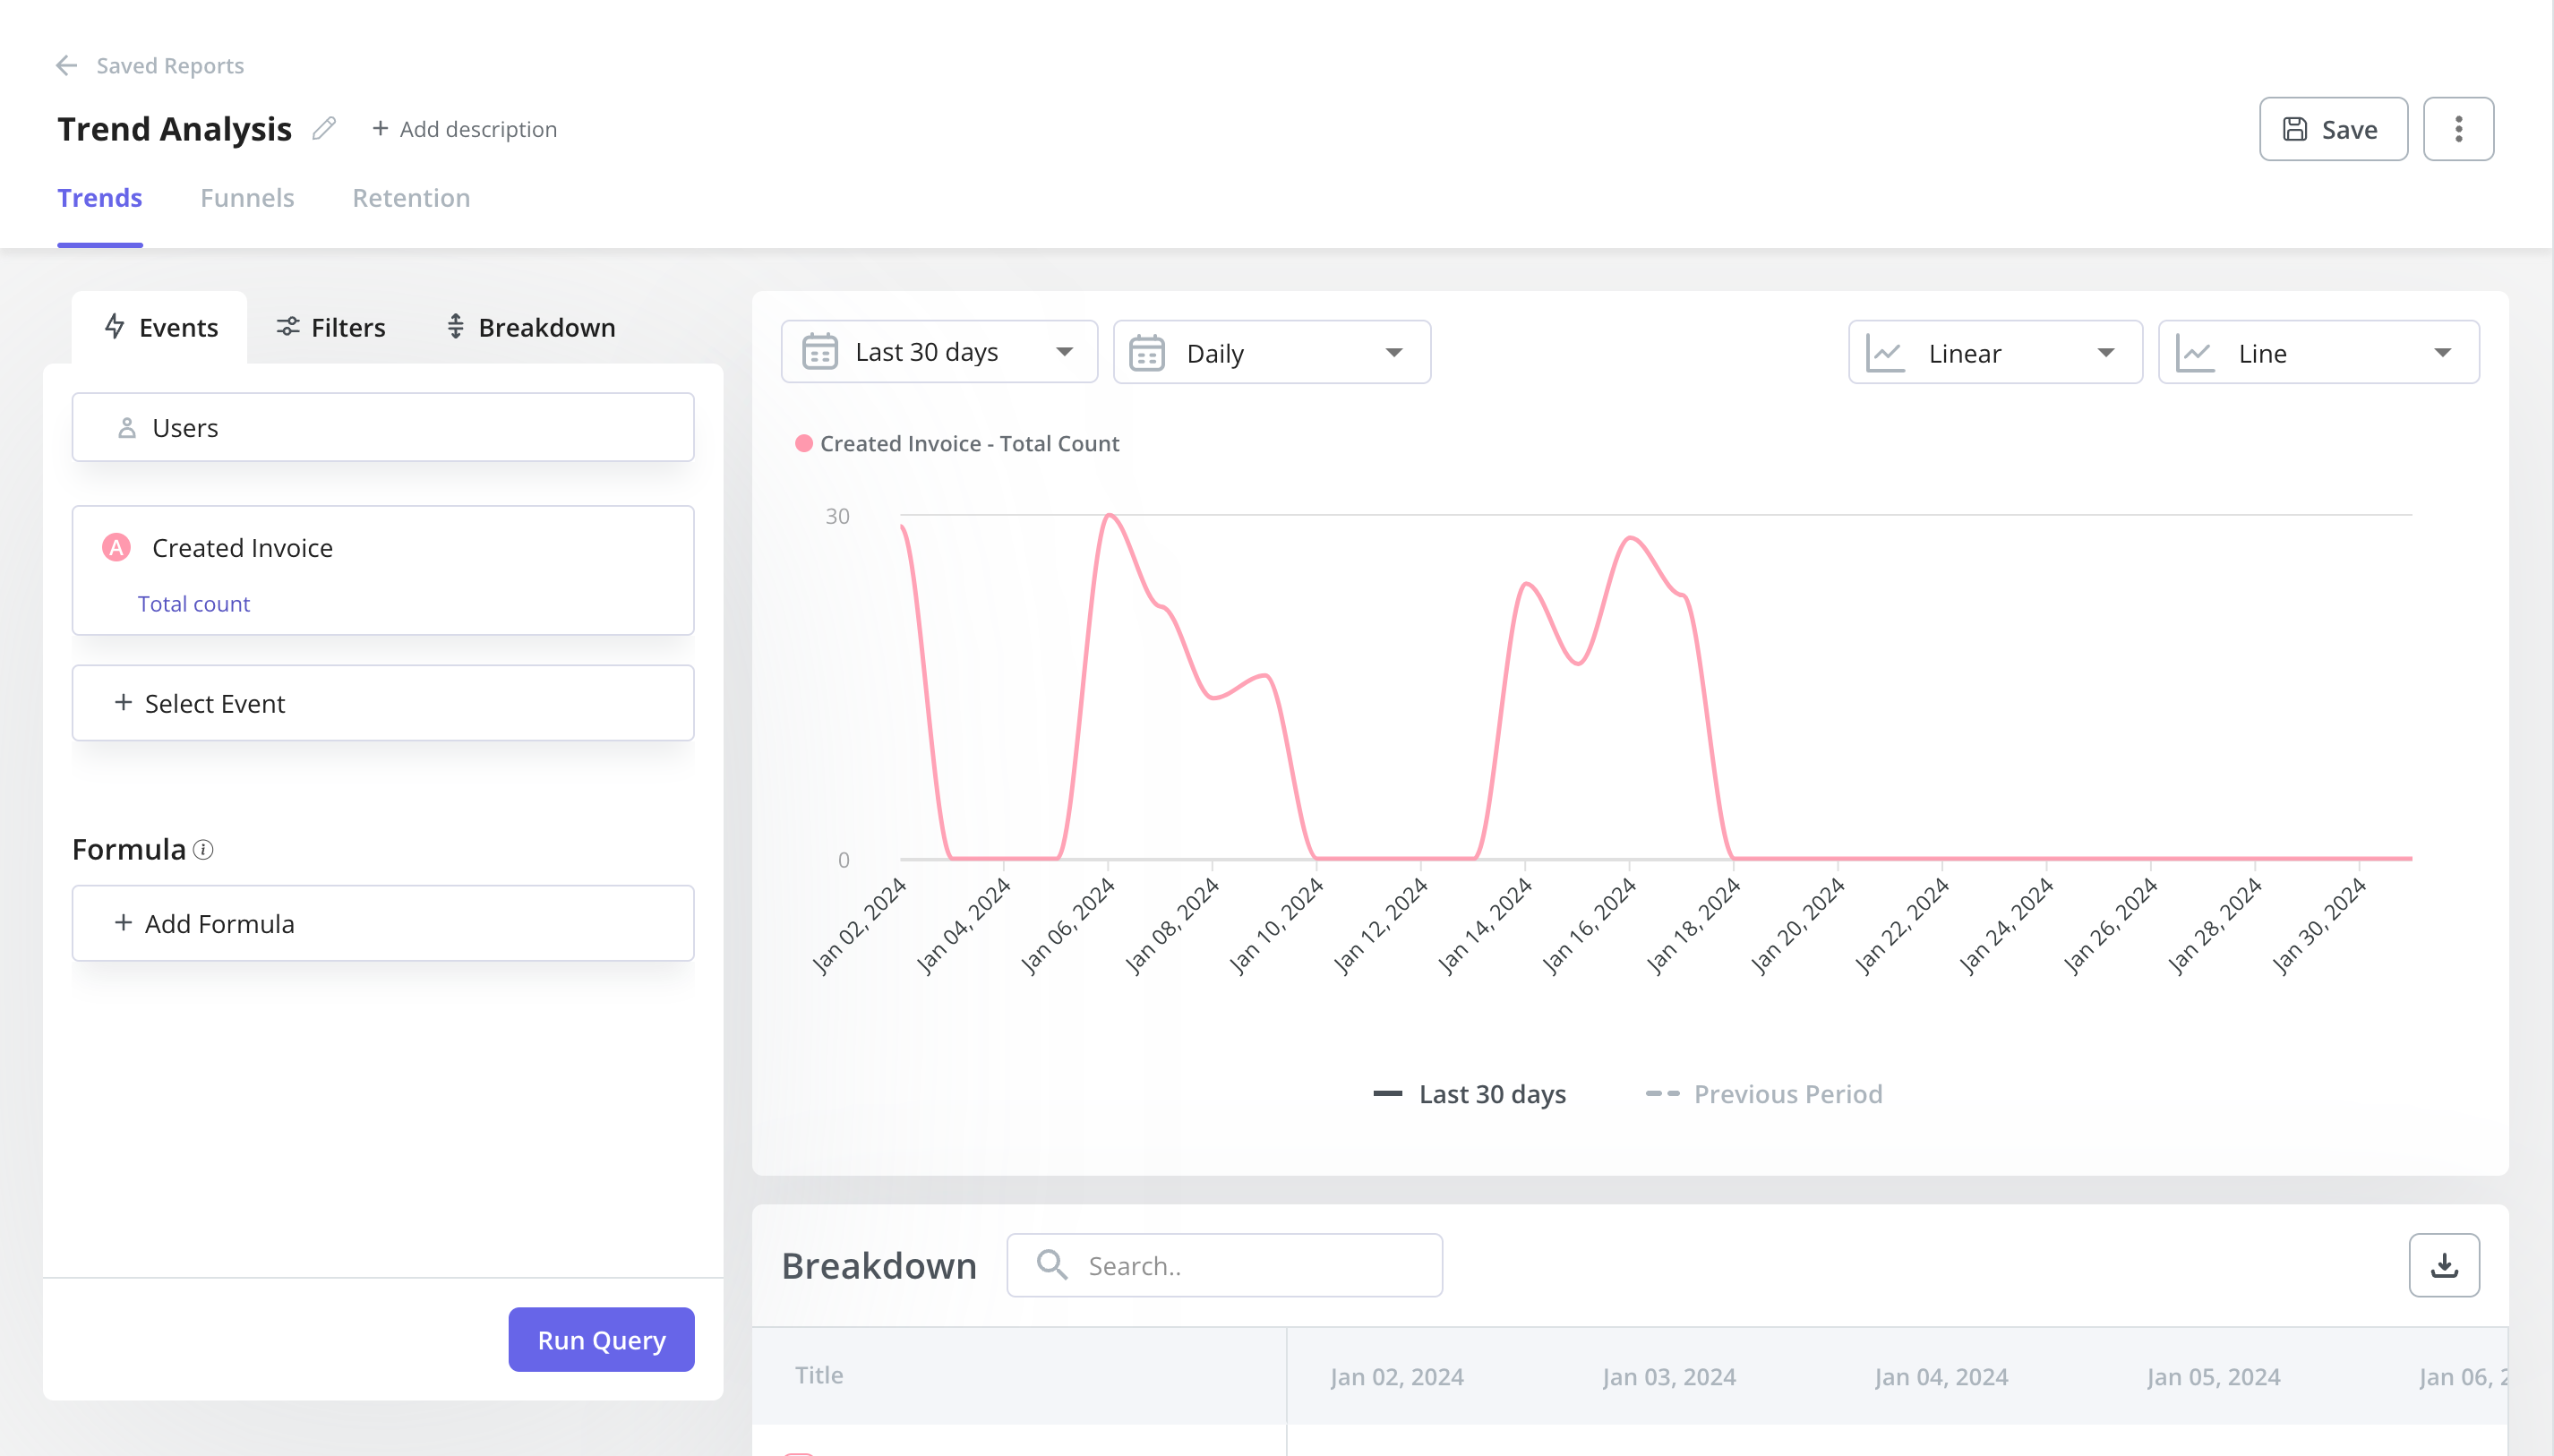
Trend analysis in Userpilot
- Saved reports: The saved reports analytics dashboard shows you all the reports you’ve created and lets you filter, export, or delete any reports in a single click. In addition to adding filters or sorting by report type, you can also edit or duplicate reports to help you review analytics.
- Analytics dashboards: These dashboards enable you to keep track of your key product performance and user behavior metrics at a glance, without any technical setup required. You can also customize these dashboards.
- Analytics integrations: Userpilot integrates with some of the most popular analytics tools like Amplitude, Mixpanel, Segment, Google Analytics, and more. This makes it possible to sync product analytics both ways between the tools in your tech stack (two-way integration is only available for HubSpot and Salesforce at the time of writing, more to come).
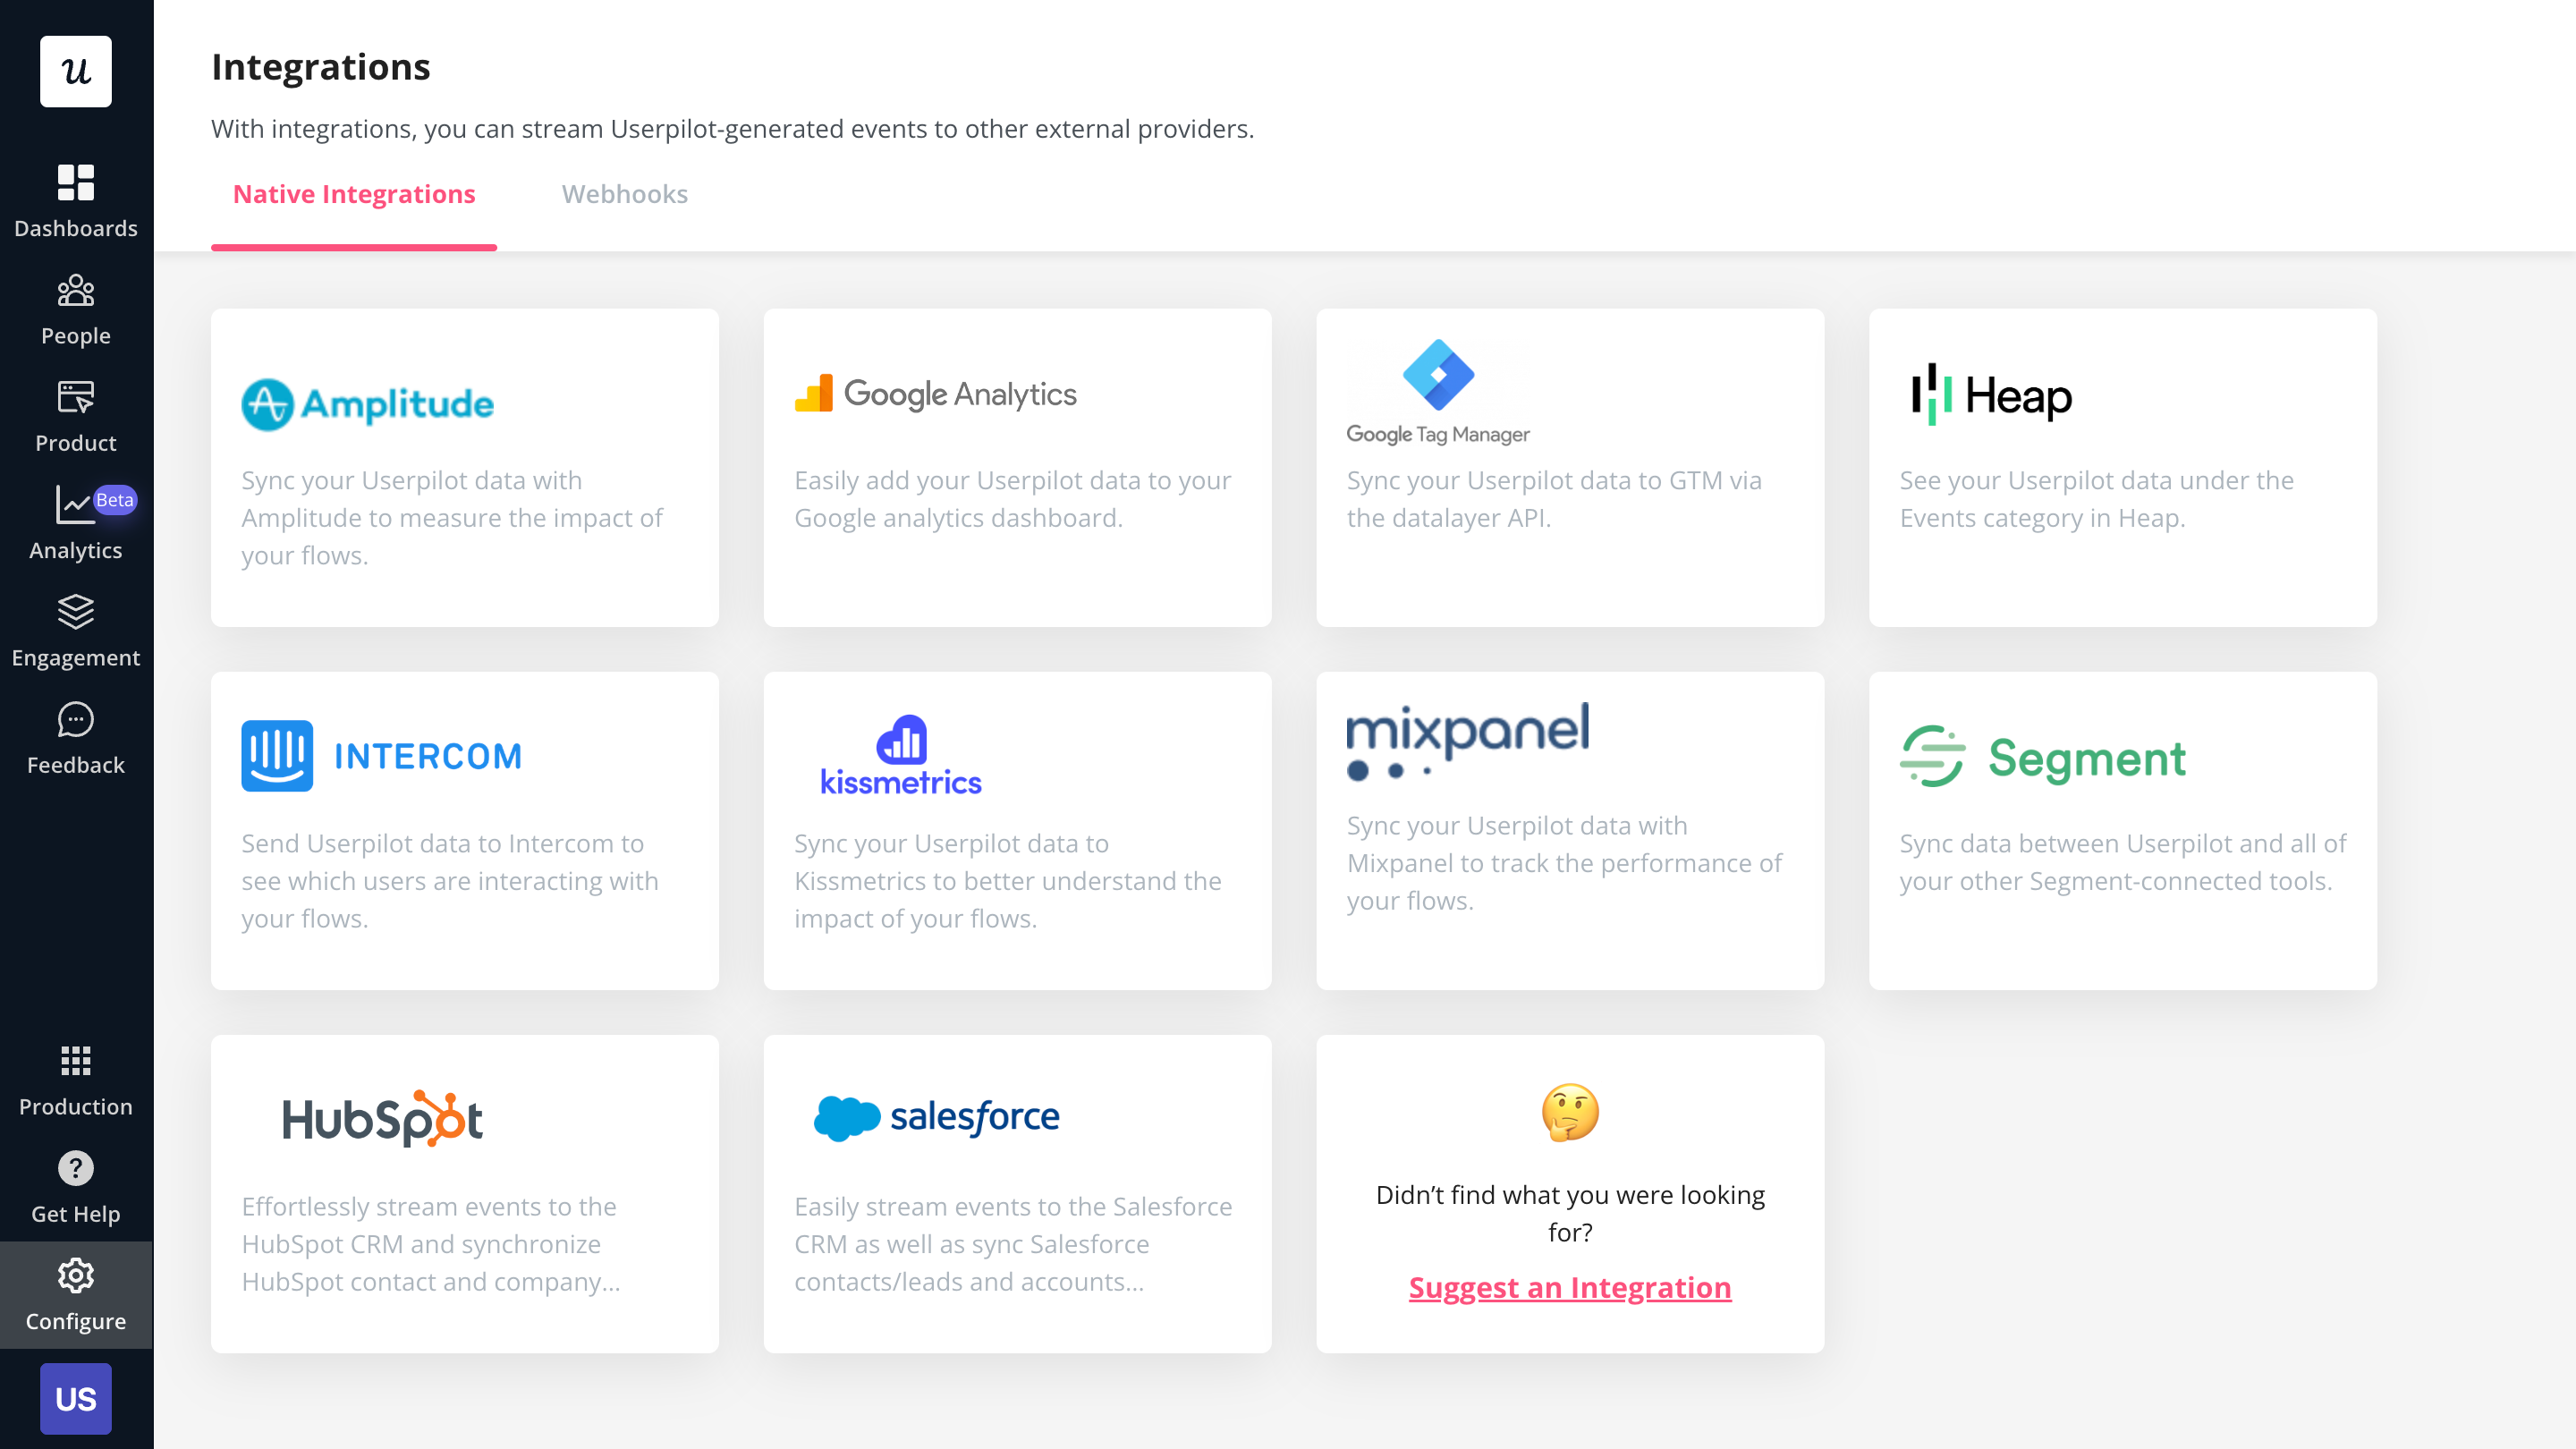
Userpilot integrations
Conclusion
Product insights unlock product growth opportunities and put you on the same page with your customers. Without this, it’s merely impossible to build a solid product the market craves.
Start collecting customer data and take your product to the next level! Get a Userpilot Demo to unlock its full potential for product analytics.
![]()
Userpilot: The Ultimate Growth Tool for Product Managers

