Appcues Analytics: An In-Depth Review [Features, Alternatives, and More]
![Appcues Analytics: An In-Depth Review [Features, Alternatives, and More] cover](https://userpilot.com/blog/wp-content/uploads/2023/02/Appcues-Analytics-An-In-Depth-Review_d9f314f97c1c9ff1b80fc64a47830d70_2000.png)
Are you wondering if Appcues offers the right analytics functionality for your product?
If so, you’re in the right place because that’s what this article explores! We’re having a closer look at the key Appcues analytics features, discussing their pros and cons, and checking out a few user reviews.
We also show you how it stacks against Userpilot analytics in case you’re considering alternative products as well.
Let’s get right to it, shall we?
TL;DR
- Appcues is a product adoption platform that allows you to track and analyze product usage and design onboarding experiences to drive feature and product adoption.
- Userpilot is an alternative adoption tool that offers more comprehensive analytics features at a lower price point.
- Appcues allows you to segment your users based on user properties, flow interactions, checklist engagement, and event completion.
- With Userpilot, you can also use company data and survey results, including quantitative and qualitative NPS responses to create segments.
- Appcues click-to-track events allow you to monitor user engagement with different features in your product.
- Feature tagging in Userpilot is the equivalent of click-to-track events in Appcues except that you can also track form fills and hovers.
- Flows are sequences of onboarding UI patterns, like modals, slideouts, hotspots, and tooltips. Appcues allows you to analyze the performance of your flows and individual patterns over time and you can link them with goals.
- Like Appcues, Userpilot allows you to track goals from the Goals dashboard after you set them from the Chrome extension.
- With Appcues, you can run NPS surveys and the app does a basic analysis of the scores for you. You can get information about the total score, score breakdown between different groups, and score history.
- The NPS dashboard in Userpilot is more detailed. However, the key difference is that with Userpilot you can tag and analyze qualitative responses in-app. To do that in Appcues, you need to export the data to a 3rd party product.
- Userpilot displays all the tracked data in real-time while in Appcues there’s a delay which makes the data less actionable.
- Want to see how Userpilot analytics features work in practice? Book the demo!
What is Appcues?
Appcues is a product adoption platform.
It offers product teams the ability to track product usage and user behavior in-app, run user sentiment and satisfaction surveys, and design in-app onboarding experiences to drive product engagement and adoption.
Setting Appcues doesn’t require any coding and it supports both web and mobile apps.
What can you do with Appcues analytics?
Appcues offers a range of analytics features that help product managers, marketers, and UX designers gather insights into user behavior within their products.
Appcues segmentation
User segmentation is essential for creating personalized onboarding experiences and gaining meaningful insights from analytics.
In Appcues, you can easily create, edit and merge segments from Segments & Users. You can build segments based on:
- User properties
- Flows interaction (completed or not?)
- Checklists (in progress, skipped, completed, not seen)
- Events (ones you create)
- Predefined segments (Evaluators, Beginners, Regulars, Champions)
Once they are ready, you can use the segments to:
- Target specific user groups with customized in-app experiences (flows and checklists)
- Filter events in the Events Explorer for focused analysis
The cheapest Essential plan allows you to create and track 5 user segments only.

Appcues click-to-track events
Click-to-Track is a feature that enables teams to track customer behavior in-app to evaluate the effectiveness of in-app experiences.
Basically, you use it to tag a part of your UI and track how users engage with it. The process of creating events is completely code-free.
After creating the events, you can use them to:
- analyze customer behavior via Events Explorer
- trigger flows, checklists, or surveys (only available in the highest plan)
- segment users
- set goals
- send them to 3rd party apps via Events Broadcaster
The lowest Essential plan allows you to track 10 events. For more, you need to upgrade to the Growth plan.
What’s more, the data doesn’t update in real time. This means you can’t trigger in-app experiences in response to events fired by users.

Appcues flow analytics
Flows are sequences of UX patterns you can use to guide your users to activation. The patterns you can use are modals, slideouts, hotspots, and tooltips.
Appcues allows you to analyze the performance of your flows over time. The Flow Analytics page gives you insights into:
- unique users who engaged with the flow
- unique users who completed the flow
- issues encountered
- unique users who achieved the goal linked to the flow
- performance of individual steps within the flow (Step Breakdown)
- performance of various versions of the flow over time
- most recent users that saw the flow

Appcues goals
Goals, also known as conversions, are the ultimate outcomes of your flows. This could be completing actions leading to activation, new feature discovery, or purchase.
In Appcues, there’s a dedicated Goals page where you create them. That’s also where you activate and deactivate goals.
Next, you need to link it with a flow and it’s the Flow Analytics page where you see data on Goal completion.
The lowest Essential plan allows you to create 10 custom goals.

Appcues NPS analytics
With Appcues, you can run NPS surveys to collect data on user sentiment and the tool does all the analytics for you.
The NPS dashboard provides you with the total NPS score as well as the breakdown into promoters, passives, and detractors. Thanks to the chart, you can see trends in NPS over time. You can filter the data by time periods or user segments.
The NPS pages includes also a table with all the responses. This includes the user ID, their role, score, and qualitative feedback.
However, there’s no way to tag qualitative responses for further analysis.

Appcues analytics integrations
The app supports a whole host of integrations. These include:
- Analytics tools (including two-way integrations with Amplitude, Mixpanel, and Heap, as well as Kissmetrics and Fullstory)
- Engagement and messaging tools (including Intercom, Slack, and Kaviyo)
- CRMs (including two-way integrations with Salesforce, HubSpot, Zendesk, and Marketo)
- Connector products (Segment, Zapier, Google Tag Manager)
Pros and cons of Appcues analytics
What are the strengths and weaknesses of Appcues analytics?
Pros of Appcues when it comes to product analytics
- You can act on product analytics insights, for example, by triggering flows or checklists
- Integrations with major analytics tools like Mixpanel, Heap, and Amplitude once you realize the limitations of its native analytics functionality
Cons of Appcues when it comes to product analytics
- Lack of qualitative NPS analysis
- The event data is not displayed in real-time, which limits your ability to trigger contextual experiences
- Limited functionality included in the Essentials plan (10 events, 5 segments, 3 user licenses, no checklists)
What do users say about Appcues?
G2 reviewers give Appcues an average score of 4.6, which is pretty darn impressive.
However, if you look at the reviews, most of them praise the user engagement layer, ease of setup, and intuitive UI. The analytics reviews are a bit more mixed.
For example, the NPS survey integration, flow analytics, and event tracking get a positive user response:
The NPS survey is an important way to track how users are reviewing your products. This ties into company OKRs and is a metric used by our product and CS teams. We also use the flows for user onboarding or create hotspots that help users get additional information about a feature they want to try. I am also a big fan of event tracking, as we consistently learn new details about our users.

On the other hand, many users believe that the analytics are not deep enough:
As much as I like how the onboarding guides turn out that we created, they are lacking some deeper analytics in-app. For example, it was hard to track feature adoption by visitors or accounts after releasing a new guide, which would be helpful if we released a new feature. You have to rely on another analytics tool to really dive into what is working and what is not working in your application. We didn’t have the resources at the time to do this, so we had to do with what was offered, but looking back, it would have been nice to connect to an analytics tool, like Amplitude.

Appcues pricing
Appcues offers three different plans:
Essential
- $249/month
- 3 user licenses
- Standard pattern library, including NPS surveys and Pins
- Unlimited Insights
- 10 Track Events (click-to-track)
- Send data to analytics tools
- Email support
Growth
- $879/month
- Everything in Essentials, plus:
- 10 user licenses
- Advanced pattern library, including Checklists and Launchpad
- Advanced targeting capabilities
- Unlimited Track Events (click-to-track)
- Unlimited use of integrations
- Customer Success Support
Enterprise
- Custom pricing
- Unlimited user licenses
- Advanced security and SSO
- Enterprise account administration, including roles and permissions
- Localization support
- Premium support and services
- Access to activity logs for security auditing
Before you commit to any of the plans, you can try Appcues for free for 14 days.

Userpilot: A better alternative to Appcues analytics
Appcues is a trusted product adoption platform but what if we told you there was an alternative tool that offered better value for money? One that would have more generous pricing plans and offer better analytics features?
Well, such a tool exists! Let’s check out how Userpilot analytics compare to Appcues!

What you can do with Userpilot analytics vs Appcues?
Here’s a quick look at Userpilot analytics features and how they outperform Appcues.
Userpilot segmentation
Just like Appcues, Userpilot offers user segmentation. It allows you to gain a deeper understanding of different user needs and offer them personalized and contextual experiences in-app to help them achieve their goals.
Userpilot allows you to segment your users based on:
- User attributes, like the plan, web sessions, or signup date
- Company data
- Tagged features they have engaged with
- Custom events completed
- In-app experiences engaged with, for example, flows or checklists
- User feedback – both quantitative, like NPS scores, and qualitative, like NPS responses
In contrast, Appcues doesn’t support segmentation by company data or survey results. And that’s not all as far as differences go.
The lowest Traction plan in Userpilot enables you to create unlimited user segments. As you remember, that’s not the case with Appcues.

Userpilot feature tagging
Userpilot enables you to tag features and analyze every user interaction with each of them.
Feature tagging is very straightforward from the Chrome extension and it doesn’t require any coding. Once you set them up, you can track them through the Events dashboard.
Feature tagging enables you to carry out feature audits to:
- find out which features are underutilized
- identify features that drive value for different customer segments so that you can prioritize better
- identify which features you may need to sunset based on low usage rates
Feature tagging is like click-to-track events in Appcues, except that it’s way more powerful. For starters, it allows you to track form infills and hovers, and not just clicks. And as many of them as you need, even in the lowest plan.
What’s more, unlike in Appcues, all the data is displayed in real-time, which makes it more actionable.

Userpilot goal tracking
Userpilot supports Goal tracking, just like Appcues.
To track them in Userpilot, you simply tag them in the Chrome extension.
Once you have the data, you can analyze it through the newly-overhauled Goals dashboard. You can filter it by segment, company, and time period, and the dashboard gives you insights into:
- Goals (active)
- Users (active, unique)
- Companies (active, unique)
- Linked content
Thanks to the bar chart, you can analyze the performance of various goals.

Userpilot NPS analytics
With Userpilot, you can customize and launch NPS surveys in-app for different user segments at different intervals.
The NPS dashboard gives you all the insights that the Appcues counterpart does, and a bit more. You can find there:
- the overall score
- the breakdown into promoters, passives, and detractors
- a graph with NPS scores over time
On top of that, you can also see:
- responses by score, for more granular insights into what makes up the overall score
- a scoreboard with the total number of surveys shown, responses, the response rate, and qualitative responses.


This enables you to identify recurring issues that turn your users into detractors. You can also use the tags to segment your users and target them with in-app messages and guidance that address their pain points.
To be able to do that in Appcues, you either have to export your survey results into a CSV file or use another tool.
Userpilot pricing
Userpilot’s transparent pricing ranges from $249/month on the entry-level end to an Enterprise tier for larger companies.
Furthermore, Userpilot’s entry-level plan includes access to all UI patterns and should include everything that most mid-market SaaS businesses need to get started.
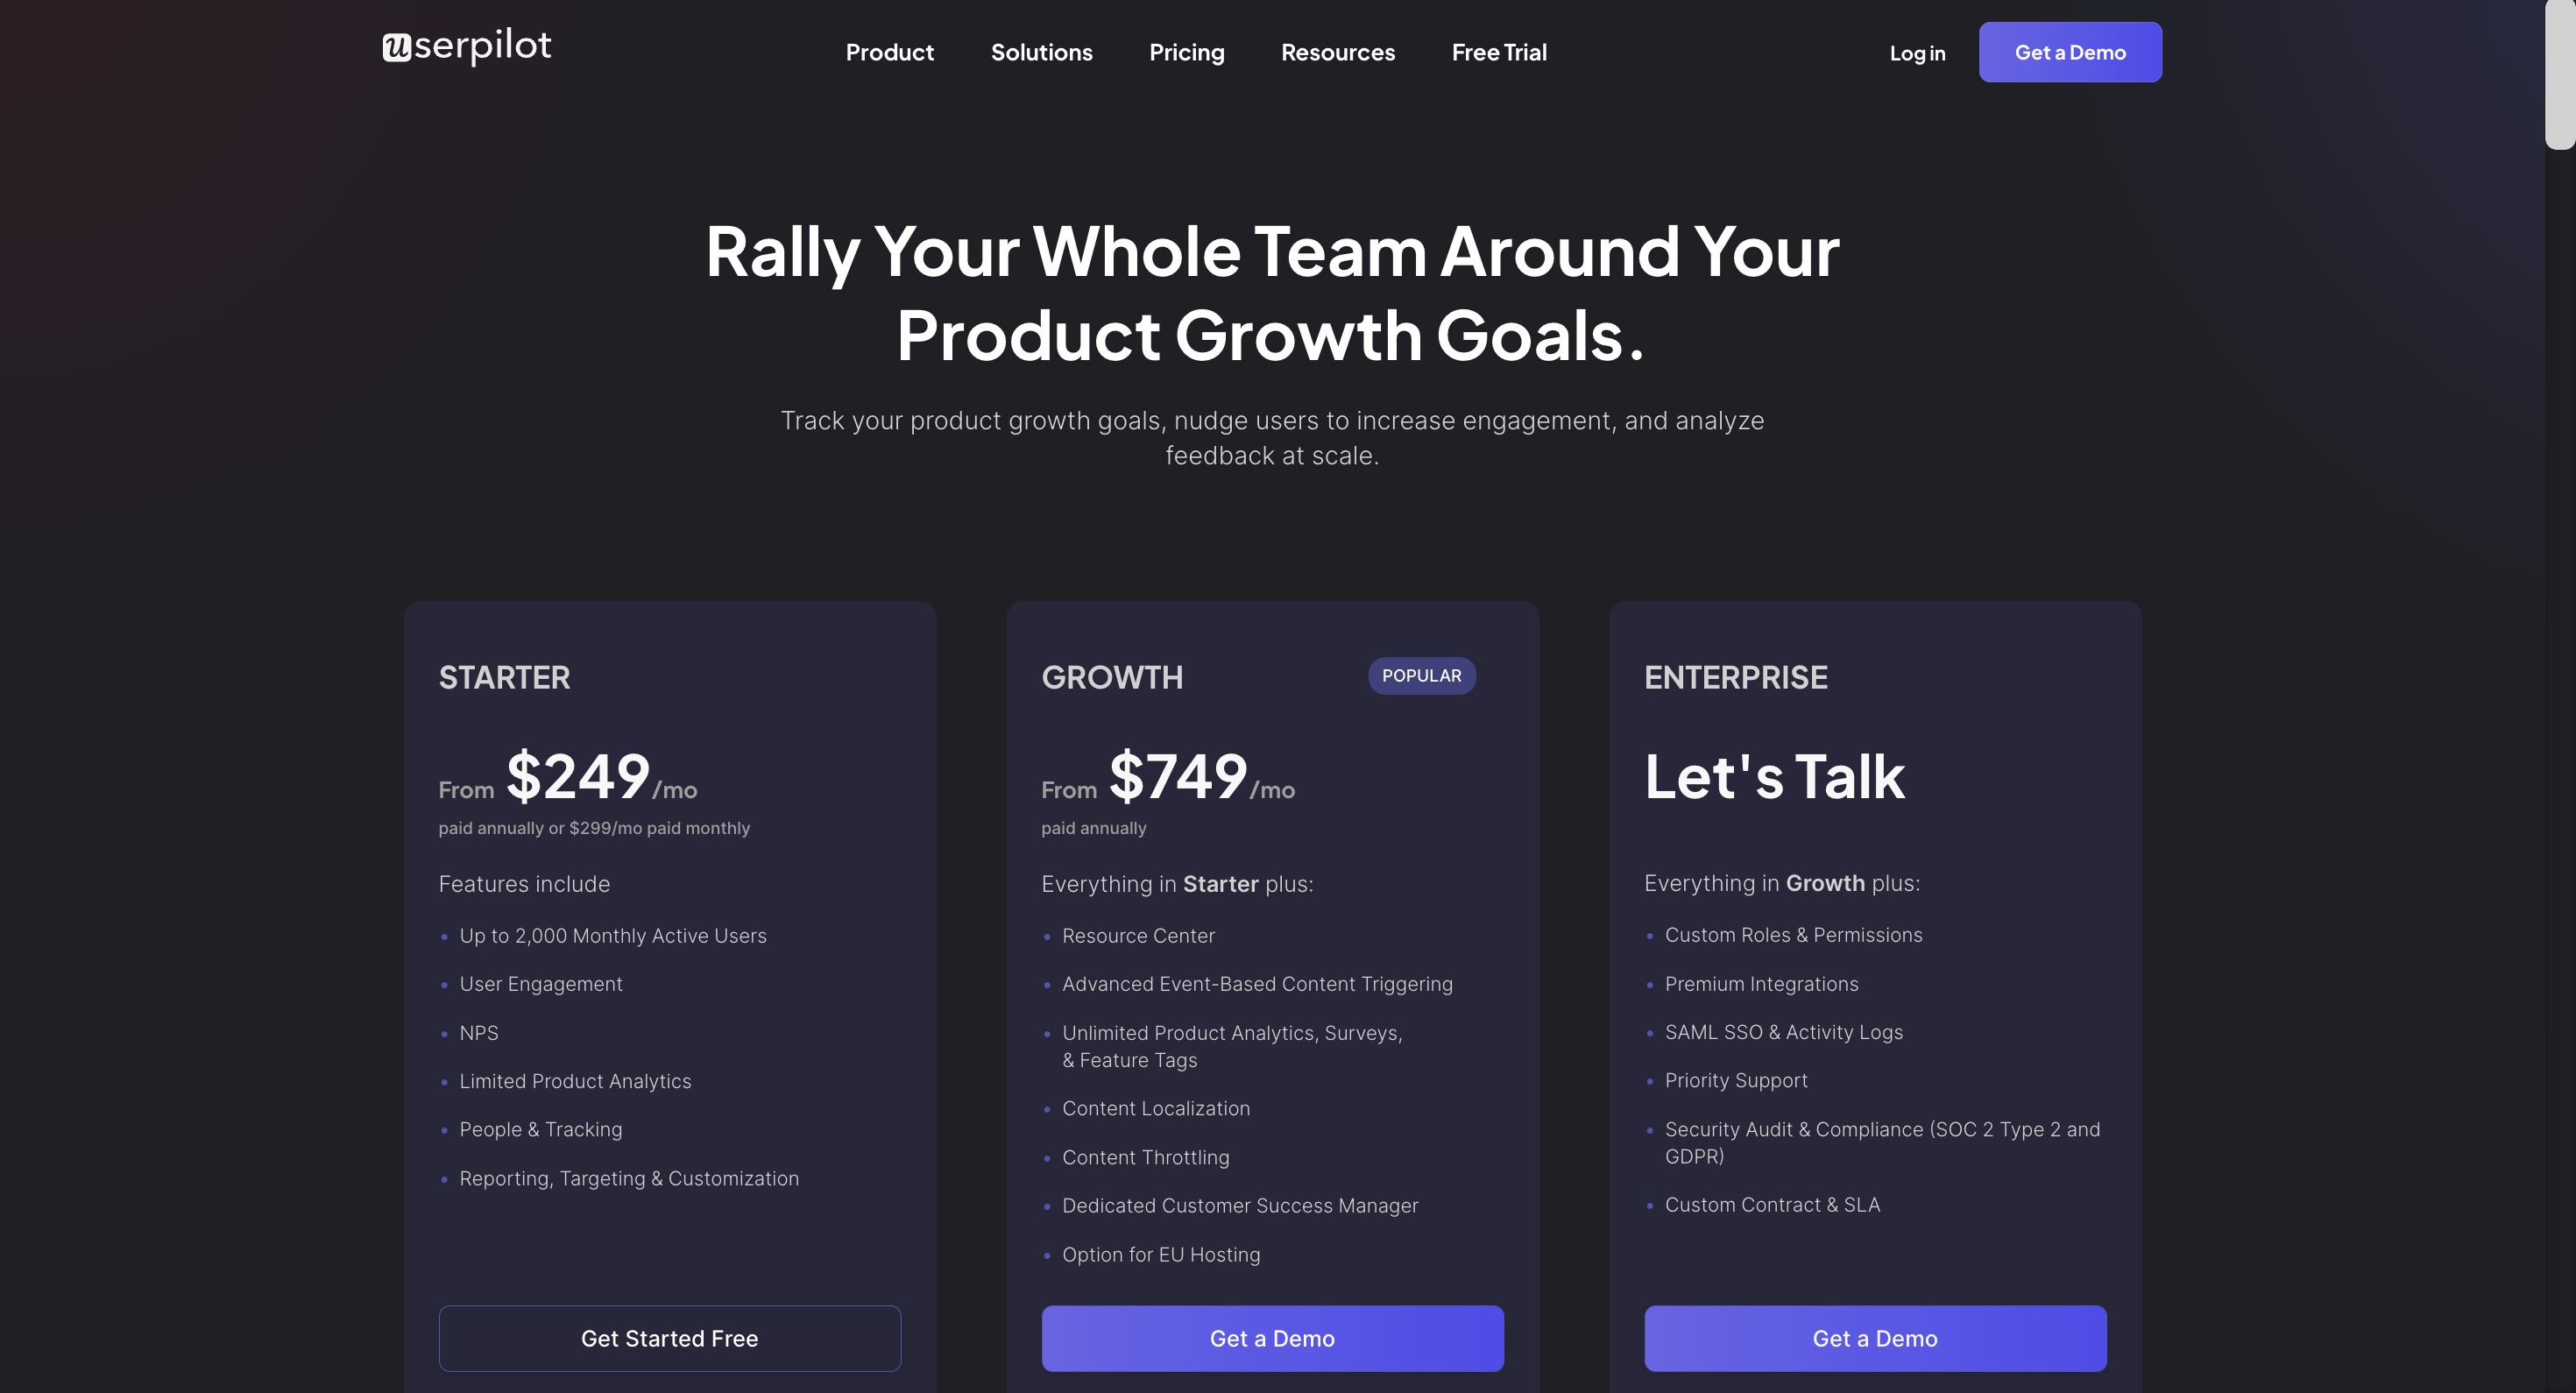
Userpilot has three paid plans to choose from:
- Starter: The entry-level Starter plan starts at $249/month and includes features like segmentation, product analytics, reporting, user engagement, NPS feedback, and customization.
- Growth: The Growth plan starts at $749/month and includes features like resource centers, advanced event-based triggers, unlimited feature tagging, AI-powered content localization, EU hosting options, and a dedicated customer success manager.
- Enterprise: The Enterprise plan uses custom pricing and includes all the features from Starter + Growth plus custom roles/permissions, access to premium integrations, priority support, custom contract, SLA, SAML SSO, activity logs, security audit, and compliance (SOC 2/GDPR).
Conclusion
Appcues is a solid adoption platform trusted by lots of product teams. However, users agree Appcues analytics features are not its forte. Because of the limitations, many of them are forced to use 3rd party tools.
Userpilot’s analytics functionality is more robust and enables you to gain in-depth insights to drive your product adoption.
If you want to see how you can leverage Userpilot analytics to drive your product growth, book the demo!