Top 8 Performance Reporting Software for Your Business
Knowing how well your products and campaigns perform can give you the most vital insights needed to guide your business. Having the right performance reporting solution for product analytics in your arsenal optimizes risk management and aids in financial planning by ensuring each decision you make is data-driven.
Here are 8 of the best performance reporting software for your business needs!
TL;DR
- Performance reporting software refers to tools that take and interpret data to communicate how well a campaign or product is performing.
- The best performance reporting tools should have data collection, custom reports, data sharing, and no-code capabilities as features at a minimum.
- Userpilot is a digital adoption platform (DAP) known for its low/no-code data analytics that offers user and product insights, as well as custom reports in order to communicate performance. See our pricing or get a free Userpilot demo!
- Hotjar is a well-known heatmap and performance reporting tool. (Starts at $48/month)
- FullStory is a DXI system developed to optimize UX. (Available upon request)
- Mixpanel is a product insights software that reports on advanced user behavior criteria. (Starts at $20/month)
- Databox is a performance management platform with tools to help foster product growth. (Starts at $47/month)
- Tableau is a leading data and analytics platform with integrated data management capabilities. (Starts at $15/month)
- Geckoboard is a data visualization tool that makes performance reporting seamless through real-time dashboards. (Starts at $49/month)
- Ahrefs is an SEO software that helps increase reach and encourage conversion. (Starts at $99/month)
What is performance reporting software?
Performance reporting software refers to platforms and services that extract and organize data into easy-to-understand reports that show how well you stack up against your business KPIs. Having access to a performance report enables teams and businesses to optimize for increased performance.
Must have features of performance reporting tools
Secondary features vary among multiple performance reporting software. However, many of the best performance reporting software share these primary features that are simply must-haves for your team. These features help you gain insights from multiple sources and leverage the data available to you.
Here’s a list of some of these must-have features:
- Data collection capabilities. It is simply impossible to have performance reporting without collecting the relevant data to interpret. Your performance reporting software should be capable of gathering data at a minimum. A big bonus in this area is the capacity to collect first-party data.
- Customized reports. Your performance reporting software must be able to create a customizable report that can focus on specific data points. Having a wide array of criteria to set as parameters for your customized report is not a requirement but definitely a big plus.
- Data sharing abilities. Teams should be able to have access to reports in order to get as many heads as possible working on solutions. This fosters team collaboration and increases the efficiency of discovering data-driven solutions. Having dashboards with reporting that’s easy to understand should be taken into consideration.
- No-code builder. Not everyone who benefits from performance reporting tools is capable of writing the code to create them. Having an intuitive user interface — like Userpilot’s no-code builder — makes reporting accessible for both tech and non-tech team members.
Top 8 performance reporting solutions for different departments
Once you have narrowed down your list of performance reporting software to ones that offer all of our listed must-have features, you can begin looking into the tools that are the best fit for your company. To help you make a smart decision, here are eight of the best tools found on the market.
Userpilot
Userpilot is a digital adoption platform (DAP) known for its no-code data analytics features that offer incredible insight into improving performance and reducing churn for SaaS companies. This ensures that every web app or product can serve all accounts while maintaining profitability.

What performance reports does it offer?
- User insights. It offers a quick view over activity patterns so you know how your product is performing in general. You can also take this data and break it down into segments.

- Product insights. Userpilot provides a variety of product insights tools that collect important data regarding your product’s performance. Gather product usage data across all clients, conduct a thorough analysis of your active users, grab a report on popular events, and much more.

- Funnel, retention, and trends reports. This feature lets you focus on the data, trends, and other insights that have value to you. See how well clients replicate actions you want them to take with funnels. Conduct a cohort retention analysis and discover trends in how different client groups use your product.

Pricing
Userpilot’s transparent pricing ranges from $249/month on the entry-level end to an Enterprise tier for larger companies.
Furthermore, Userpilot’s entry-level plan includes access to all UI patterns and should include everything that most mid-market SaaS businesses need to get started.
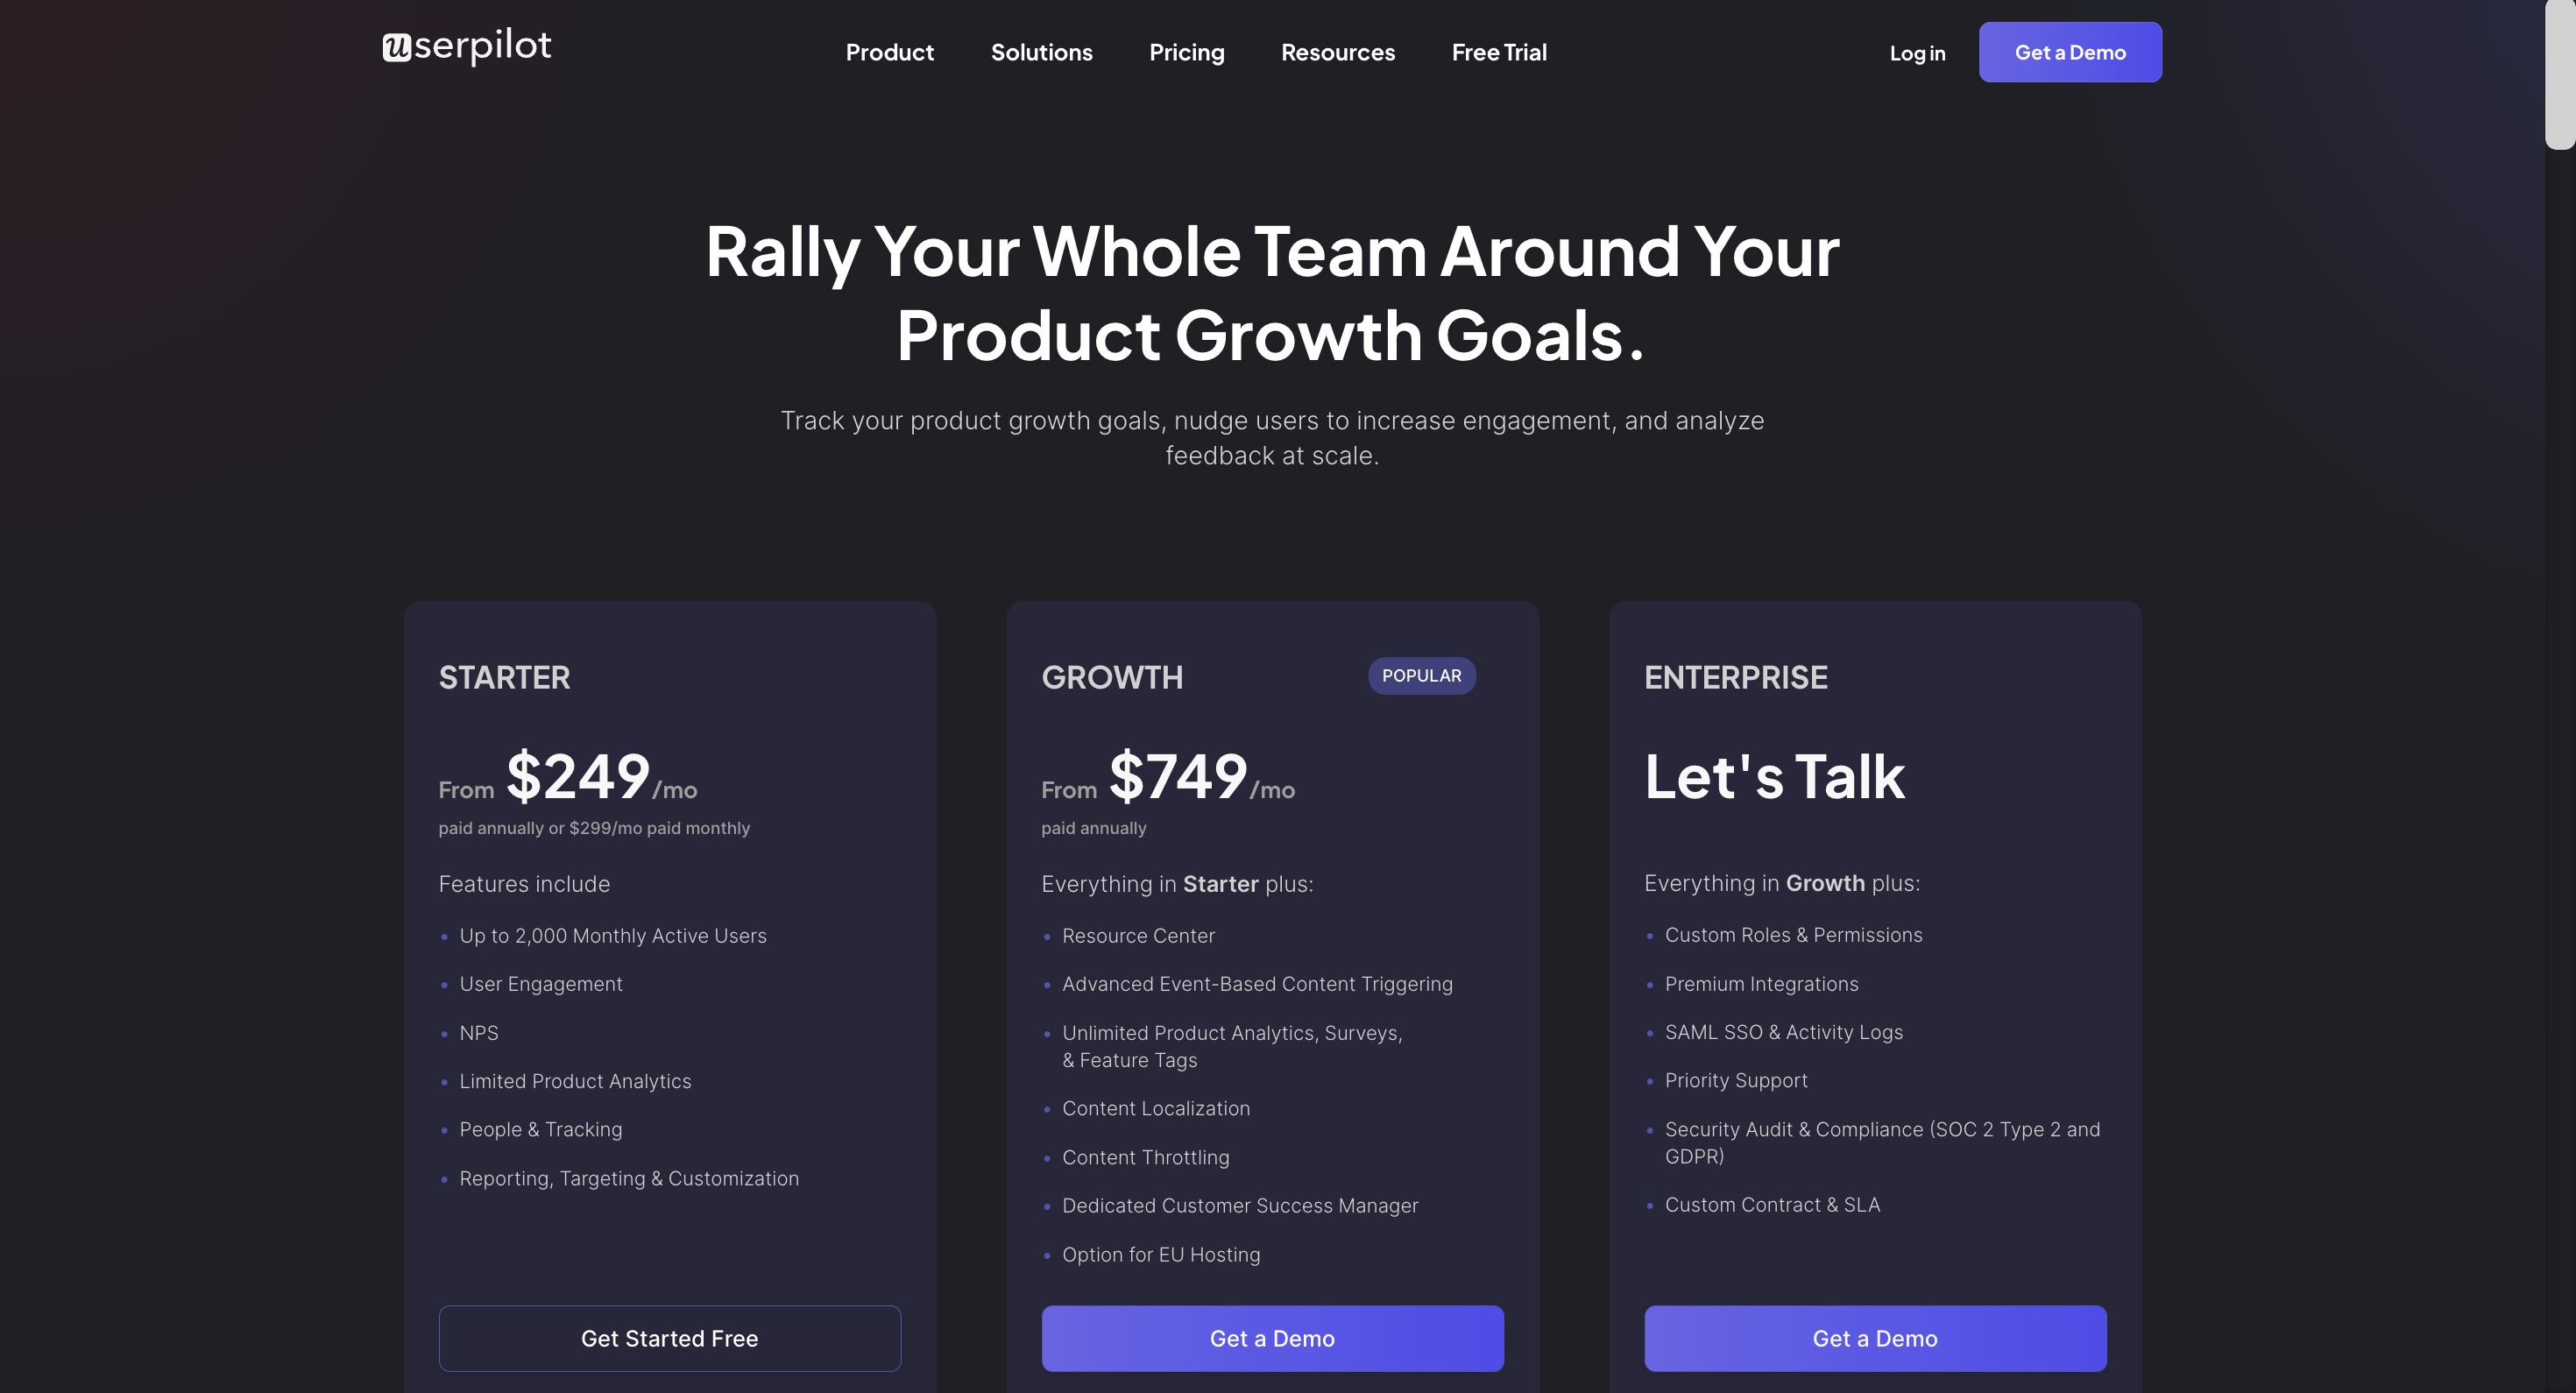
Userpilot has three paid plans to choose from:
- Starter: The entry-level Starter plan starts at $249/month and includes features like segmentation, product analytics, reporting, user engagement, NPS feedback, and customization.
- Growth: The Growth plan starts at $749/month and includes features like resource centers, advanced event-based triggers, unlimited feature tagging, AI-powered content localization, EU hosting options, and a dedicated customer success manager.
- Enterprise: The Enterprise plan uses custom pricing and includes all the features from Starter + Growth plus custom roles/permissions, access to premium integrations, priority support, custom contract, SLA, SAML SSO, activity logs, security audit, and compliance (SOC 2/GDPR).
Hotjar
Hotjar is a well-known heatmap and performance reporting tool.

What performance reports does it offer?
Hotjar is best known for offering extensive performance reporting tools with regard to UX performance.
- Heatmaps. Heatmaps visually represent what and where your users are most actively engaged within your website. This feature works across platforms, allowing you to customize and optimize for customers on PC, mobile, or tablet.
- Session recordings. Hotjar’s session recordings let you track cursor movements, scrolls, and user clicks on your website. This gives you insights into actual customer behavior so you can adjust everything towards optimization.
- Clicks. Hotjar reports on all clicks that clients do on your website. They show where customers click, what they click on, and what they like clicking most. This especially includes dead clicks where customers expect an element to be interactive.
Pricing
Hotjar offers three paid plans, ranging between $48/month to $128/month, as well as a free plan. They also offer a 15-day free trial for their first two paid tiers.

FullStory
FullStory is a digital experience intelligence (DXI) system developed to optimize overall user experience.

What performance reports does it offer?
FullStory is designed to collect and interpret data relevant to user behavior and user experience.
- Heatmaps. FullStory comes with a heatmap functionality that shows what your customers gravitate toward when visiting your website. Gain relevant data on what captures your customers’ attention and design your website around it.
- Session replays. Session replay from FullStory creates a snapshot of all the actions clients partook in as they interacted with your product.
- Scroll depth. See how far customers got and where they dropped off with their scroll depth feature. You can also have it visually represented with FullStory’s Scroll Maps.
- Frustration signals. Know what upsets your clients when interacting with your website with analysis on dead clicks, rage clicks, error clicks, and much more. FullStory can immediately alert you on friction points and offer insight on how to resolve them.
Pricing
FullStory gives three paid plans (Business, Advanced, and Enterprise) that are calculated on a quote-based model. It has a free plan as well as a 14-day free trial on their Business plan.

Mixpanel
Mixpanel is a product insights software that reports on advanced user behavior criteria.

What performance reports does it offer?
Mixpanel creates advanced reports that present metrics designed around your business’s key performance indicators.
- User traffic. Mixpanel tallies site visitors and segments them by how frequently they visit your website. Know how well your campaign performs by keeping track of new users. With reports on DAUs and MAUs, discover whether your business succeeds in maintaining customer satisfaction.
- Revenue. Mixpanel monitors revenue and contextualizes it within different cohorts to present whether goals are met or are on course. Seeing dips and peaks in revenue with its performance reporting tools lets you zone in on campaigns that worked and places that need improvement.
- Product usage. You can also get reports on product usage and profile the ideal user of your product. Mixpanel lets you gain important insight into what needs more work for more people to adopt a product.
- User behavior. Mixpanel is best known for collecting and interpreting data on user behavior. Mixpanel’s performance reporting tools range from funnels and flows that keep track of customer journeys to retention tables that represent user engagement over a period of time.
Pricing
Mixpanel offers two paid plans (ranging from $20/month to $833/month) as well as a free plan. Mixpanel also offers the first full year for free to startups less than five years old that avail of any of the paid plans.

Databox
Databox is a performance management platform with tools to help foster product growth.

What performance reports does it offer?
Databox is proficient in business analytics which is key to optimal performance reporting.
- Reports & data boards. Databox not only collects a wide variety of raw data but also presents them with easy-to-understand and visually intuitive reports. Databox’s data boards allow you to monitor key performance metrics in one location and compare them to previous performances.
- Metrics, business goals, KPIs. Databox lets you choose from a plethora of templates built around various metrics. This keeps every report detailed but concise.
- Custom metric builder. You can also build personalized reports containing data that you find more relevant to your decision-making process.
- Data calculation. Databox offers comprehensive data analysis, especially with Databox’s generative AI. Databox’s AI not only summarizes your metrics into digestible reports but also offers recommendations to increase performance.
Pricing
Databox offers four paid plans (from $47/month to $799/month) as well as a free plan and a 14-day free trial. Each plan comes with three data source (DS) connections for free, with an increase to your monthly fee for each additional DS connection, as well as other add-ons.

Tableau
Tableau is a leading data and analytics platform with integrated data management for data-driven decision-making.

What performance reports does it offer?
Tableau’s performance reporting tools specialize in data visualization that helps translate raw data into easy-to-read reports.
- Data analytics. Tableau monitors a multitude of data points, interprets them, and presents them in a highly intuitive and readable report. Create reports and make intuitive decisions with data analytics from Tableau’s cloud-based platform.
- Data visualization. Its strong data visualization software lets you easily build charts from scratch and create customizable reports with its drag-and-drop interactive dashboards.
- Data preparation. Set the parameters on how to interpret your data sets and put more efficiency into your data analytics.
Pricing
Tableau offers three pain plans (ranging from $15/month to $75/month) as well as a 14-day free trial.

Geckoboard
Geckoboard is a data visualization tool that makes performance reporting seamless with its real-time dashboards.

What performance reports does it offer?
Geckoboard makes data visualization for your business KPIs both quick and easy with its highly intuitive dashboards that are also easily shareable with your entire team. Specifically, it helps you pull data from 80+ third-party integrations and leverage 70+ templates to speed up the process.
- Massive data source integration. Geckoboard has pre-built integration with a total of 80+ data sources. This allows you to make a comprehensive report in Geckoboard from data collected via other integrated software, all without writing a single line of code.
- Template libraries. Reduce the hassle of creating your own dashboard and make use of templates already tailored to meet your needs. Choose from 70+ templates within Geckoboard’s catalog that mirror real business dashboards from other successful companies.
Pricing
Geckoboard offers three paid plans (ranging from $49/month to $699/month) with a specific number of dashboards you can create for every tier. You can choose to add more dashboards to your plan for a higher monthly fee. Geckoboard also offers a 14-day free trial.

Ahrefs
Ahrefs is a search engine optimization (SEO) software that helps increase reach and encourage conversion.

What performance reports does it offer?
Ahrefs showcases straightforward data by collecting traditionally measured data points.
- Traffic. Ahrefs collects your website traffic and allows you to place it against your competitors to see how you fare compared to them. Optimize client engagement by discovering what your customers search for and customize your website to bring more traffic.
- SEO metrics. Ahrefs allows you to see where you show up in search engine searches and discover what pages bring the largest traffic.
Pricing
Ahrefs offers four paid plans (from Lite’s $99/month to Enterprise’s $999/month) with options to customize plans for additional monthly fees.

Conclusion
The ability to make well-informed, data-driven decisions is crucial for risk management and financial planning. In the same way that investment managers have a portfolio management client portal, SaaS companies need performance reporting software that takes the guesswork out of decision-making.
When you’re ready to secure the ability to make well-informed and data-driven decisions, sign up for your free Userpilot demo today!

