The 4 most important tools for data-first product development

One of the biggest challenges of building a product is that your users often don’t know what features they want or need. They just know what outcome they want to achieve by using the product.
Even when users think they know what they want, they may not always be right. It’s only after they’ve made a feature request, you’ve shipped it, and they’ve tried it out that they realize, “Oh wait, that’s not the outcome I expected. I guess I actually need something different.”
Of course, there are strategies for getting very helpful information from long-form user interviews, but some of the most consistent and reliable input for product developers comes from a data-first approach that’s powered by data-gathering tools. Here’s a rundown of the four most important types of tools for this approach and how they deliver quantitative and qualitative insights to help builders truly understand users’ motivation and objectives—and ultimately build better products.
What exactly is a “data-first” approach to product development?
In a product development context, a data-first (also called data-informed or data-driven) approach is a way of building an app or software that uses quantitative and/or large-scale qualitative data and iterative testing to guide decisions. This is in contrast to an approach that relies on things like prior knowledge, gut feeling, or purely anecdotal feedback. We prefer the data-first approach here at Mixpanel because it’s a more efficient and systematic method that helps us get to a better iteration of the product faster.
To take a data-first or data-informed approach, you need to know exactly what baseline metric or metrics you’re working with. Your baseline is your starting point and it could be something like an activation rate or conversion rate that you’d like to improve. Knowing your baseline is critical because it helps you create an effective solution and prove meaningful impact.
At Mixpanel, we spend quite a bit of time getting a good understanding of this baseline before we execute any experiments. That includes being aware of things like seasonal fluctuations and other important contextual information.
For example, imagine a hypothetical situation where we agree to tweak the product to achieve a 40% conversion rate. In that situation, it’d be helpful to know the baseline conversion rate we’re trying to improve, especially if it is comparatively low, say 20%. Having this baseline information allows product builders to push back and recommend a more reasonable target in this hypothetical situation instead of going along with an overly ambitious and unrealistic jump from 20% to 40%. Baseline data helps you set up your team for success.
The benefits
There are three main advantages that a data-informed approach gives you:
- A way to prove impact: Executing a project or experiment is only half the battle—you also have to be able to show the impact. A data-first approach provides visibility into the effectiveness of every iteration or new feature.
- Ideas for improvement: It’s much easier to pinpoint where things went wrong if you have data. (Did an experiment fail because of an execution issue in the code, or was it an unexpected flaw in the user experience?)
- A good alternative when users don’t know what they want (or like): Everyone wants to be user-focused. The problem is users don’t always tell us when they like or dislike a feature. Sometimes they can’t articulate what they want and we’ll get feedback like, “I just want this to be easier.” Data is the perfect complement to often-imperfect qualitative user feedback.
The obstacles
So why don’t more teams take a data-first approach? It’s probably not because they don’t want to. There are a few barriers:
- Not having (good) data: Product builders may be hesitant because they don’t know if their data is accurate or robust enough.
- Not having the resources or skills: Even if a team has the data, they still need someone to analyze that data and use it to inform ideas for improving the product—and extra bandwidth is not something that most product teams have.
- Not having enough time: This is probably the most common challenge. Often we just don’t have enough time to dedicate to collecting baseline data beforehand, executing the experiment (some tests might require weeks or even months to reach statistical significance), and doing post-analysis.
How we follow a data-first approach at Mixpanel
Our product and engineering teams use a multi-pronged approach to gather data to find out what users don’t—or can’t—tell us. We use four key tools to support the process:
1. Product analytics
The first step in our workflow is usually to look at Mixpanel for any interesting quantitative product usage data. For example, we recently made some changes to our invite modal, which prompts users to invite other people to try out Mixpanel.
But for some reason, the new version of the modal, which was supposed to be better, had a lower CVR (conversion rate). We went through all the signals that we’d collected in our funnel analysis report in Mixpanel to analyze each step that users took. These steps might look something like:
- “User opens modal”
- “Data has been loaded”
- “User inputs data”
- “User clicks ‘Send invite’”
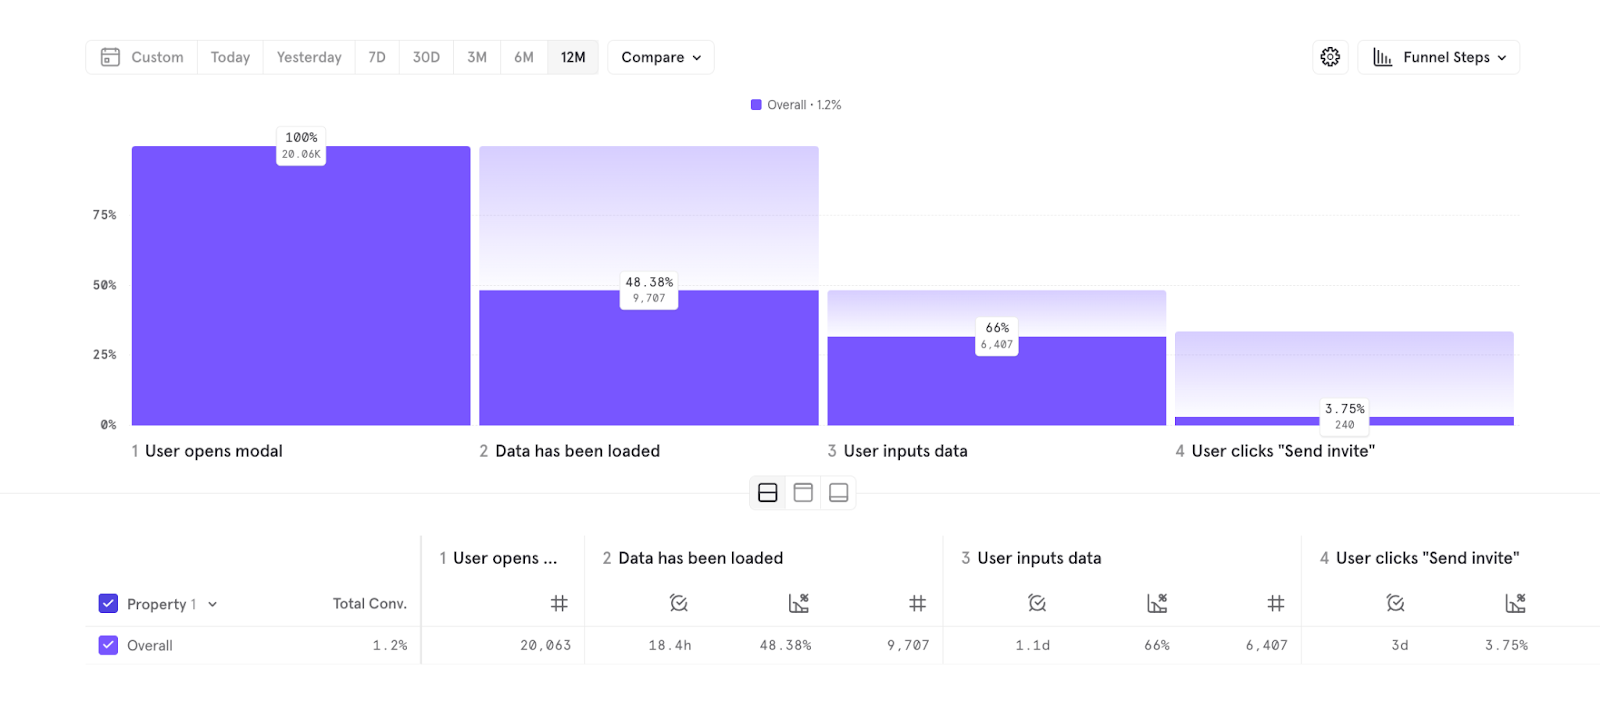
Initially, our primary metrics were “User opens modal” and “User clicks ‘Send invite’”—this was essentially the two-step funnel we were tracking. When we analyzed all the individual steps between these two metrics, we saw that at least 5% of the drop-off was occurring at the loading screen. This helped us come up with our hypothesis, which was quickly proven right: If we remove the loading screen, we can increase the CVR of our primary metric by 5%.
2. Session recordings
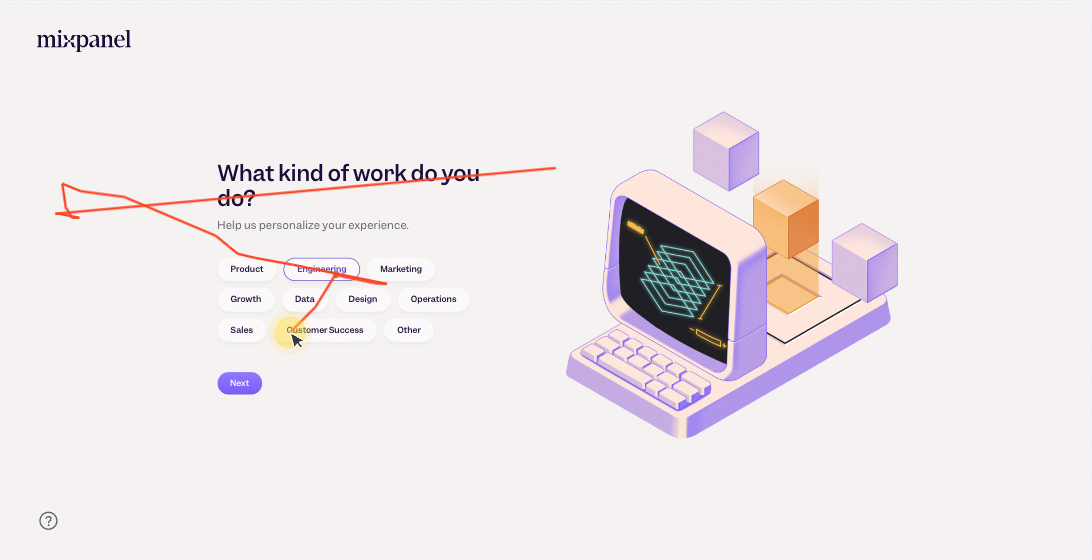
From there, we can drill down into problem areas using screen or session recordings from a tool like Hotjar, which lets us see what the user sees, from their perspective, as they click through our website or software. Hotjar even highlights the user’s cursor so you can follow where they’re hovering or pausing (which might tell you they’re puzzled or taking longer to read through something).
These recordings are extremely useful because together with the product analytics in Mixpanel, they give us a 360-degree view of how someone is navigating or using a product.
For example, we recently shipped a new setup page UI along with an onboarding checklist. When we checked our metrics in Mixpanel, we noticed that the engagement rate was not as good as we expected after the update—but this information alone didn’t tell us much about what we could fix.
So we compared the data with Hotjar session recordings, which helped us realize that some of the UI elements didn’t have enough of a visual cue to look interactive. Users didn’t know if they should click a button or enter an input next. Because of this, they just dropped off and didn’t take action at all. Armed with both sets of data, we were able to make some improvements, and engagement shot up by about 20%.
3. A/B tests
Besides tools like Hotjar and Mixpanel, basic A/B tests (or “split-tests”) are a key part of any engineering team’s toolkit. We use them frequently to experiment with ways to convert signups to paid users and help users get to “aha” moments faster. Typically, we’ll make a feature available as a test to a certain subset of users and see if that test results in better results (like higher engagement, more conversions, and so on).
A/B tests are very versatile, and you can test variations of anything from web pages to elements in the app interface. For example, does a blue CTA button drive more conversions than, say, a black button? Or does having a social proof banner further up on your website increase engagement? You can A/B test almost anything you can think of, whether that’s in a product, on a webpage, or in an email.
However, even though A/B tests are standard practice, it sometimes doesn’t make sense to rely only on an A/B test because it can take a long time to get a statistically significant result if a feature or page has low traffic. In these cases, we can use qualitative feedback like a sentiment survey or NPS.
4. NPS
NPS, or Net Promoter Score, tells you how likely your users are to recommend your product to their colleagues and networks.
We use Sprig to collect NPS and verbatim feedback from our users via targeted surveys within the product, and this has been one of the top sources of qualitative feedback for us. Beyond just gauging NPS, you can set up custom survey questions as well, with response options like open text, multiple choice, and rating scales.
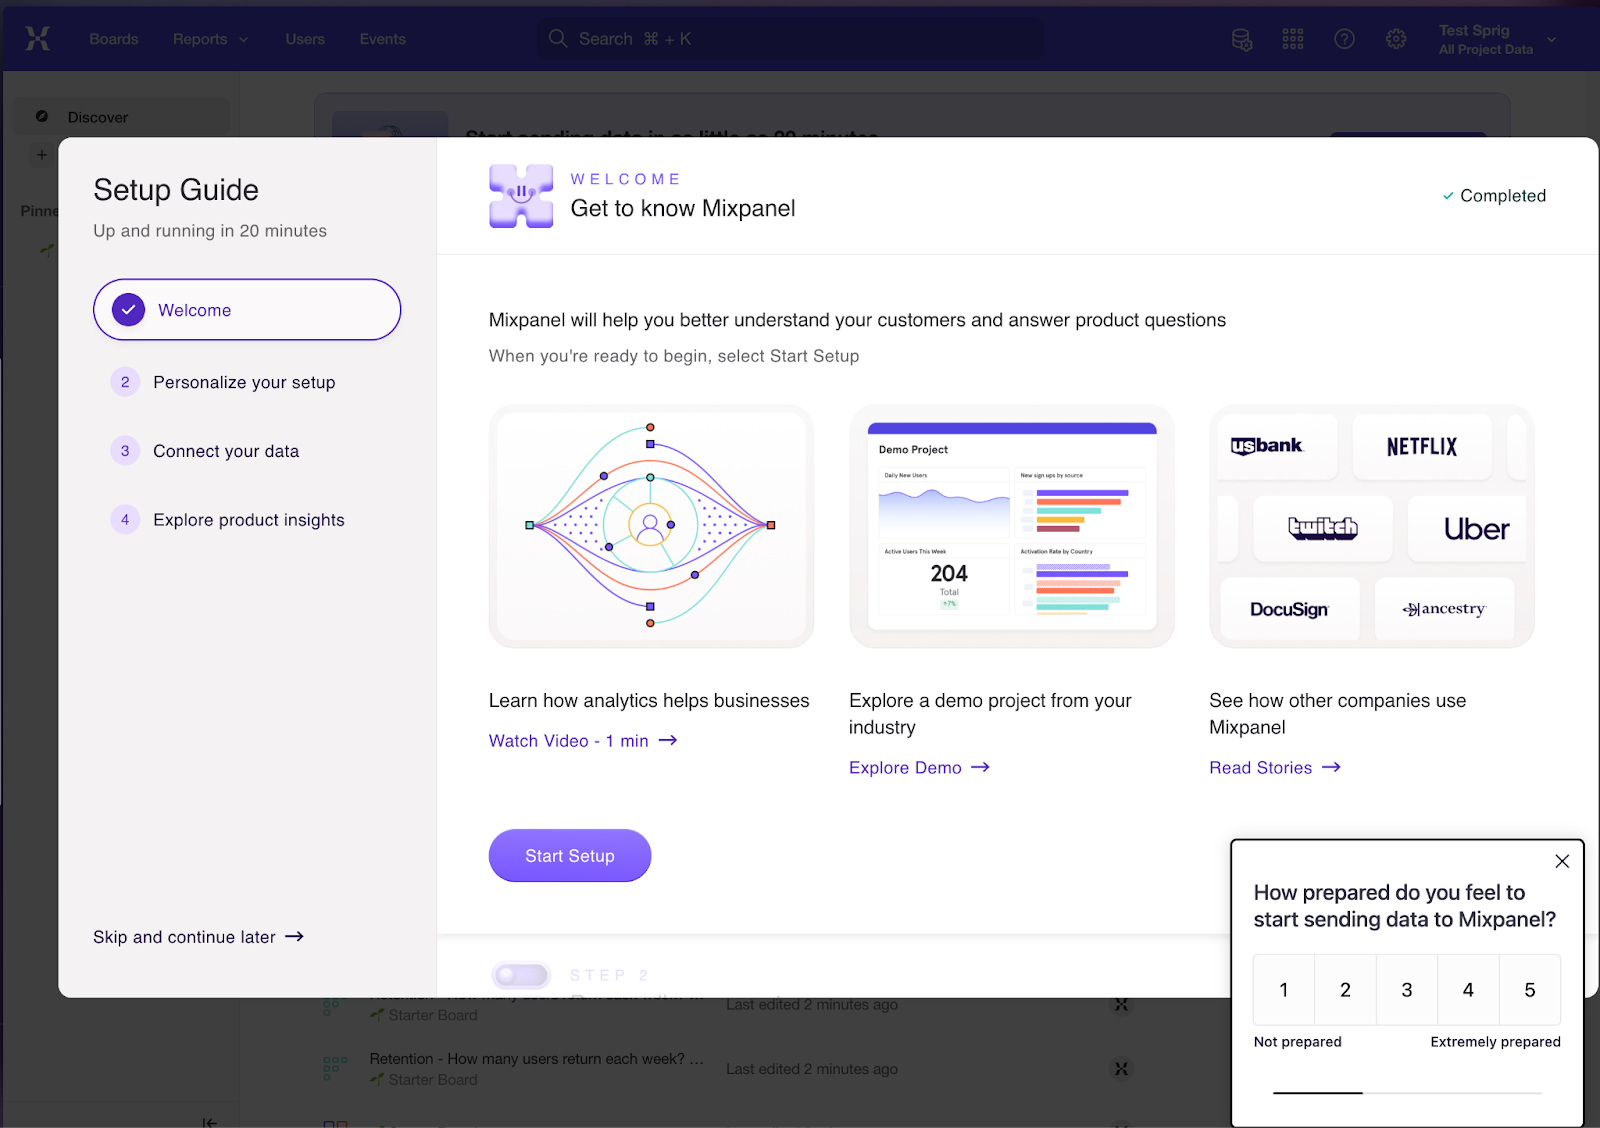
While Hotjar and Mixpanel provide implicit signals that hint at where we should dig deeper, Sprig gives us very explicit cues that help us extend our analysis of those implicit signals further. Leveraging a good balance of these explicit signals and implicit quantitative data gives you the best chance at overall success—if you over-index on explicit signals, you’ll typically end up catering to a very small subset of users (either extremely happy or extremely unhappy), whereas using implicit signals comes with its innate challenges, such as interpreting the data correctly.
Use both quantitative and qualitative data to keep users happy
Contrary to what many people think, you don’t need a complicated or even super-robust process to start building in a more data-driven way.
You can start with a simple one- or two-step experiment or funnel—for example, testing whether “Share” or “Invite” converts better on a CTA button—and add more steps as you think of them later. Remember, you don’t have to get it right the first time. What’s more important is you have a solid starting point that you can iterate on as you continue to gather more data.
Get fast access to product, marketing, and company revenue insights for your whole team with Mixpanel’s powerful, self-serve analytics. Try it for free.