
The Software Equity Group (SEG) regularly publishes quantitative research on the software and SaaS market M&A activity. The SEG SaaS Index contains dozens of publicly traded SaaS companies. They recently published their SEG 2023 Annual SaaS Report. It provides a ton of data on SaaS valuations and financial operating metrics. The impact of the market downturn can be clearly seen across all categories of SaaS.
I have extracted a few key data points including:
- SEG SaaS Index: YTD Stock Market Performance
- SEG SaaS Index: Public Market Multiples
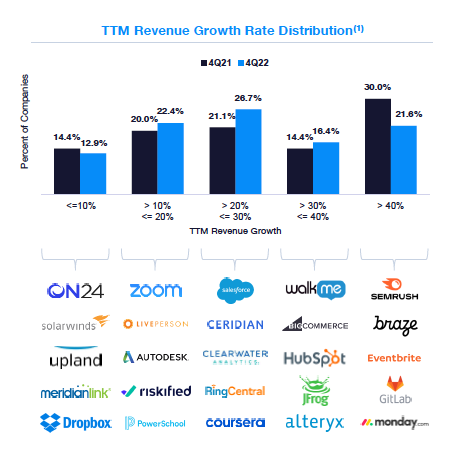
- TTM Revenue Growth Rate Distribution
- SEG SaaS Index: Public Market Multiples Monthly TTM
- SEG SaaS Index: Financial Performance
- Select Companies by Weighted Rule of 40%
- Median TTM Revenue Growth by SaaS Category
- Median EV/TTM Revenue Multiple by SaaS Category
- SEG SaaS Index: Top 20 By EV/TTM Revenue
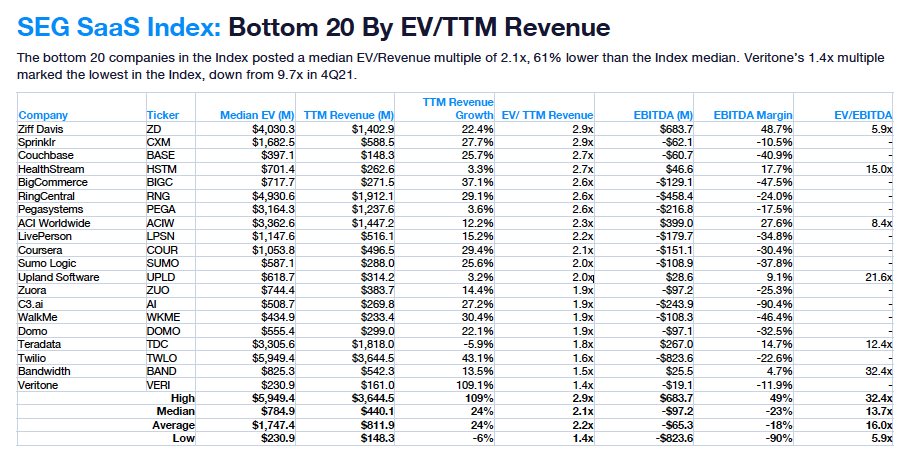
- SEG SaaS Index: Bottom 20 By EV/TTM Revenue
- M&A Volume: Overall Software Industry
- SaaS M&A Highlights: Deal Volume
- SaaS M&A Highlights: Top Product Categories By Deal Volume
SEG SaaS Index: YTD Stock Market Performance

SEG SaaS Index: Public Market Multiples

TTM Revenue Growth Rate Distribution
SEG SaaS Index: Public Market Multiples Monthly TTM

SEG SaaS Index: Financial Performance


Select Companies by Weighted Rule of 40%

Median TTM Revenue Growth by SaaS Category

Median EV/TTM Revenue Multiple by SaaS Category

SEG SaaS Index: Top 20 By EV/TTM Revenue

SEG SaaS Index: Bottom 20 By EV/TTM Revenue
M&A Volume: Overall Software Industry

SaaS M&A Highlights: Deal Volume

SaaS M&A Highlights: Top Product Categories By Deal Volume

Also published on Medium.