Product Dashboard: What Is It and How to Create One? (+Best Tools)

How can product managers keep tabs on all the KPIs necessary to make informed product decisions without getting swamped with all the irrelevant data out there? The short answer is: with a product dashboard!
In this article, we’re looking at how to build effective product manager dashboards and the key metrics you may want to populate them with at different stages of the product lifecycle.
We also explore tools for building product dashboards and data analysis.
Intrigued? Let’s get to it.
TL;DR
- A product dashboard is a visual tool for real-time tracking of the performance of selected product metrics.
- Product dashboards help promote data-driven decision-making within organizations and ensure alignment of team members with product and organizational goals.
- What metrics you track depends on the product, how well-established it is, and your business goals.
- Product development metrics like velocity are relevant earlier on in the lifecycle, for example, when the team is working on the MVP or new functionality.
- Feature-specific metrics, like Time to Adopt or Feature Adoption Depth, are very important after the feature release.
- Product usage metrics, for example, the Customer Engagement Score, give the product managers a general overview of how the product is performing.
- Customer Satisfaction Score (CSAT), Net Promoter Score (NPS), or Product Market Fit (PMF) are all metrics that reflect user satisfaction with the product and the value it delivers.
- Revenue and product growth-related metrics show how well the product is meeting the company’s goals. Examples of these include the Monthly Recurring Revenue or Customer Lifetime Value.
- Operations teams may include very different metrics from product teams. For example, uptime is an important metric in their context.
- To build solid product dashboards, product managers need to understand their current goals and choose metrics that will enable them to track progress towards them.
- Tools like Tableau or Mixpanel allow teams to track user engagement and business metrics in a lot of detail.
- On top of solid product usage and user behavior analytics, Userpilot offers predesigned dashboard templates and the option to create dashboards from scratch. Curious about how it works? Book the demo!
Try Userpilot and Take Your Product Growth to the Next Level

What are product dashboards?
A product dashboard is a visual tool for tracking the performance of selected product metrics that are relevant at a particular time.
Dashboards allow product managers to keep a pulse on what’s happening to the product at different points of its development.
Why should you use a product management dashboard?
Product dashboards help with the democratization of data within organizations. They are easy to interpret and understand.
As a result, they are perfect for communicating with stakeholders who may not be very confident with data analytics.
This is vital for ensuring alignment within cross-functional product teams. It gives team members a clear picture of their performance and how their actions are affecting the metrics in focus.
A clear advantage of a product analytics dashboard over other tracking tools like spreadsheets is that the data is always up-to-date and allows you to follow real-time changes to the metrics.
Type of product management metrics to track using analytics dashboards
To be effective, product dashboards need to be customized properly and contain only the important metrics. Overcluttering the dashboard will cancel many of its benefits.
That’s why it’s good practice to keep different dashboards for different purposes.
Which metrics you choose to include in our product dashboards very much depends on the product and how mature it is. What’s more, each product team is different and that means they have different ways of organizing their work.
Product development metrics
Product development metrics are indications of development team efficiency.
They allow product managers to see whether the team is on track and estimate how long future increments may take to deliver.
Examples of metrics to add to the product management dashboard
- Velocity – a measure of how much work the team can complete in each iteration. This helps Scrum Masters or project managers to make estimates.
- Story points – are used to describe how much effort a task requires. Agile teams use story points to estimate task duration and measure velocity.
- Time to market – this is the time the team needs to deliver the product to the market from the initial idea.
Feature-specific metrics
Feature-specific metrics give the product manager insight into how each individual feature is performing.
Examples of metrics to add to the product management dashboard
- Time to adopt – the time it takes users to start using the feature regularly, measured from the moment they activate it. A long time to adopt can be an indication of excessive friction or usability issues.
- Feature usage – there are different ways of measuring product usage, like the total number of users or percentage of all users engaging with a feature.
- Feature adoption depth – how often the target customer engages with the feature. It shows you how sticky or easy to use the feature is. If the depth is low, it may mean a lack of demand for the feature.
You can view important metrics and reports related to your core features using Userpilot‘s dashboard.
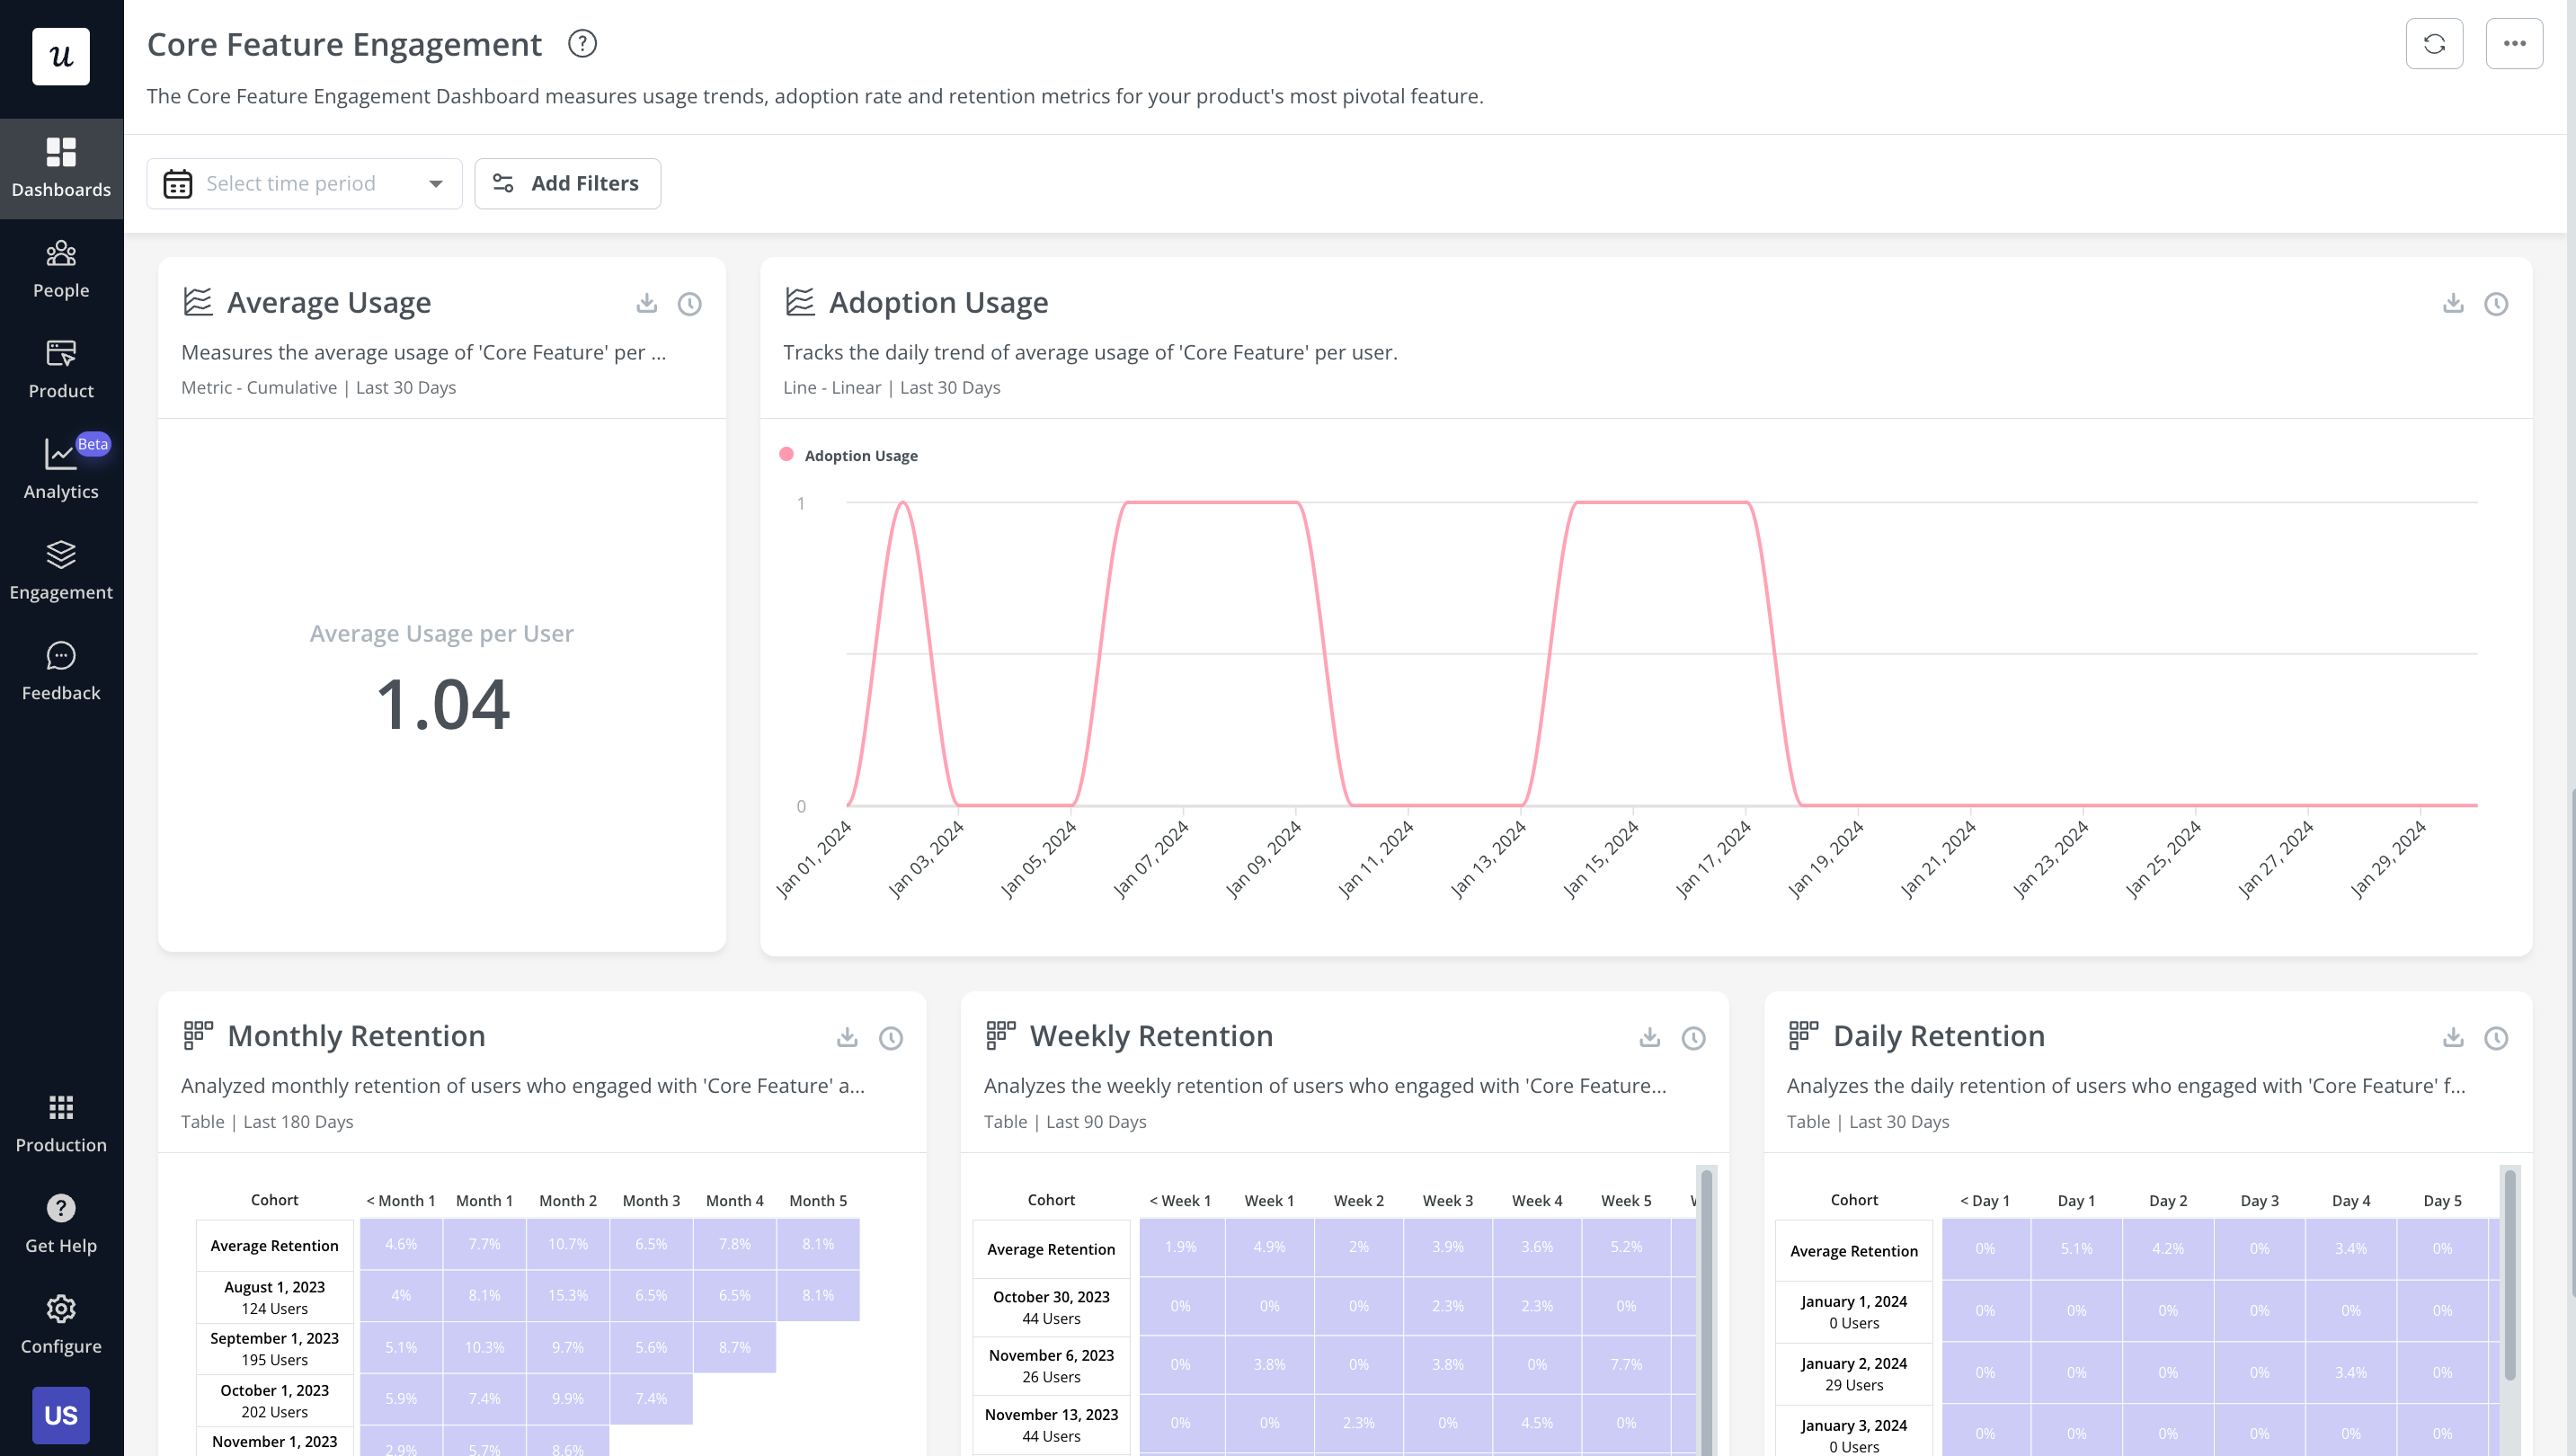
Core Feature Engagement dashboard in Userpilot
Product usage metrics
In contrast, to feature usage metrics, the product usage metrics shed light on user engagement with the product as a whole. They give you insights into user activity and the potential issues they might be encountering.
Examples of metrics to add to the product management dashboard
- Time To Value – the time it takes for a user to reach the AHA! Moment or in other words, experience the product value.
- Customer Engagement Score (CES) – a value assigned to the users that describes how engaged they are. It can help you segment the users into more and less satisfied ones and then track their behavior to identify patterns.
- Product usage stickiness – calculated by dividing Daily Active Users (DAUs) by Monthly Active Users (MAUs). It’s an indication of how valuable and relevant users find our product.
This data visualization dashboard from Userpilot shows important product usage metrics (user activity metrics, average session duration, most visited pages, etc.) and reports (trend of active users, user stickiness, etc.).
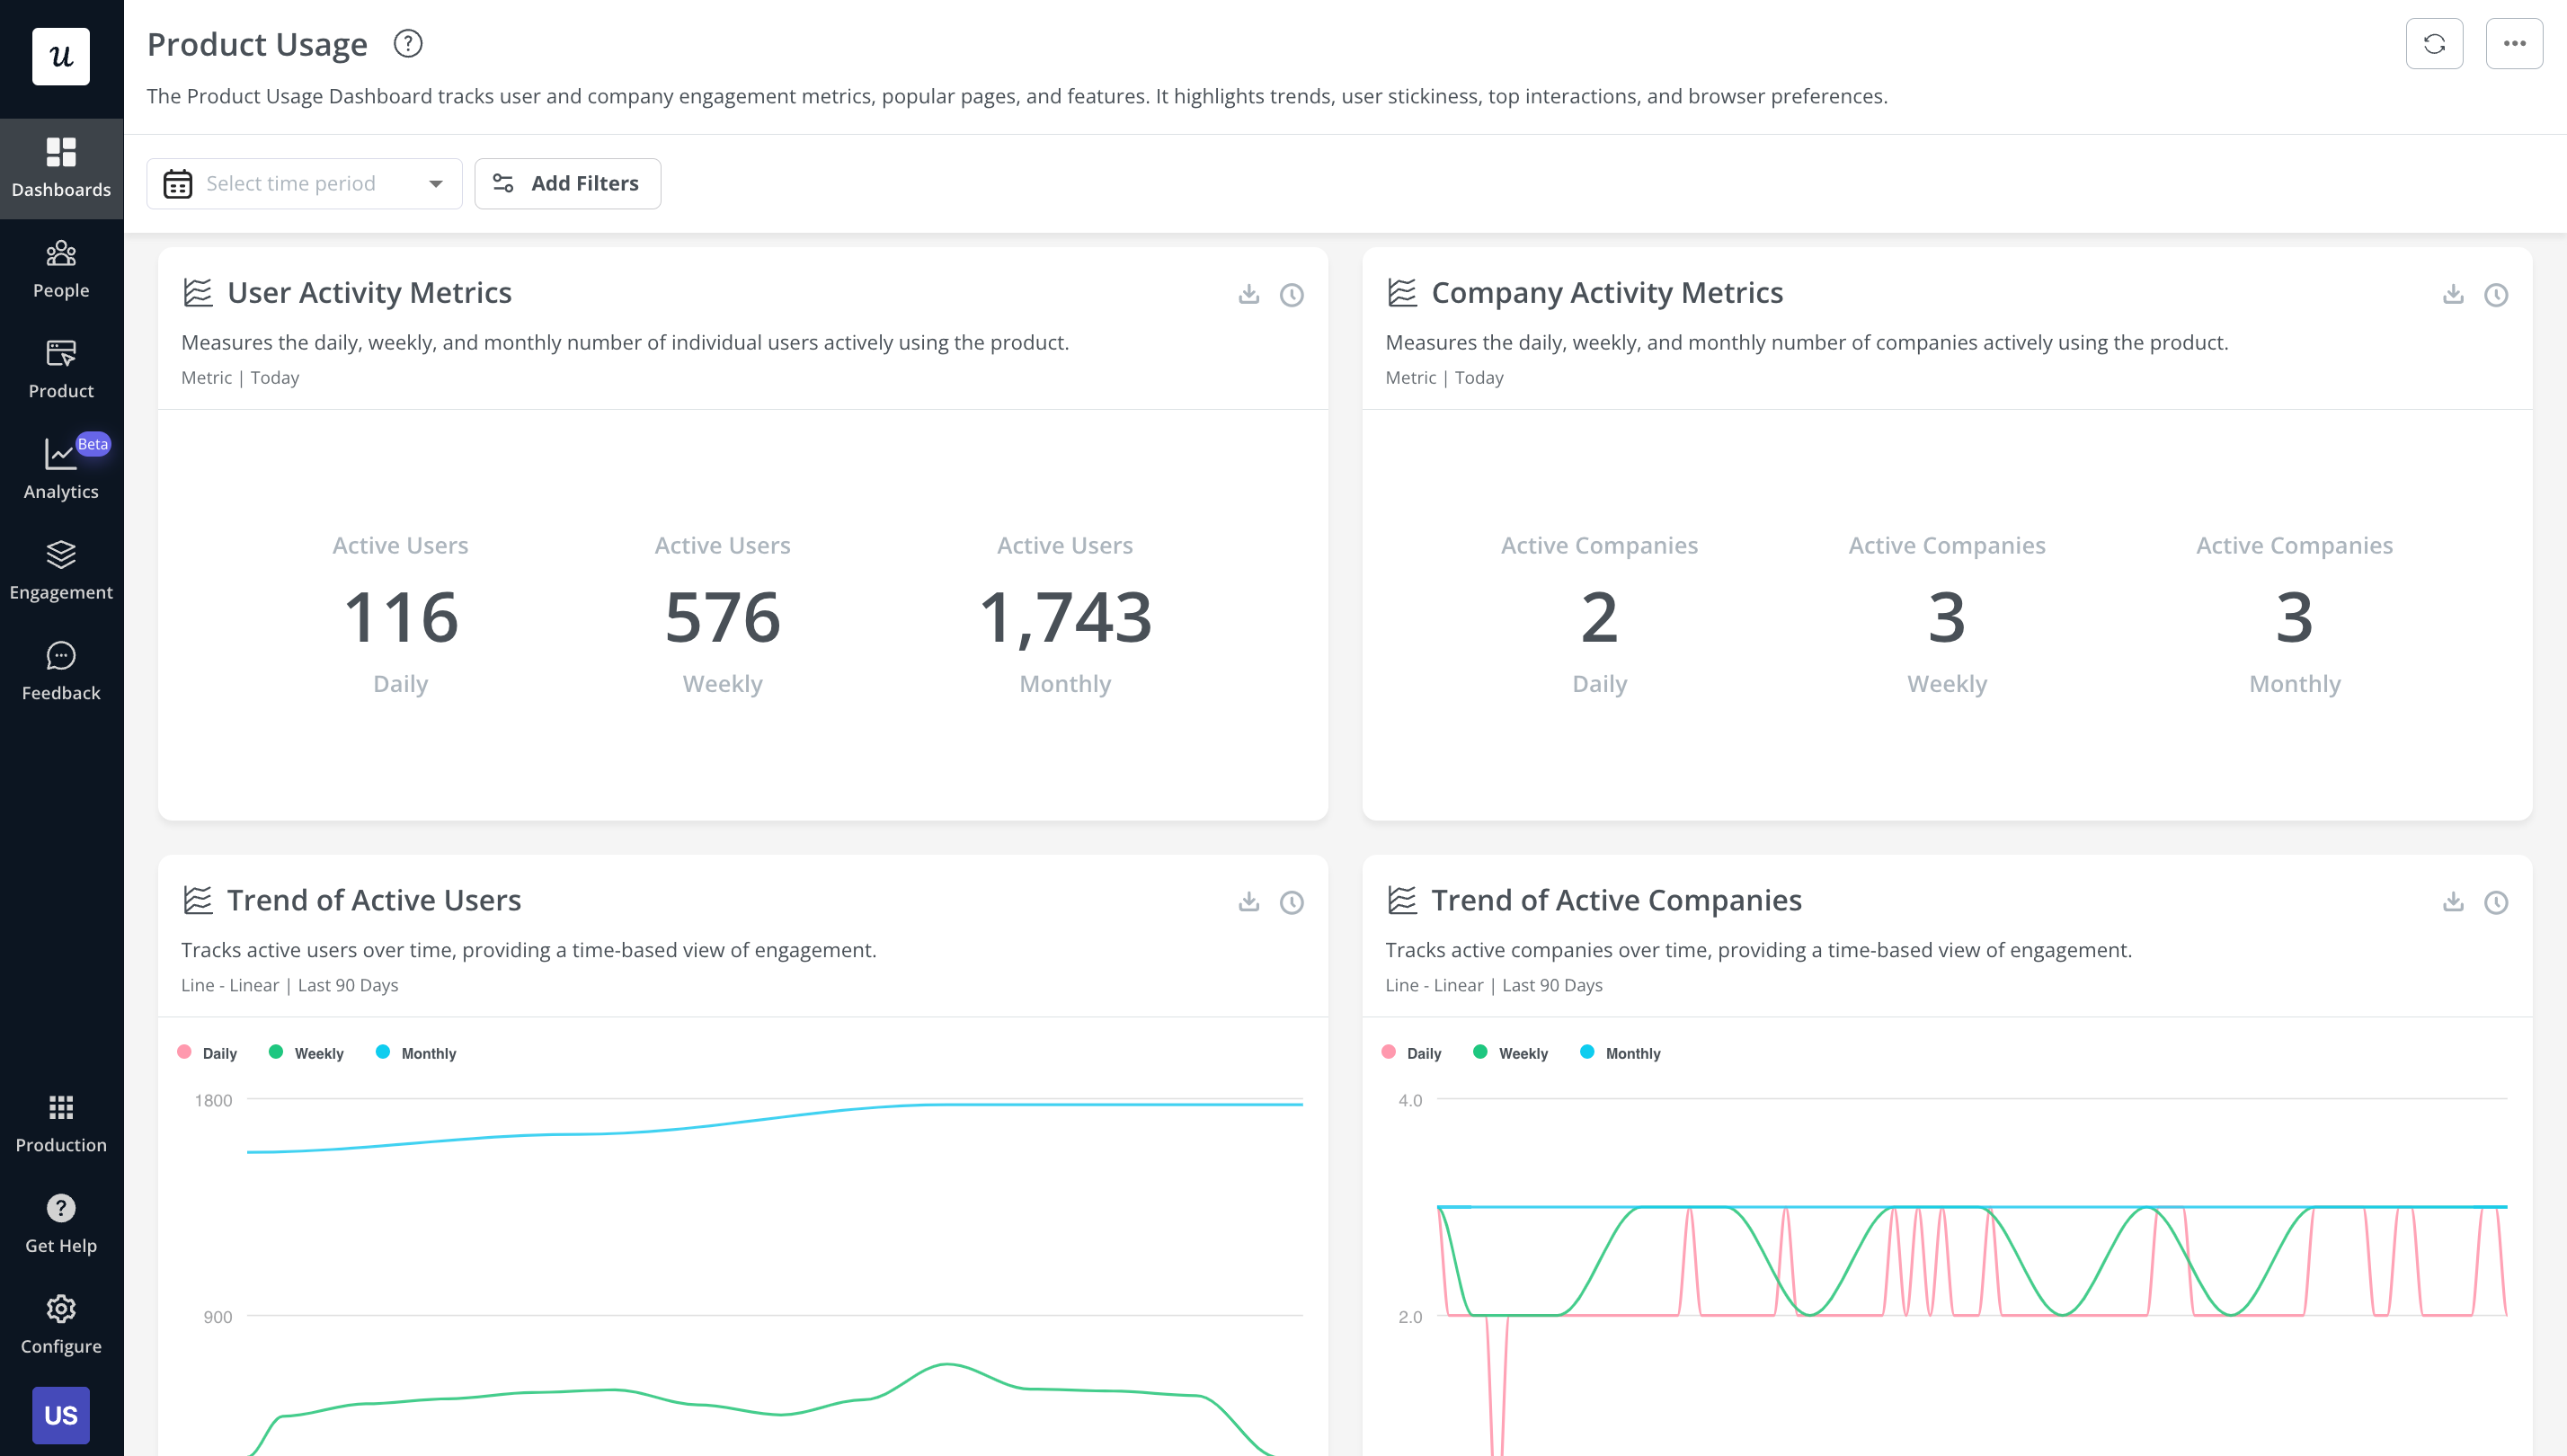
Product Usage dashboard in Userpilot
Customer satisfaction score and related metrics
Customer satisfaction metrics show you how your users feel about our product and how important it is in their lives.
Examples of metrics to add to the product management dashboard
- Customer Satisfaction Score (CSAT) – a numerical value describing how satisfied your existing customers are.
- Product Market Fit (PMF) – tells the product team how good the product is at satisfying market demand. We test it using the Sean Ellis test which asks users how much they would miss the product if they couldn’t use it anymore.
- Net Promoter Score (NPS) – a measure of the user sentiment towards the product. The more promoters there are, the healthier the product is. Just like CSAT, it’s useful for segmenting users and tracking their usage to identify patterns that lead to high/low satisfaction.
- Support tickets – they are an indication of the volume of issues your customers experience. Apart from looking at the number of tickets, you can also look at how quickly they are resolved.
- Retention rate – this is the percentage of how many customers stay with you, use the product, and pay their subscriptions over a period of time. A high retention rate is an indication that your customers are satisfied with the value the product delivers.
Speaking of retention, the below dashboard from Userpilot shows the retention trend for different users and time periods in a quick glance.
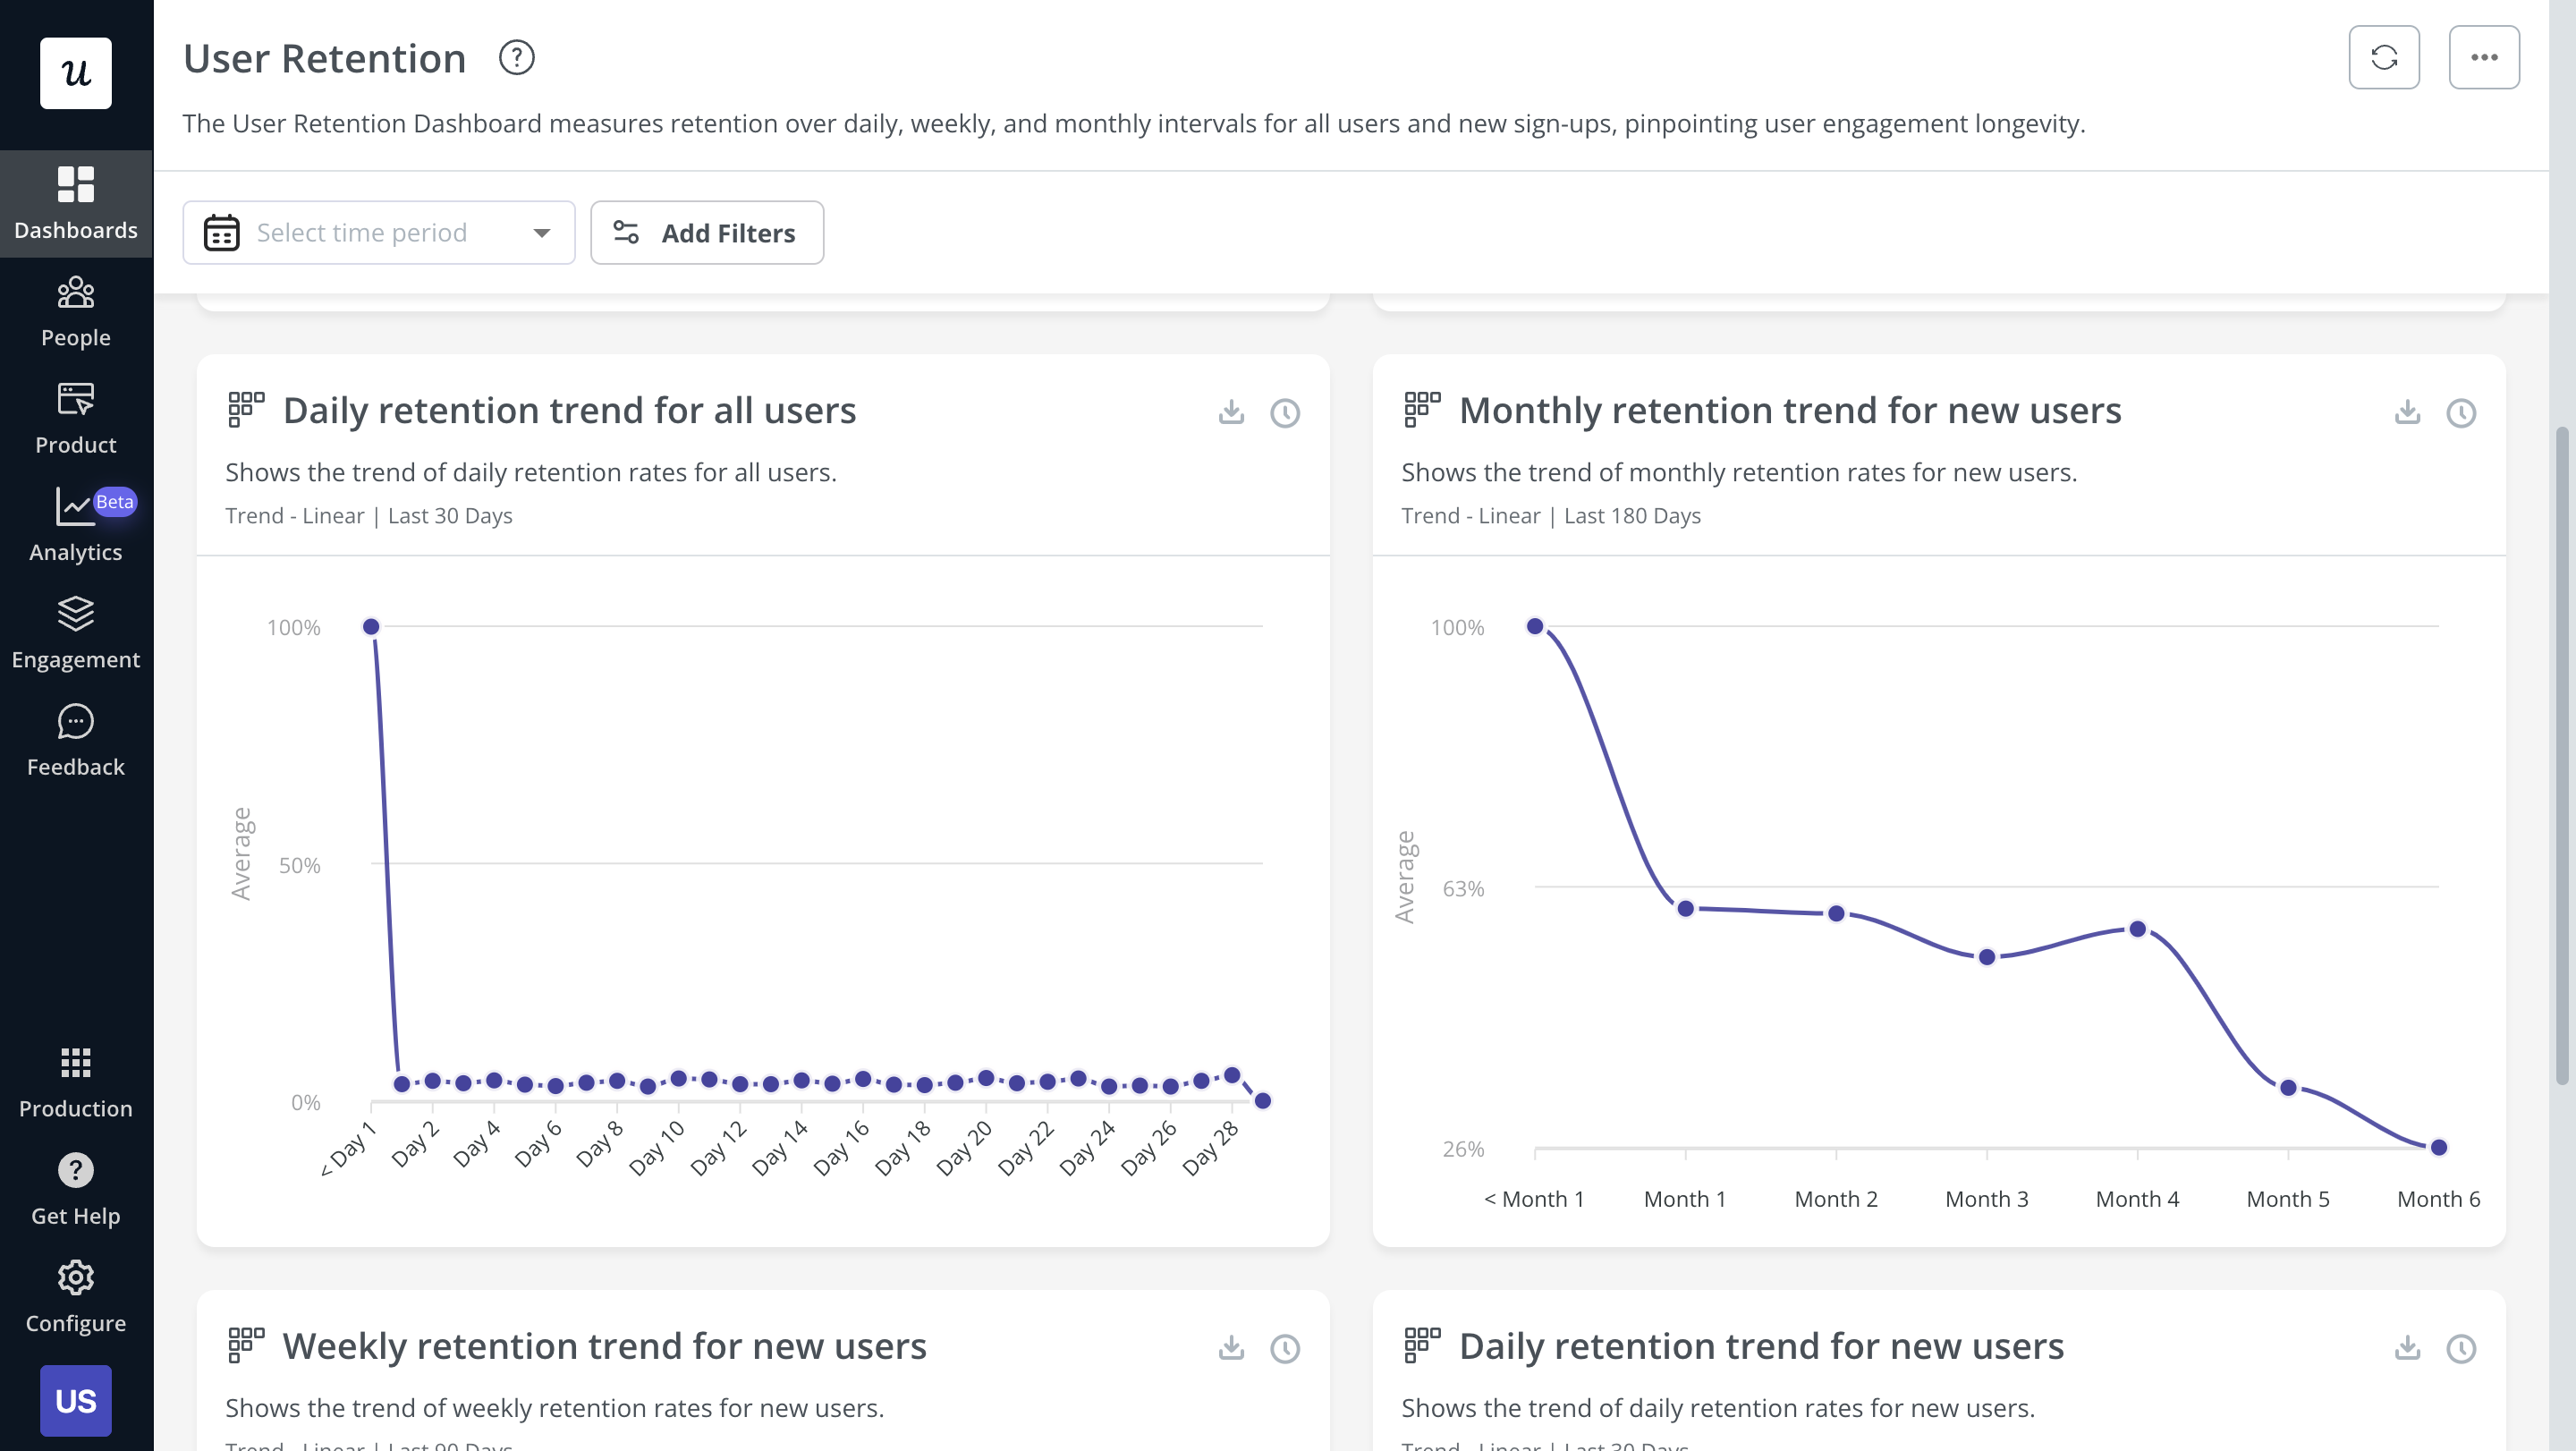
User Retention dashboard in Userpilot
Revenue and product growth-related metrics
Revenue and growth metrics show how well the product is driving the organizational goals and its overall success.
Examples of metrics to add to the product management dashboard
- North Star Metric – one single most important metric which serves as an indicator of the product’s long-term success. It is particularly useful for aligning teams with organizational objectives.
- Customer Acquisition Cost (CAC) – the cost of attracting new customers and closing deals. In SaaS companies, it’s a good indication of how scalable the product is.
- Monthly Recurring Revenue (MRR) – the total revenue the organization can expect to generate from all the active customers in a particular month.
- Average Customer Lifetime Value (Avg LTV) – the revenue an average customer brings to the company over the duration of the relationship. It’s used to predict revenue and overall long-term business success.
- Average Revenue Per User (ARPU) – the average revenue each active customer brings to the company. It helps teams determine the ROI of their marketing ops or evaluate the pricing structure.
- Paid user vs. freemium vs. trial – tracking the number of paid users and their ratio to those using the free version as well as the trial conversion rate helps you evaluate how attractive our premium plans are to users.
Monitoring and system health
Ops teams are going to include different metrics from product teams to efficiently monitor the system’s health.
Examples of metrics to add to the product management dashboard
- Uptime – it’s a surface-level metric that reflects the overall product reliability. For example, 363 days a year or 98.8% of the time.
- Speed – how quick is the product or the system at delivering the desired results.
- Errors – how many errors and how long they take to resolve are also an indication of how reliable the system is.
How to build a product management dashboard
There’s no one dashboard that will fit all products.
Your team needs to develop a number of dashboards corresponding to different stages in the product lifecycle and populate them with relevant data metrics.
However, it’s not enough to have fancy dashboards if no one is tracking or acting on them. That’s why organizations need to have the right process in place and promote a culture of data-driven decision-making.
With that out of the way, let’s start creating our perfect product dashboards.
Identify your most important product management goals
Depending on your goals and how developed your product is, you will be looking at different kinds of metrics to track in your product dashboard, so that’s what you start with.
In the early days, when you’re moving fast and want to launch our MVP, the development metrics will be our main focus.
However, once our product achieves product-market fit and boasts a good number of monthly active users, our interest would shift to tracking product usage, adoption, and customer satisfaction.
When you launch a new feature, you will want to track its performance and that will be the focus of the dashboard.
Select the key metrics to focus on
When you define your goals clearly, you will be able to create a list of data points that you need to track.
At that point, you will be able to choose the exact metrics that will give you the insights you need.
For example, a product launch manager will pay particular attention to new feature usage data or time to adoption and that’s what they will include on their dashboard.
Use a tool to create the product dashboard
The times when product managers had to hack office apps or product development tools to build every single dashboard from scratch are long gone.
Modern analytics tools allow you to bring multiple data points together thanks to built-in integrations.
Apart from dedicated analytics tools like Google Analytics, product growth tools like Userpilot offer predesigned dashboards that populate important metrics and reports. You can also create these dashboards from scratch to visualize the information you want to see.
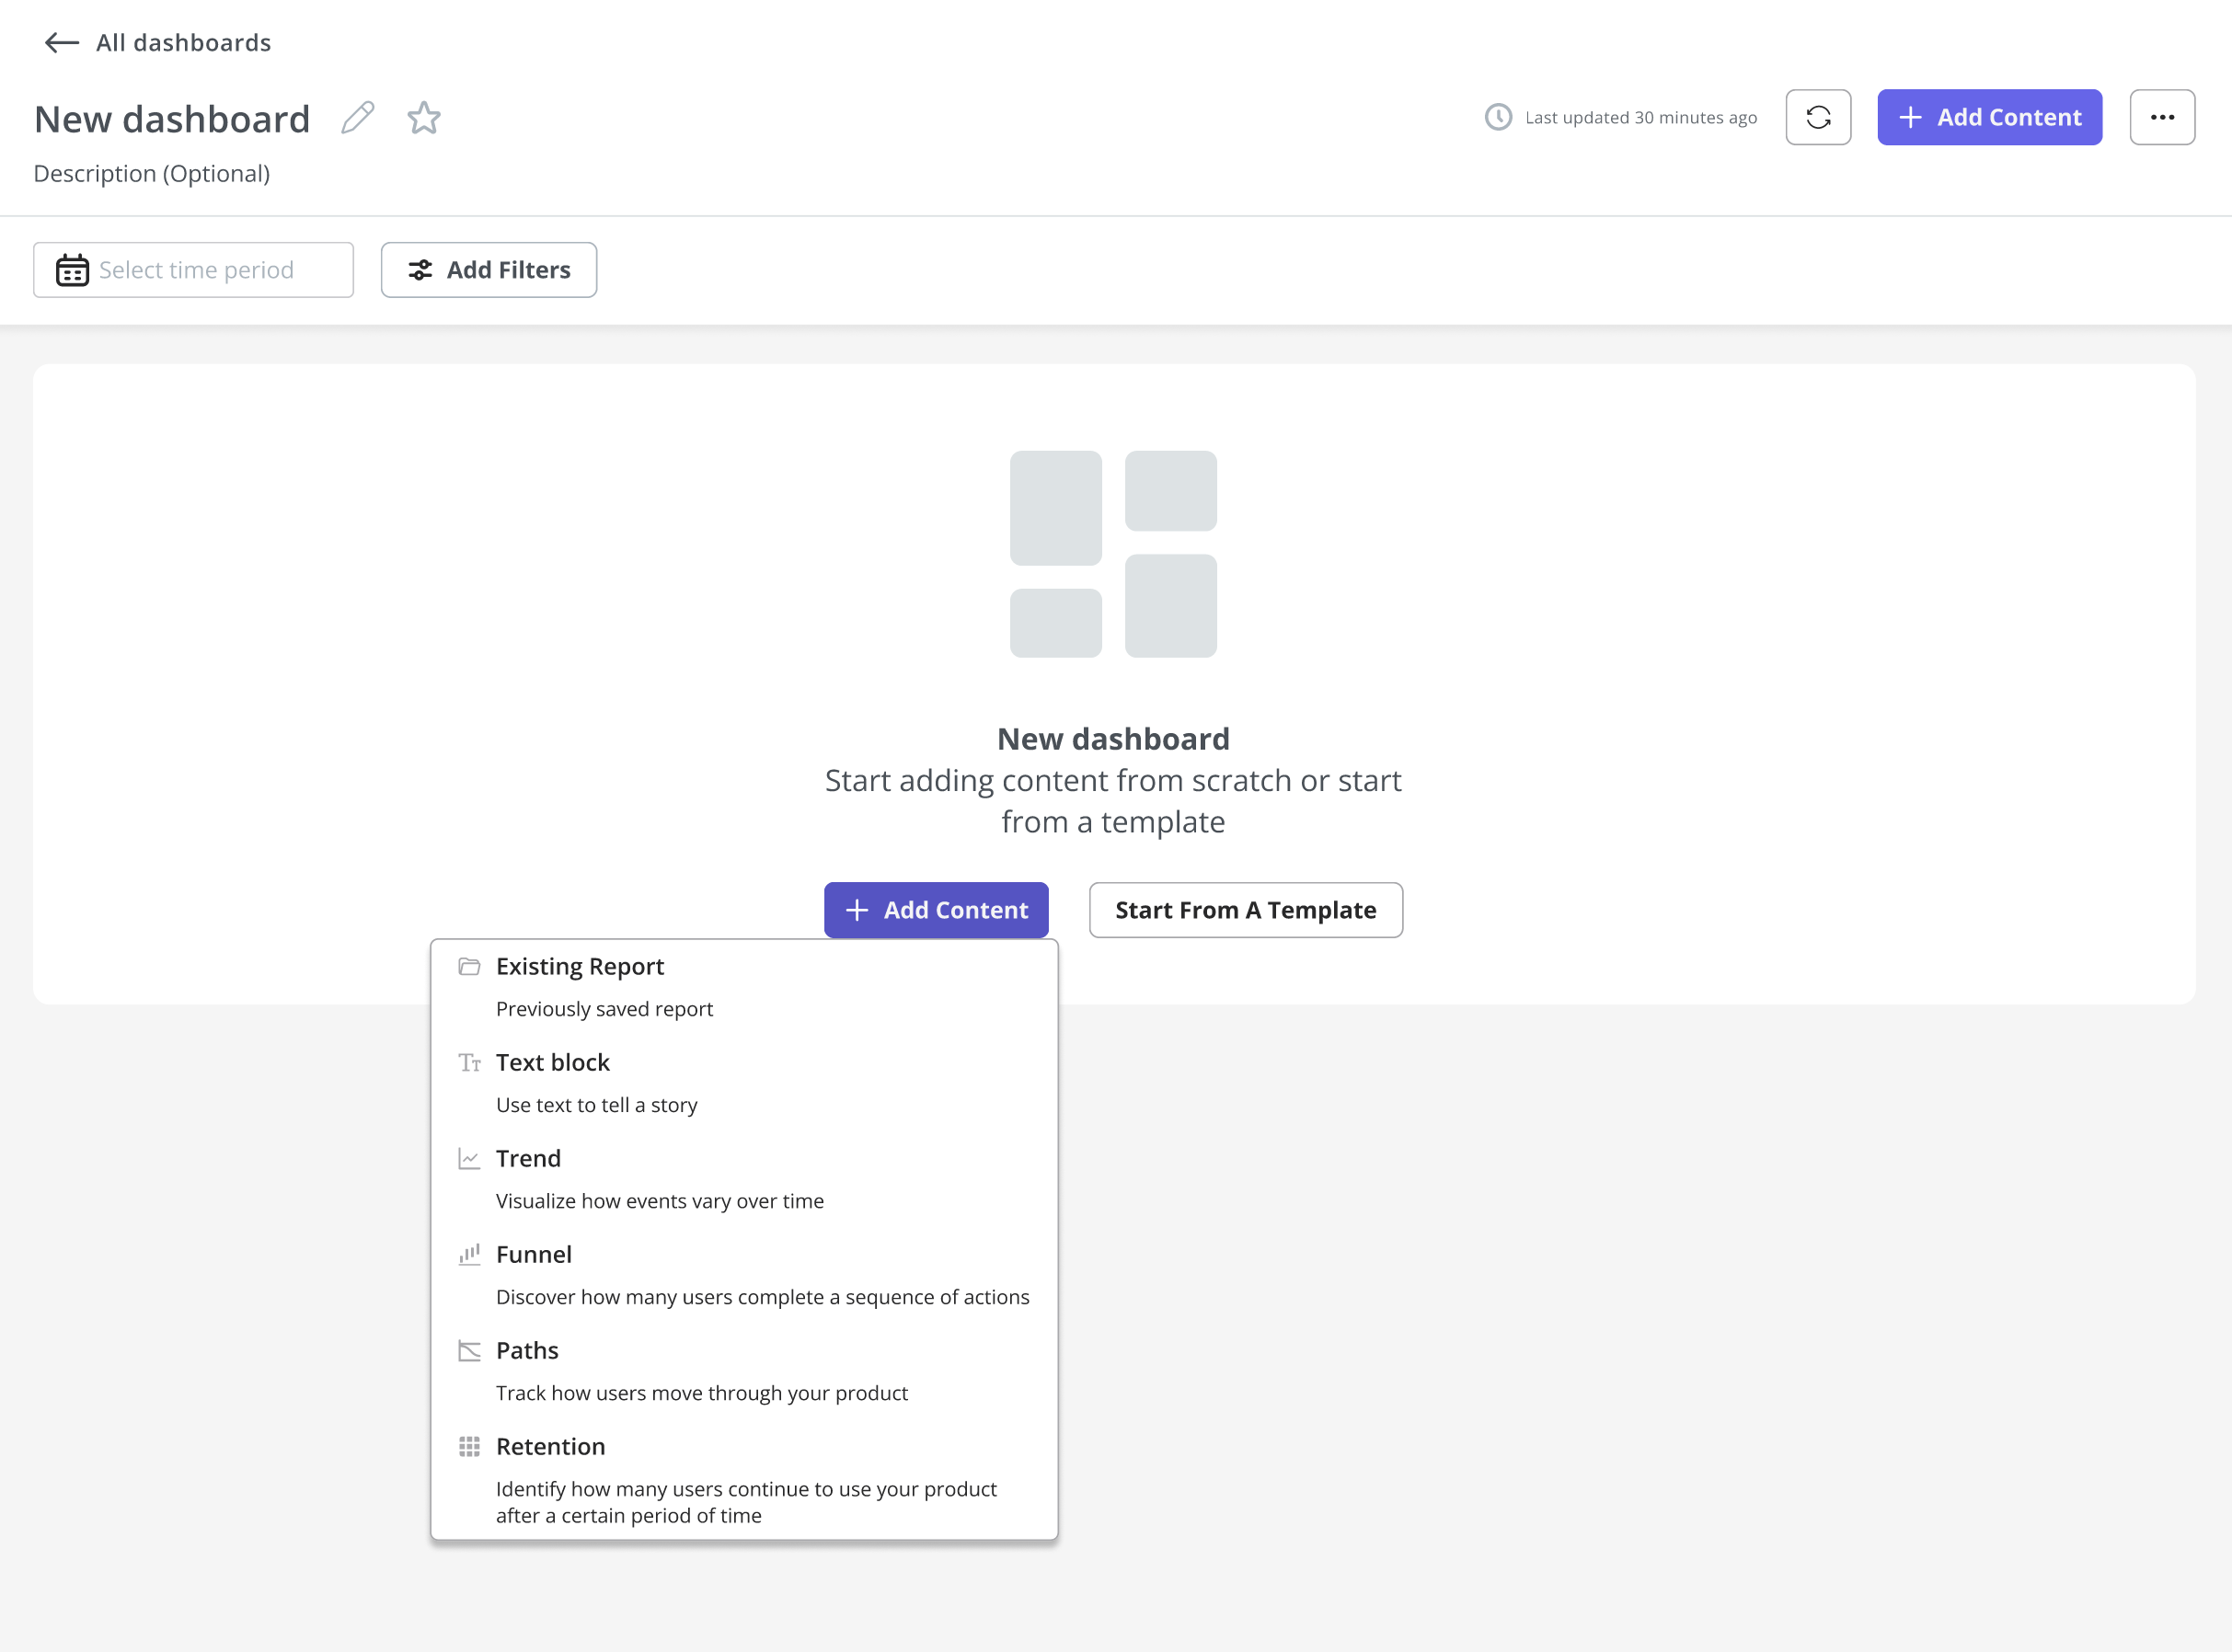
Custom dashboards in Userpilot
Share your dashboards
Once you create your product dashboards, you need to share them across the organization.
This is necessary to drive alignment of all team members and create a shared understanding of the goals and what you’re doing to achieve them within your organization.
While product dashboards are way easier to understand than raw data, don’t take it for granted. If necessary, run training sessions to help internal and external to use the dashboards effectively.
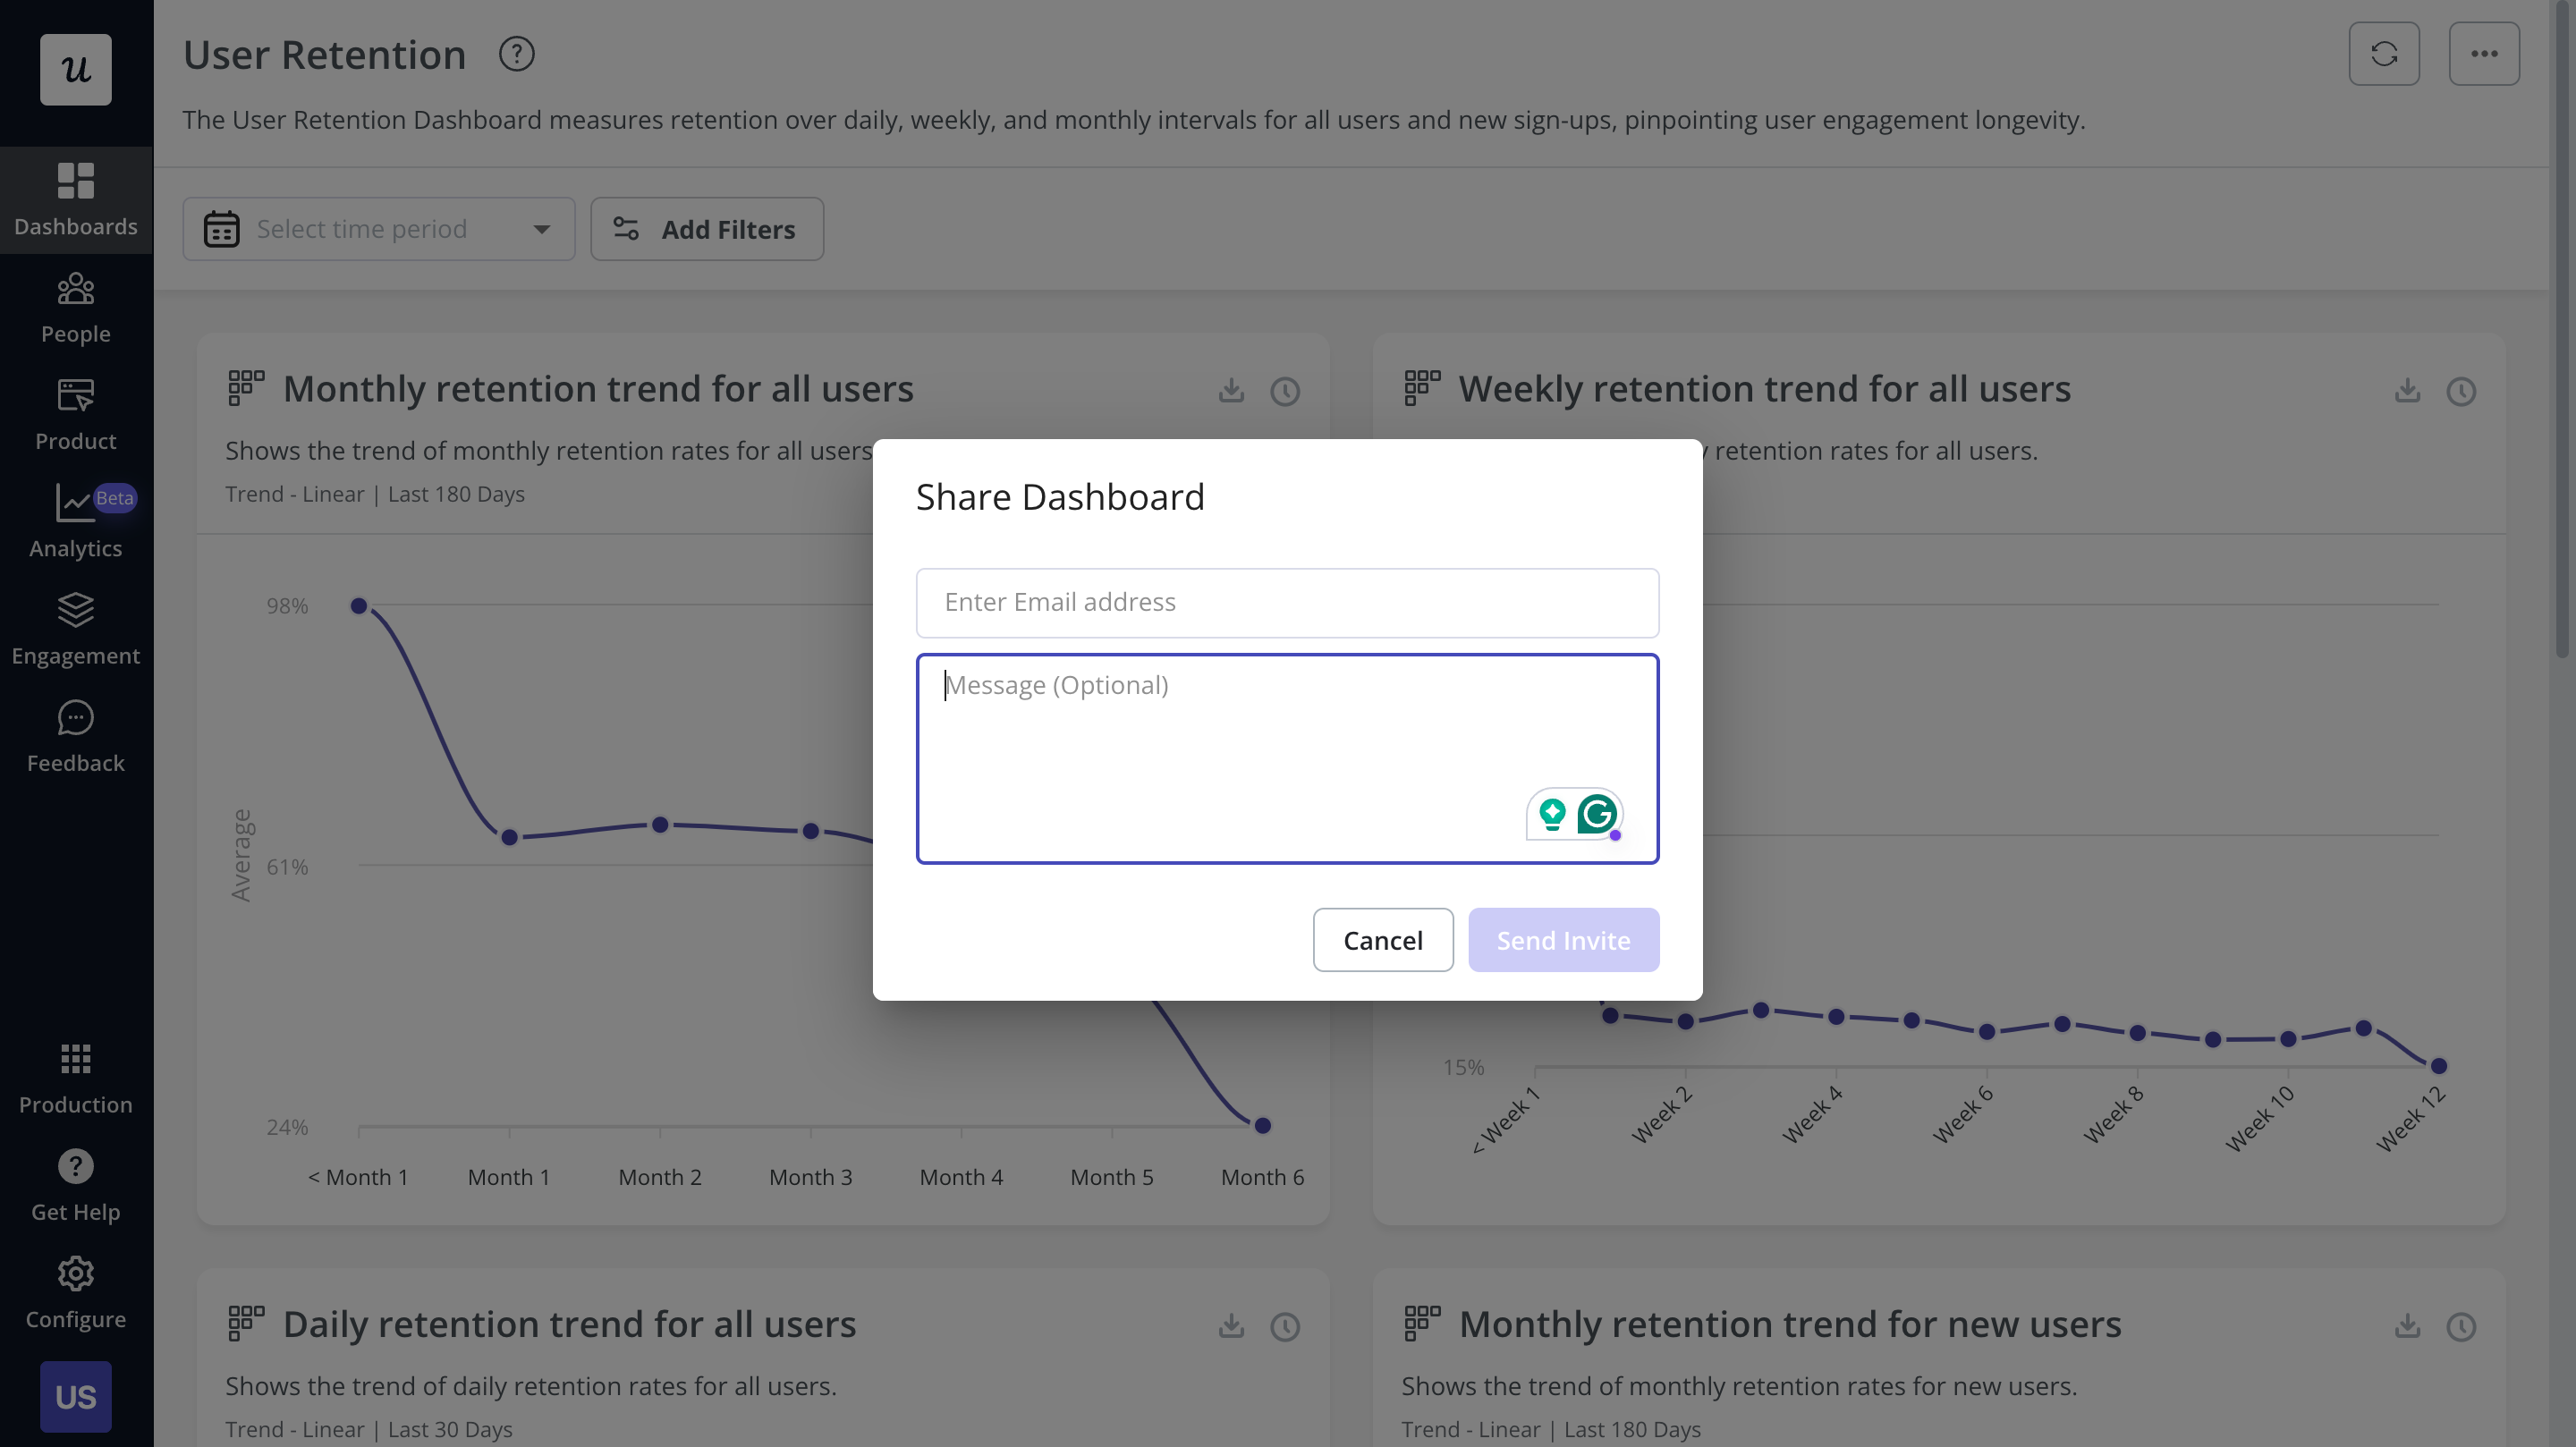
Sharing a dashboard in Userpilot
Product management dashboard tools to visualize user behavior data
So, which tools are the best in the market for creating dashboards and analyzing customer behavior? Let’s look at three popular tools in detail one-by-one.
Userpilot: Product usage analytics and growth tool
When it comes to product growth tools, Userpilot boasts the most advanced analytics functionality.
We’ve already covered that you can use Userpilot’s predesigned templates and custom dashboards feature to visualize metrics. But what else can you track?
To help you understand how your users are engaging with your product, Userpilot allows you to track feature and product usage in a very granular way.
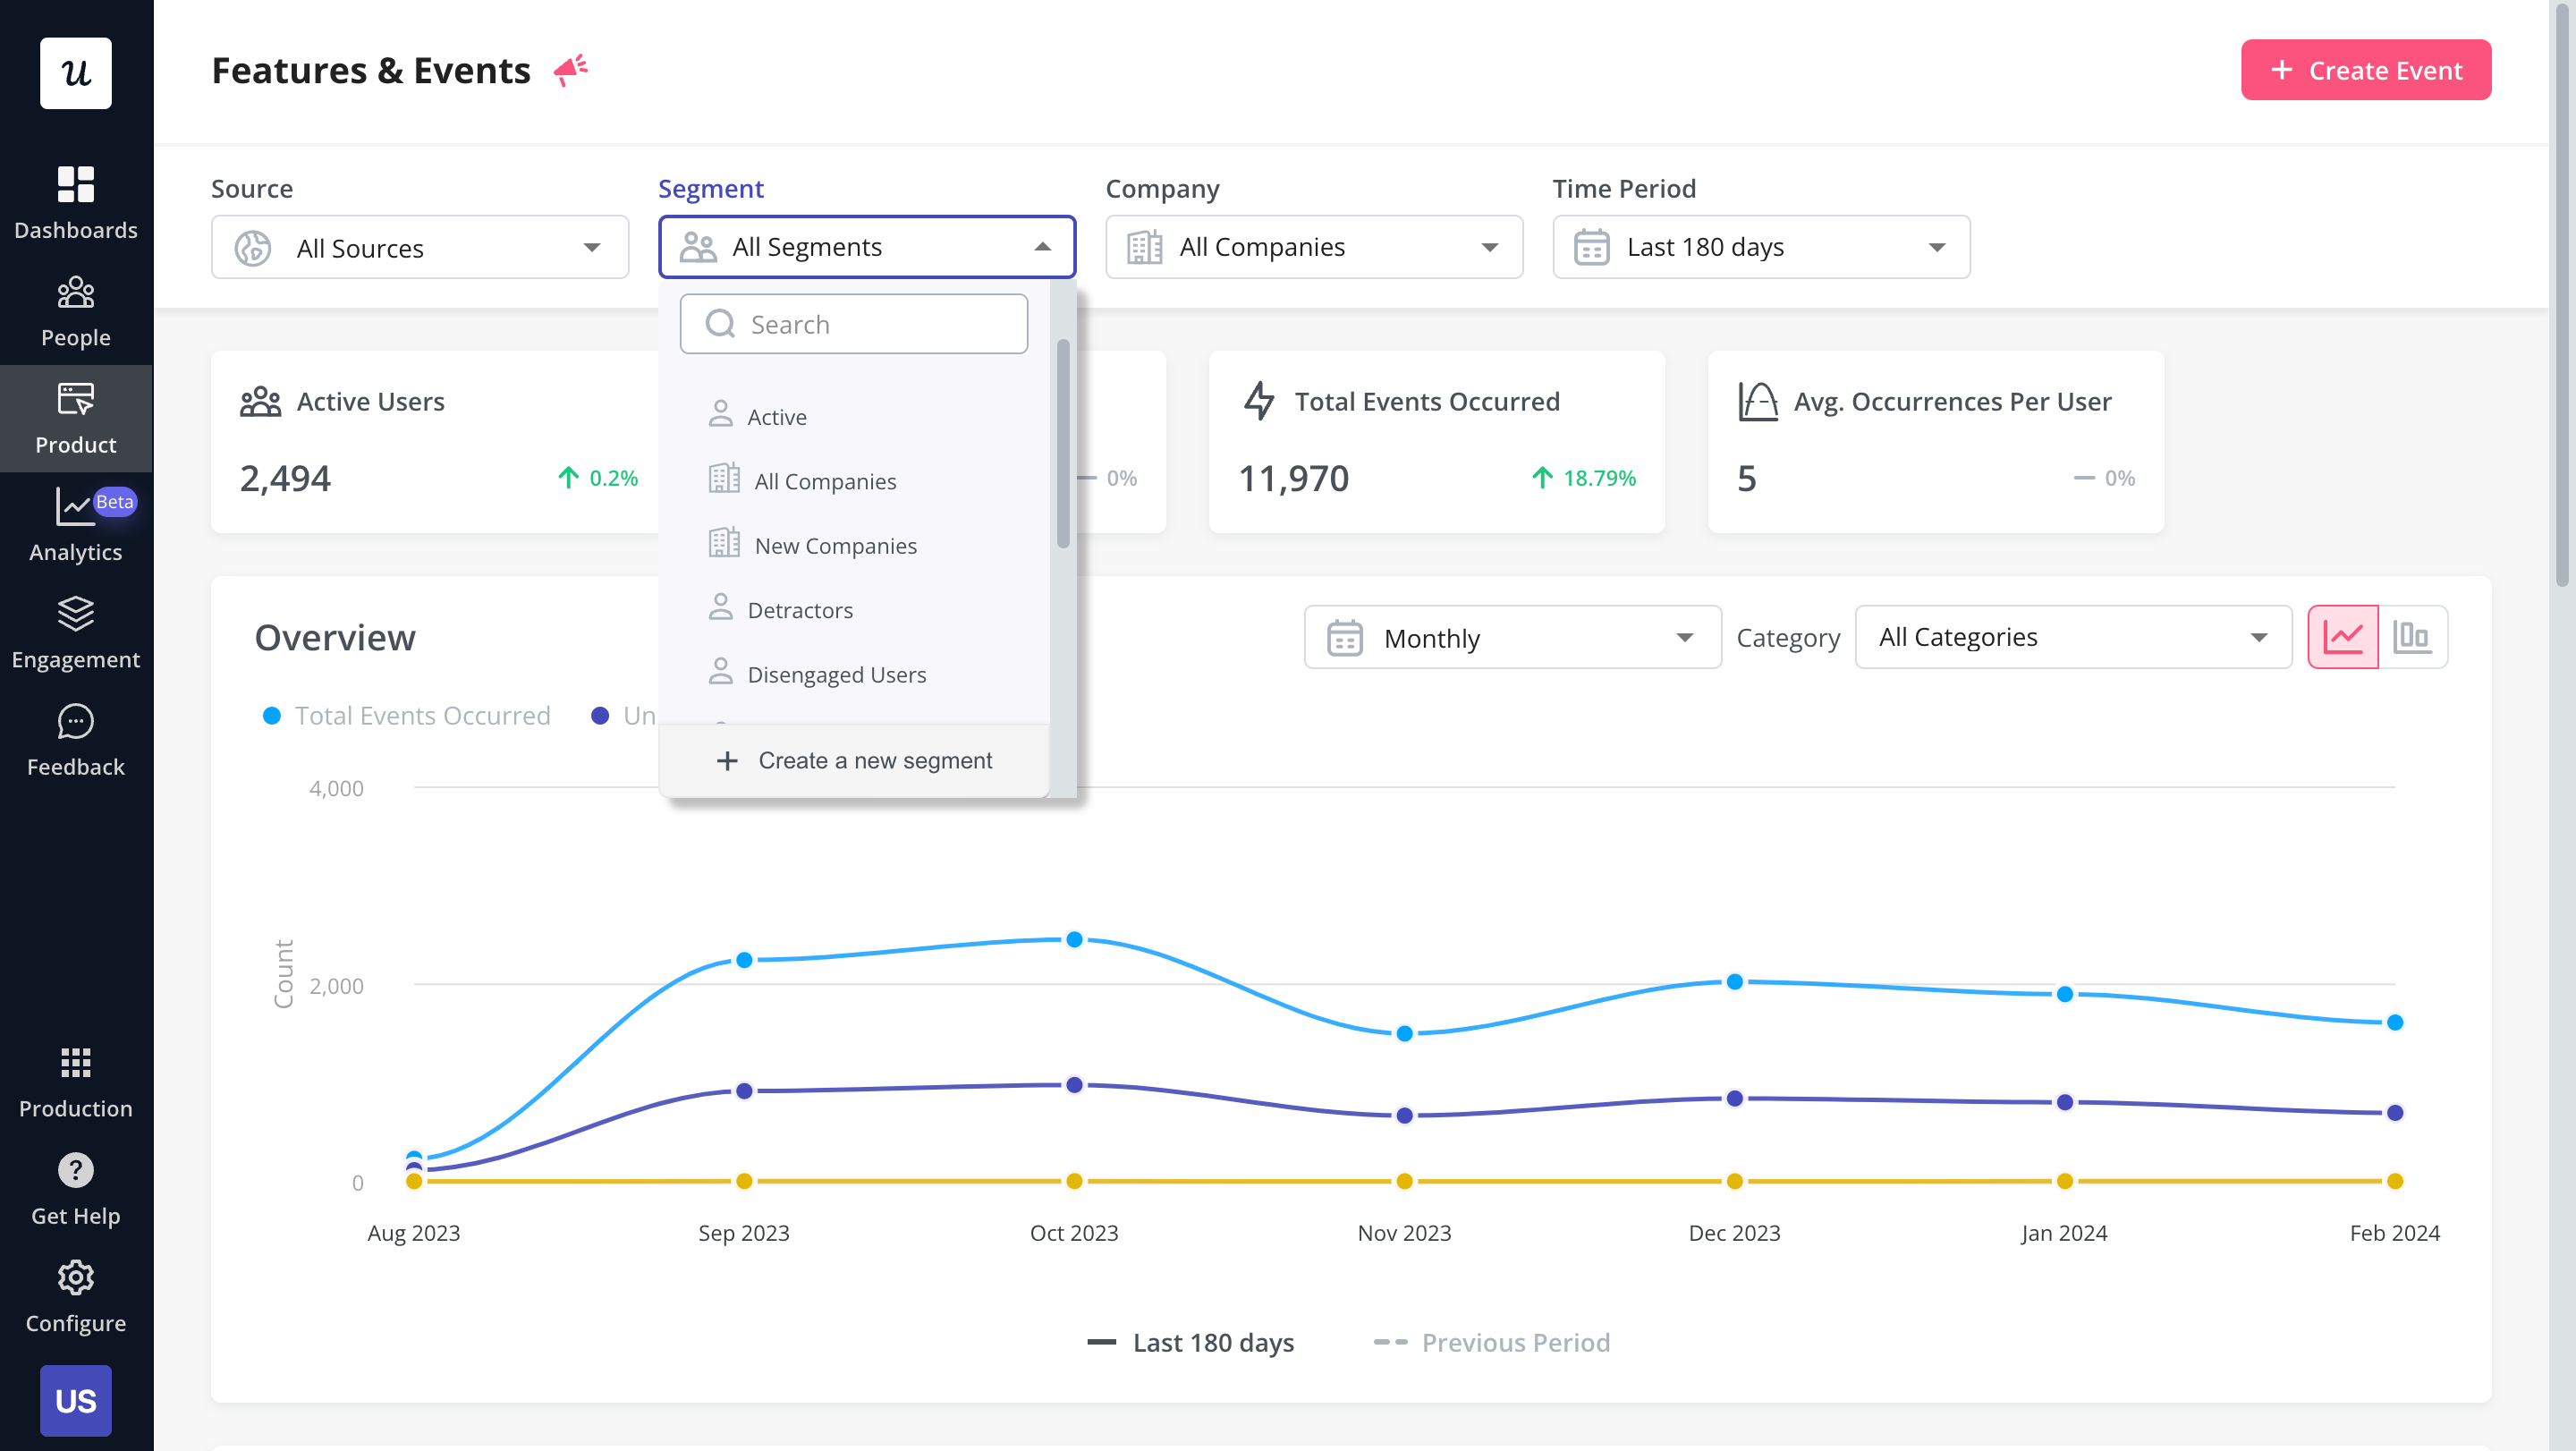
Feature and Events dashboard in Userpilot
Without coding, right from the Chrome extension, you can easily tag features that you want to track. The functionality is not limited to tracking clicks only. You can also track text inputs and hovers to get a bigger picture of how users engage with the UI.
Feature tagging in Userpilot
Usage tracking in Userpilot goes beyond individual actions. You can also combine them together into Custom Events and track them together from one dashboard.
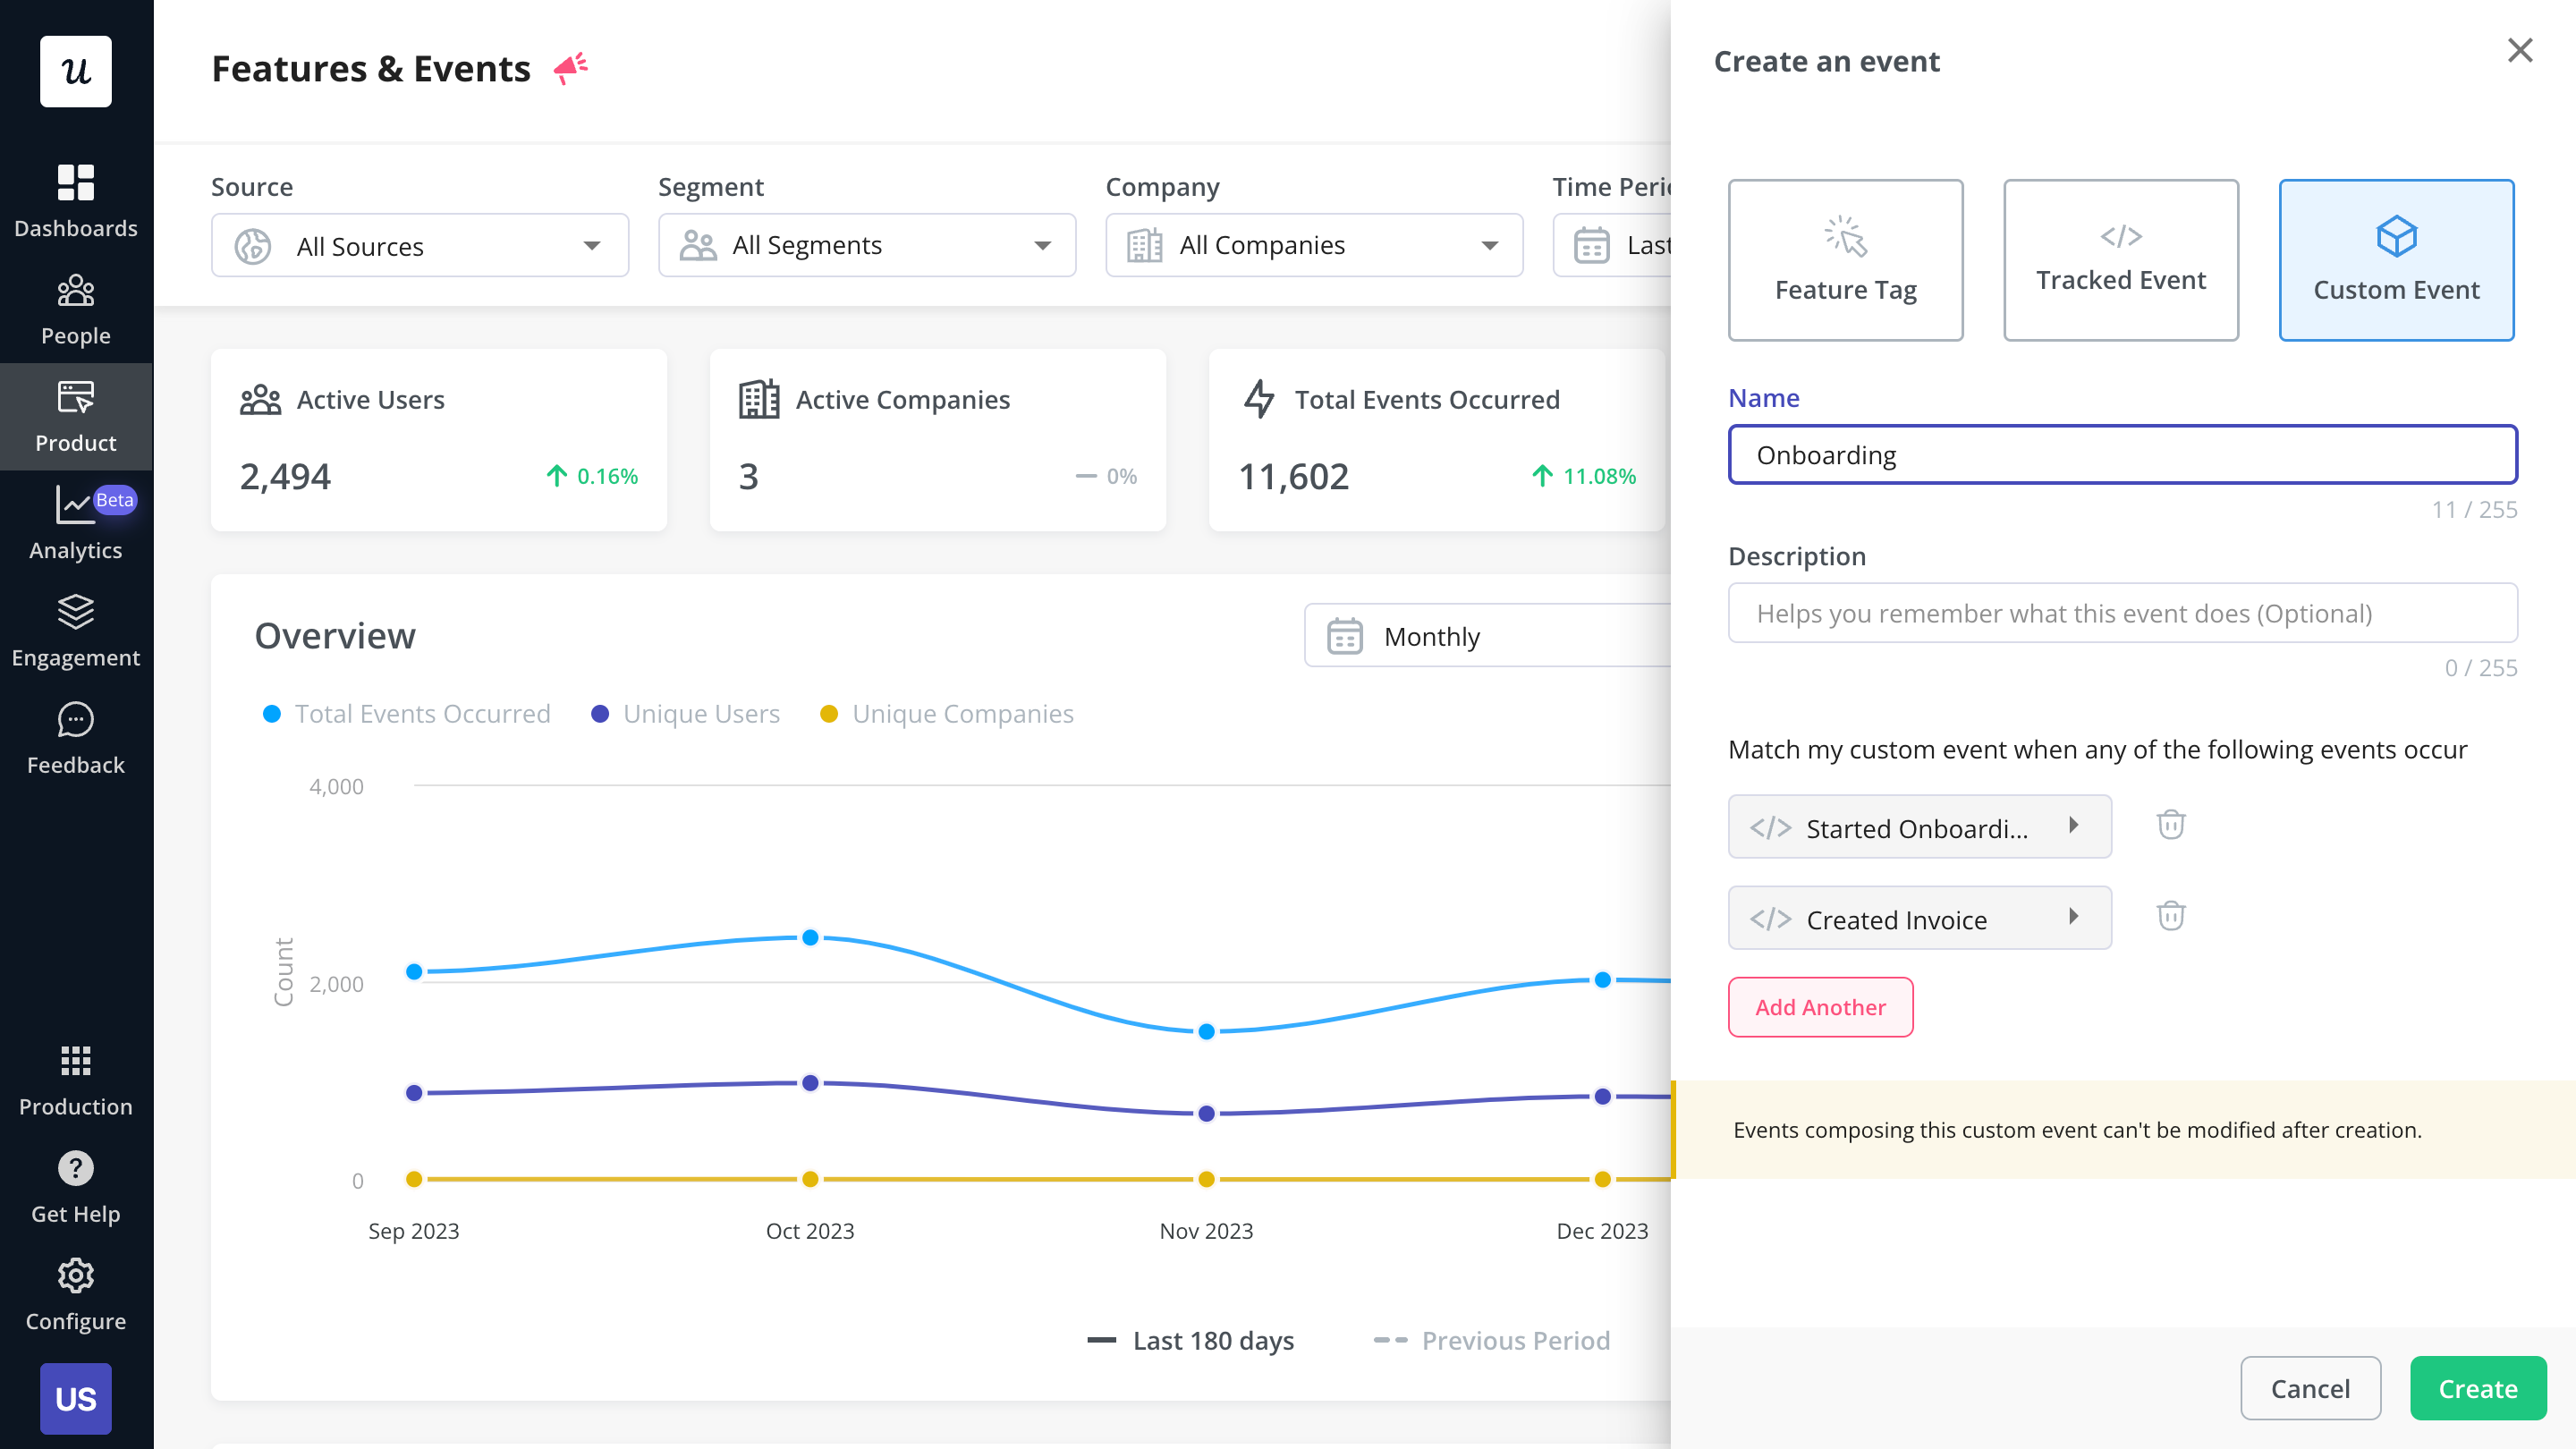
Custom events in Userpilot
Apart from a range of graphs and charts, you can also use heatmaps to visualize how different user segments engage with your features.

Feature usage heatmap in Userpilot
You can further conduct different kinds of analyses like funnel, retention, trend, and paths to understand user behavior in more detail.
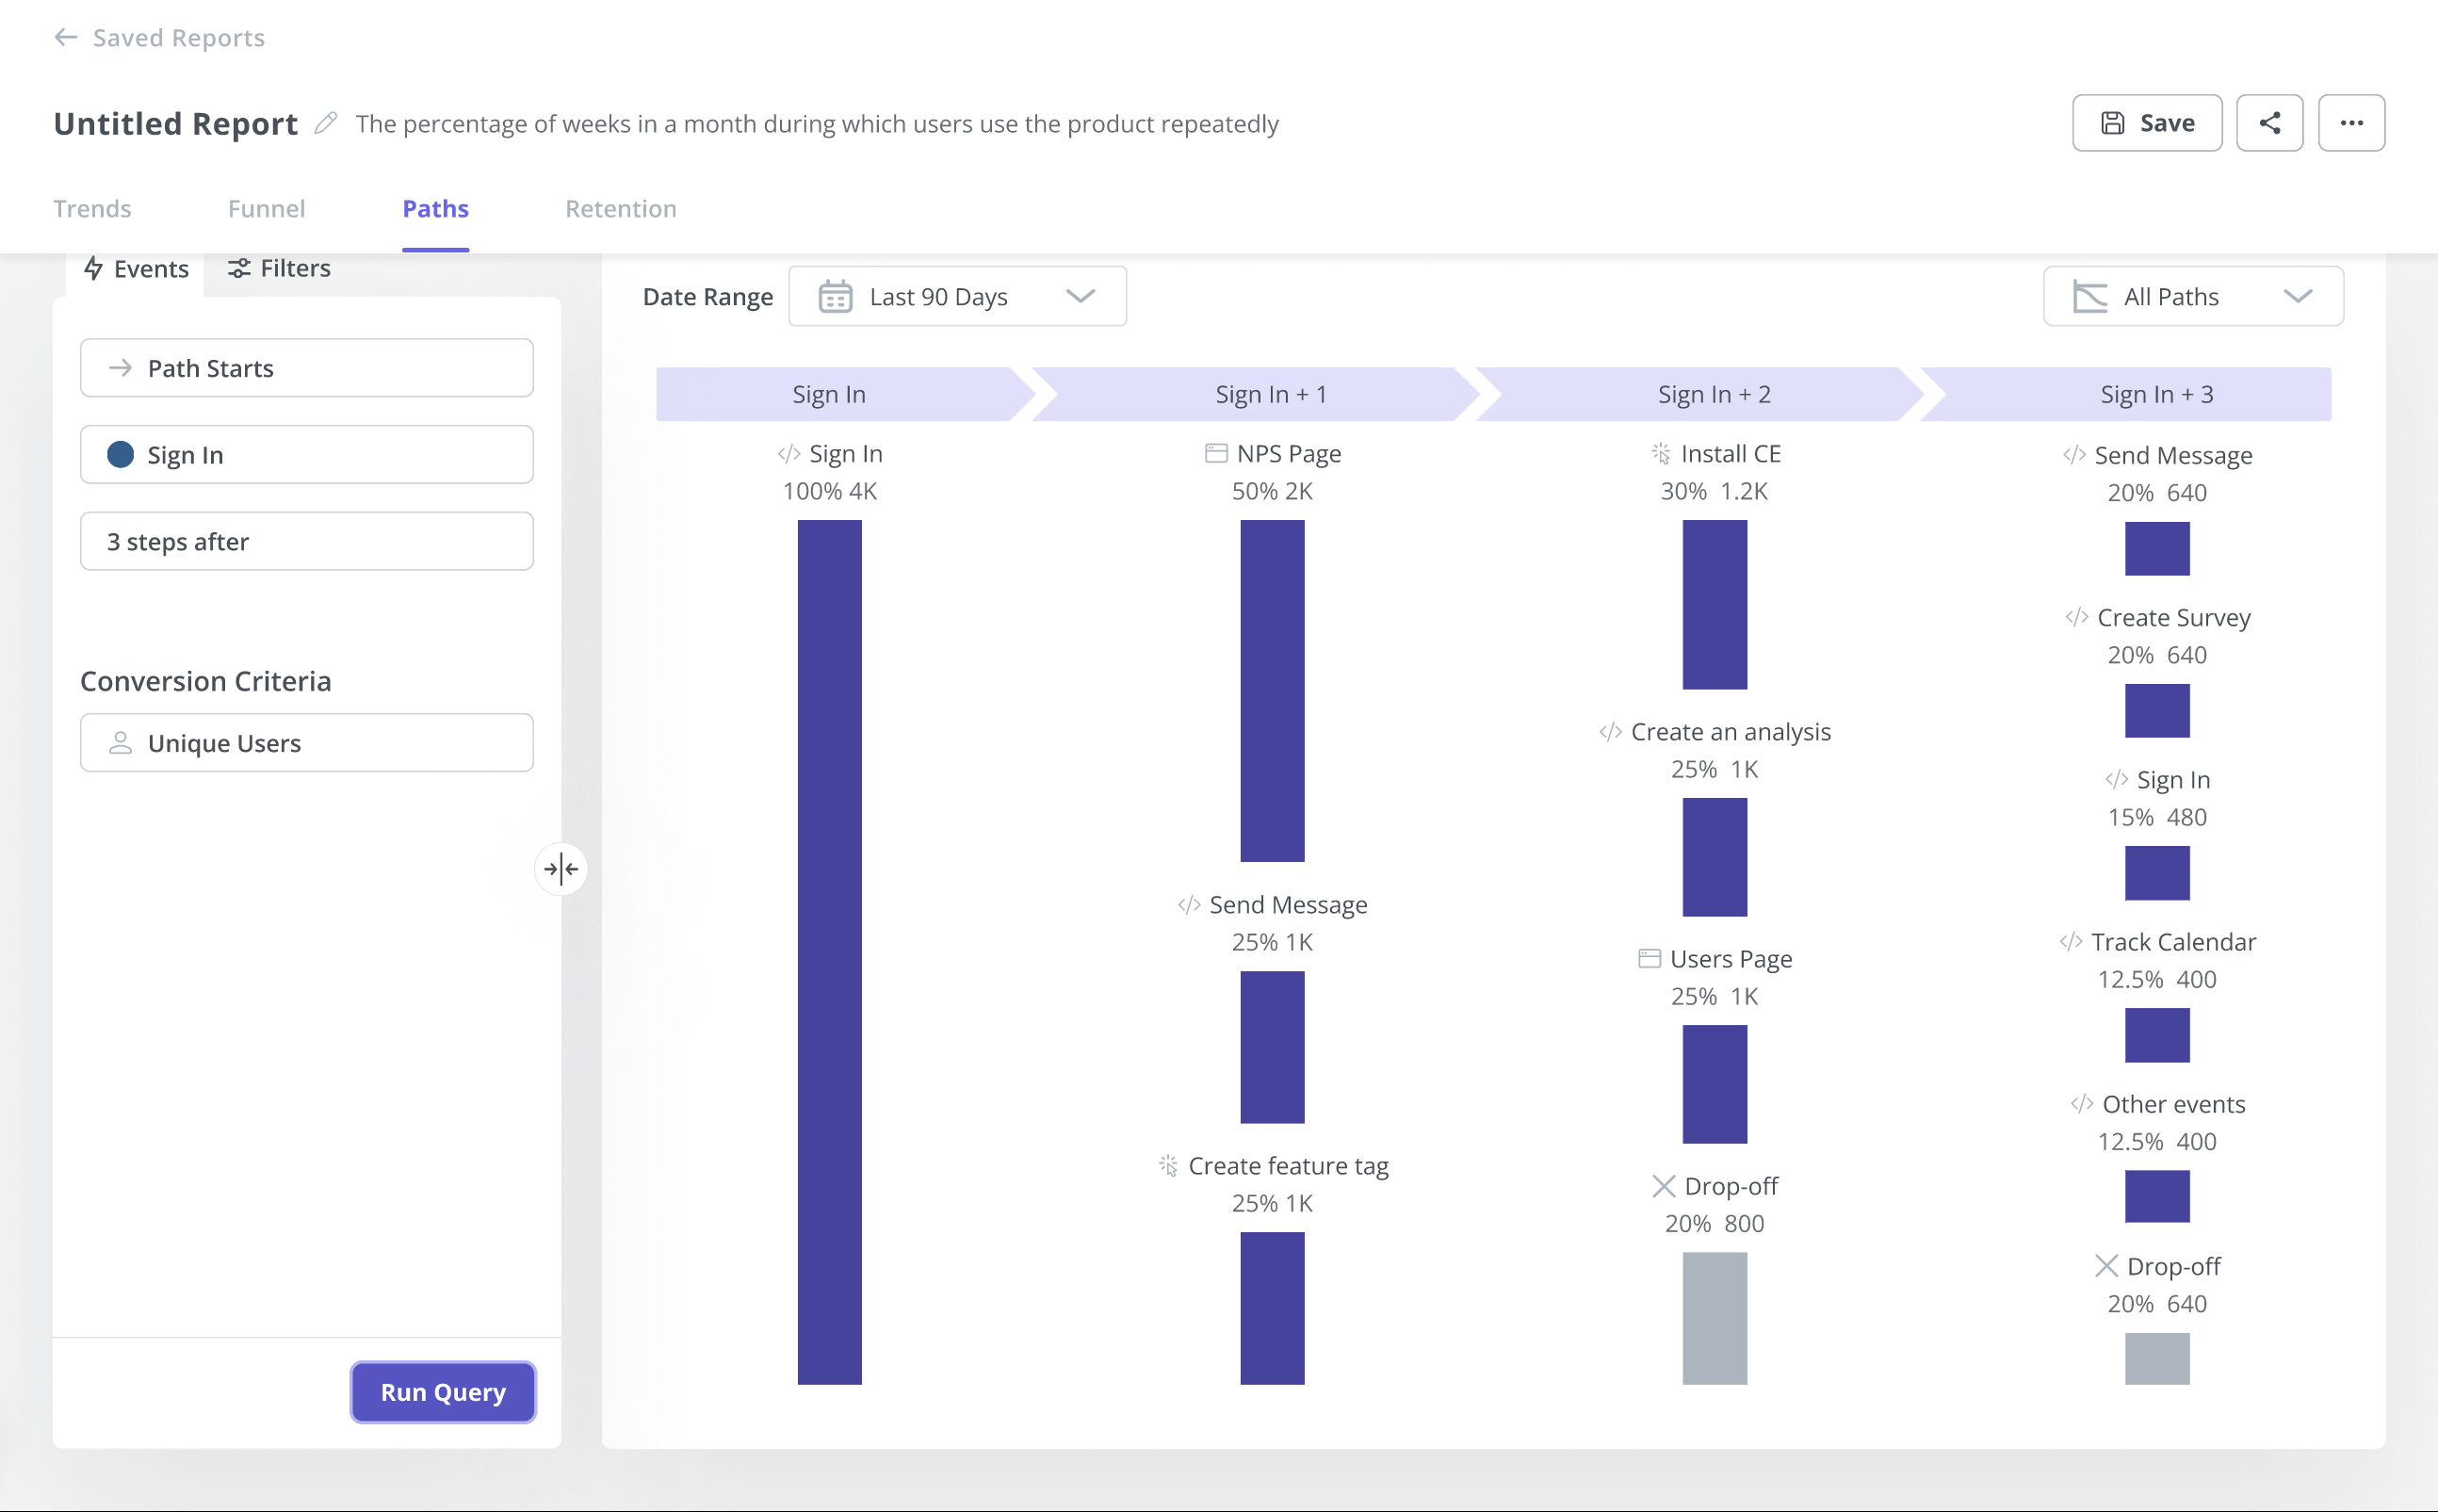
Path analysis in Userpilot
All the data that you collect about your users can be used to create very specific user segments. Next, you can target them with in-app UI guidance to improve engagement and adoption.
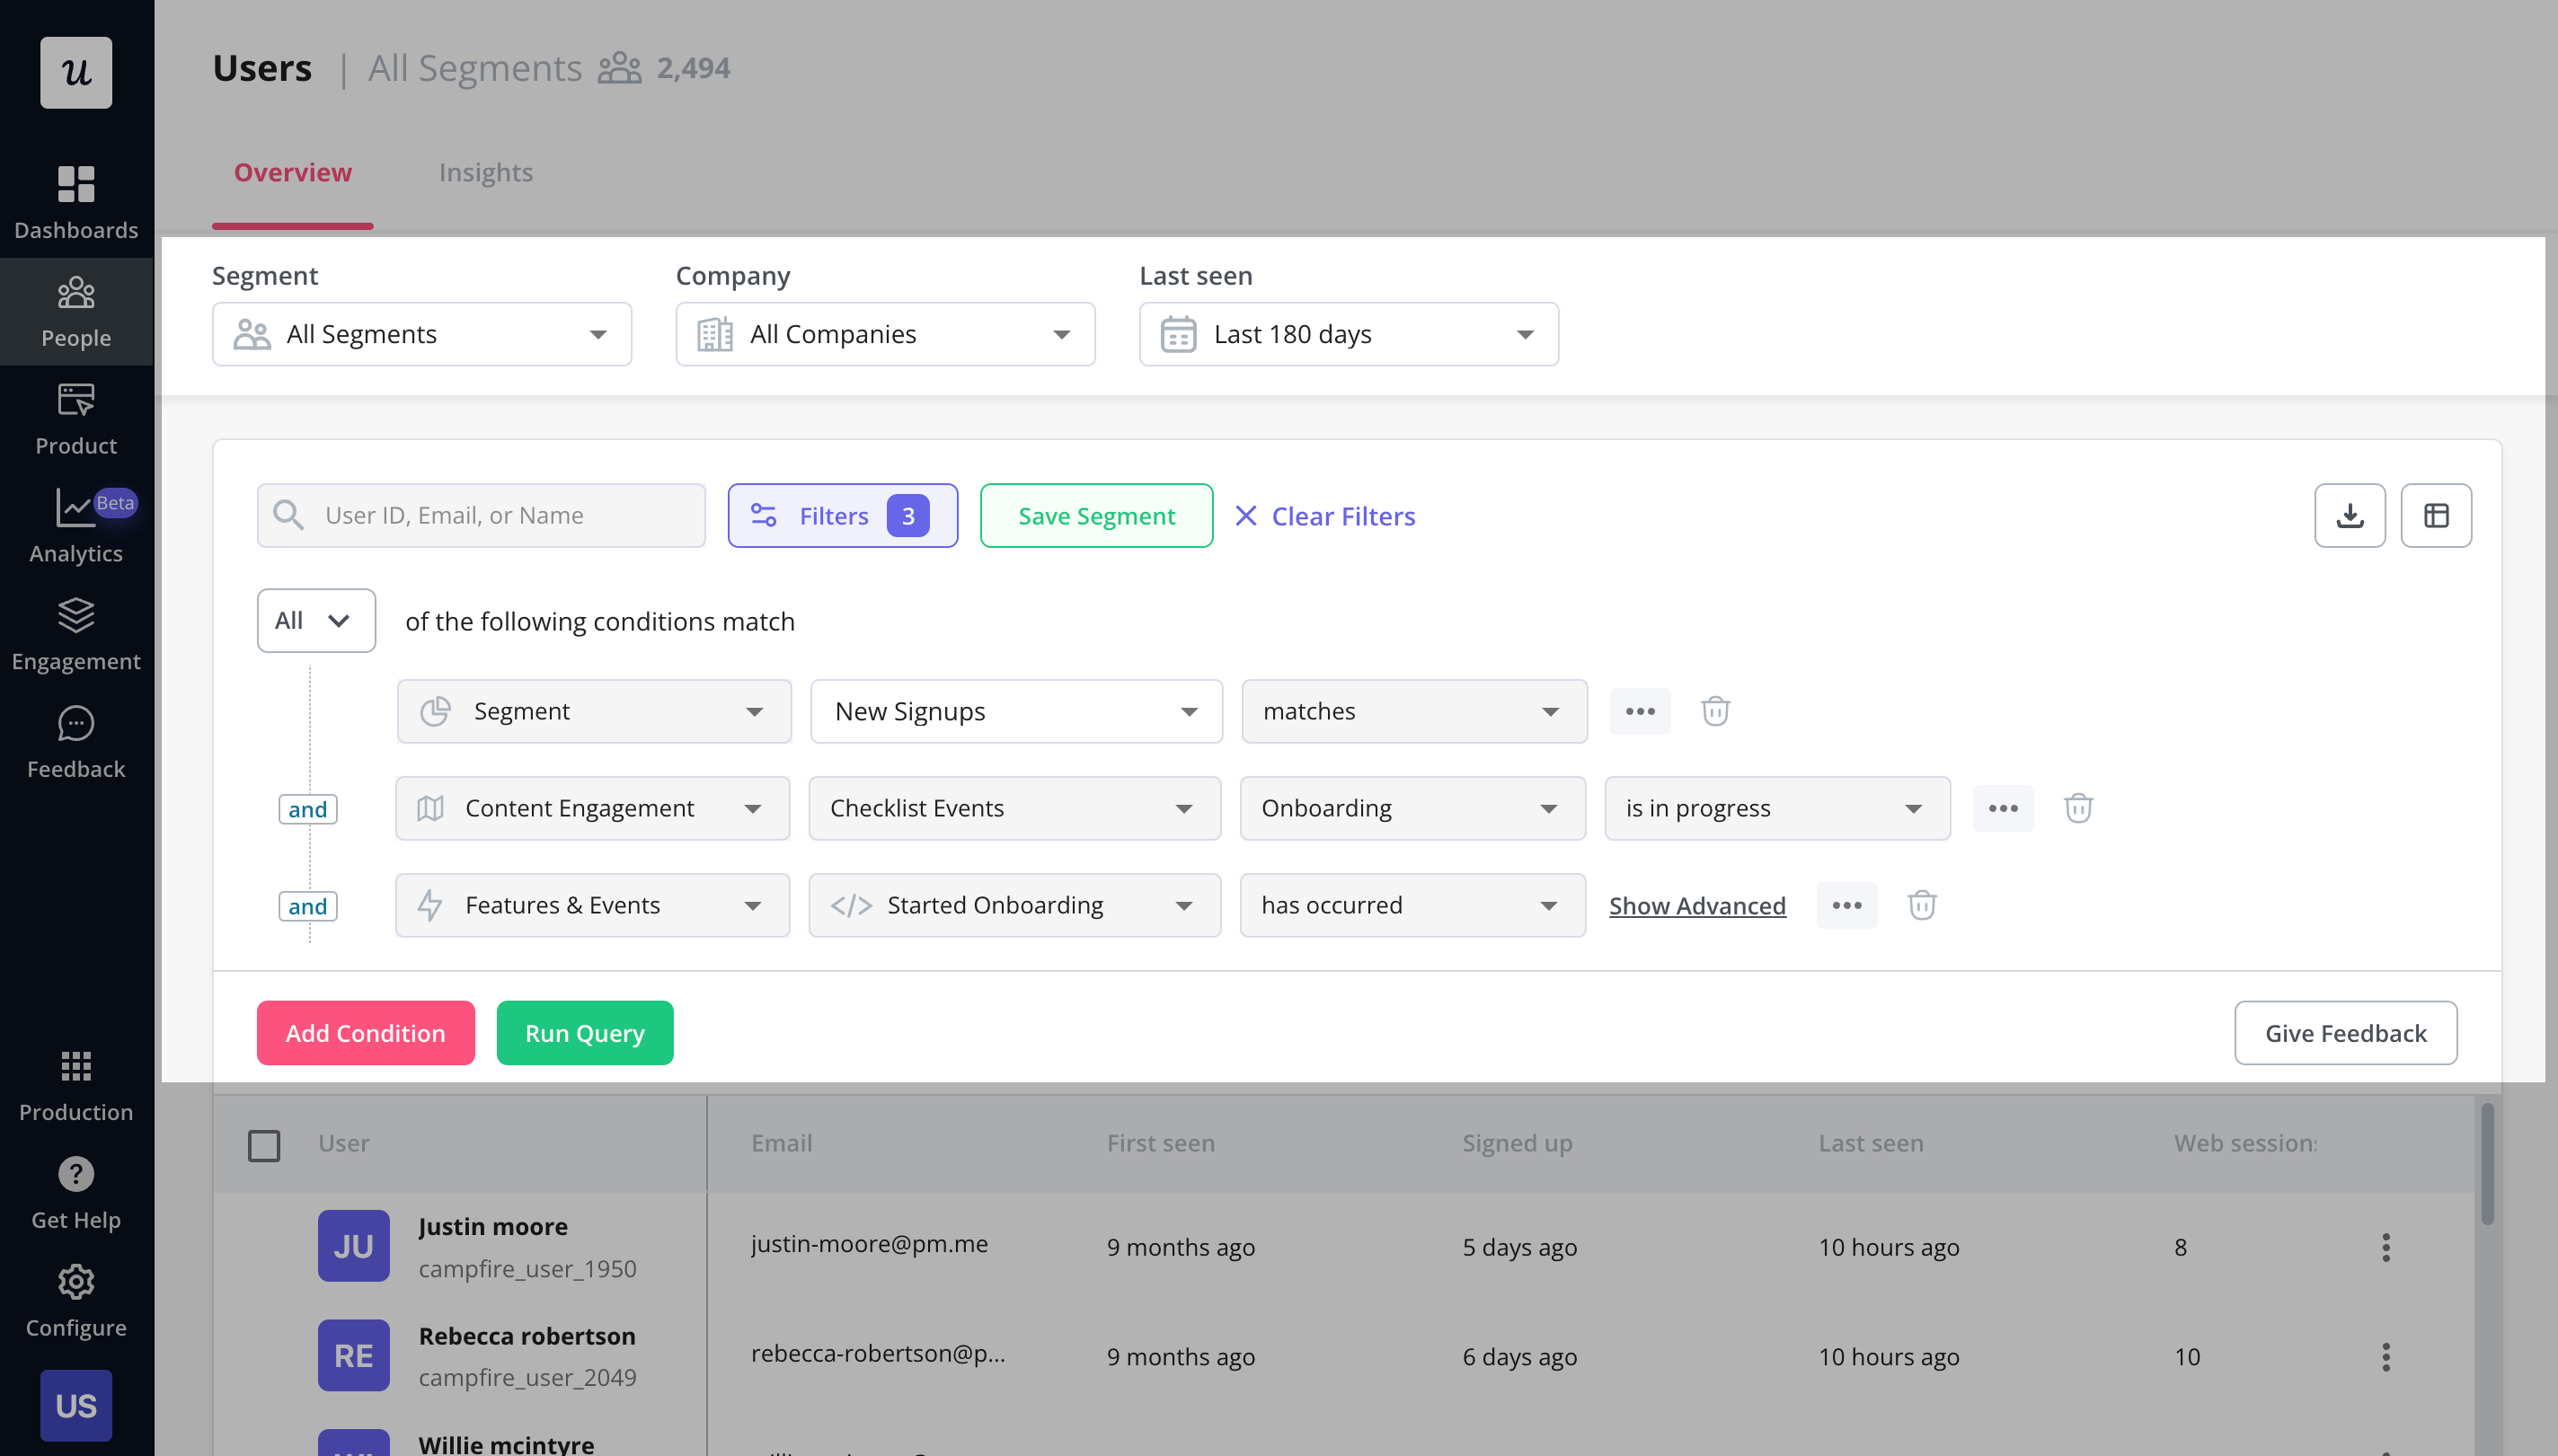
Segmentation in Userpilot
On top of usage tracking, you can also harness Userpilot in-app surveys to track user sentiment or satisfaction. This makes it more than a simple product dashboard tool as you can also act on the insights you collect.
Mixpanel: Product and lifecycle analytics product dashboard tool
Mixpanel is an analytics tool that allows you to track user engagement with your digital products.
Just like Userpilot, it offers advanced analytics and segmentation tools, so that you can target your users accurately with your experiments or messaging. However, it offers no tools to actually improve user engagement.
For that, you need to integrate it with other tools, which is very easy (Userpilot has a Mixpanel integration too).

Product dashboards tools: Mixpanel
Tableau: Growth and revenue product dashboard tool
Tableau is a visual analytics platform that helps organizations to promote data-driven product management by making data easier to view and interpret.
This is an example of a business intelligence (BI) tool and its initial setup may require some time. However, if you use it to track product growth, revenue, or other business metrics, it’s a one-off effort.

Product dashboards tools: Tableau
Conclusion
Product dashboards allow product managers to visualize the key data necessary to manage product development and growth.
To benefit from your dashboards, you need to make sure we choose only a small selection of the most important metrics to display. Otherwise, instead of fostering data-driven decision-making, such a cluttered product dashboard will hamper it.
If you would like to see how you can harness Userpilot analytics to track and visualize data, book the demo!
![]()
Try Userpilot and Take Your Product Growth to the Next Level

