4 ways Sprig and Mixpanel work together to give a full picture of your product users
Teams can quickly uncover the “why” behind how users behave in their product when they bring Sprig survey data into Mixpanel.

The best product and growth teams are always striving to understand the user more deeply. They conduct moderated research sessions, they look at heat maps and journey flows, and they keep a close eye on their conversion metrics. This takes time, and combining these disparate data sources makes it hard to get a full picture. Today that got a little bit easier!
Sprig, a qualitative user insights platform, recently launched a new integration with Mixpanel that empowers teams to combine user survey responses and analytics in a single platform to capture a comprehensive view of their product experience. The integration sends Sprig survey data into Mixpanel so that teams can uncover the “why” behind how users behave in their product. Plus, with Sprig’s new Replays product, teams can now actually see what their users see and watch the user navigate the product at specific milestones in their journey.
Let’s take a closer look at some of the specific use cases for how you can use Sprig and Mixpanel together:
Detect the cause of a drop off in your conversion or onboarding flow
This is one of the primary use cases we frequently see: PMs notice a drop-off in Mixpanel but don’t understand why users are failing to convert. Now you can launch a targeted Sprig Survey to collect feedback in the product to understand the root cause and take action to address it (prime real life example here).
For instance, we’ve seen a lot of product teams focused on optimizing their product-led growth funnel and tracking that “happy user path” in Mixpanel from signup to upgrade. When conversion in this key user journey drops, teams must dig in to understand what’s causing that friction so they can help users get back on the path to upgrading. Like any good team concerned with growth team, PMs should rely on their users to understand the barriers to upgrading and how they can optimize their product-led funnel.
How to get started:
- Use this Sprig “Optimize your Conversion Flow” template to understand what may be holding users back from upgrading (Event B).
- Create a Funnels report in Mixpanel to evaluate conversion Event A to Event B.
- View the users who dropped off before completing Event B and group them into a new cohort.
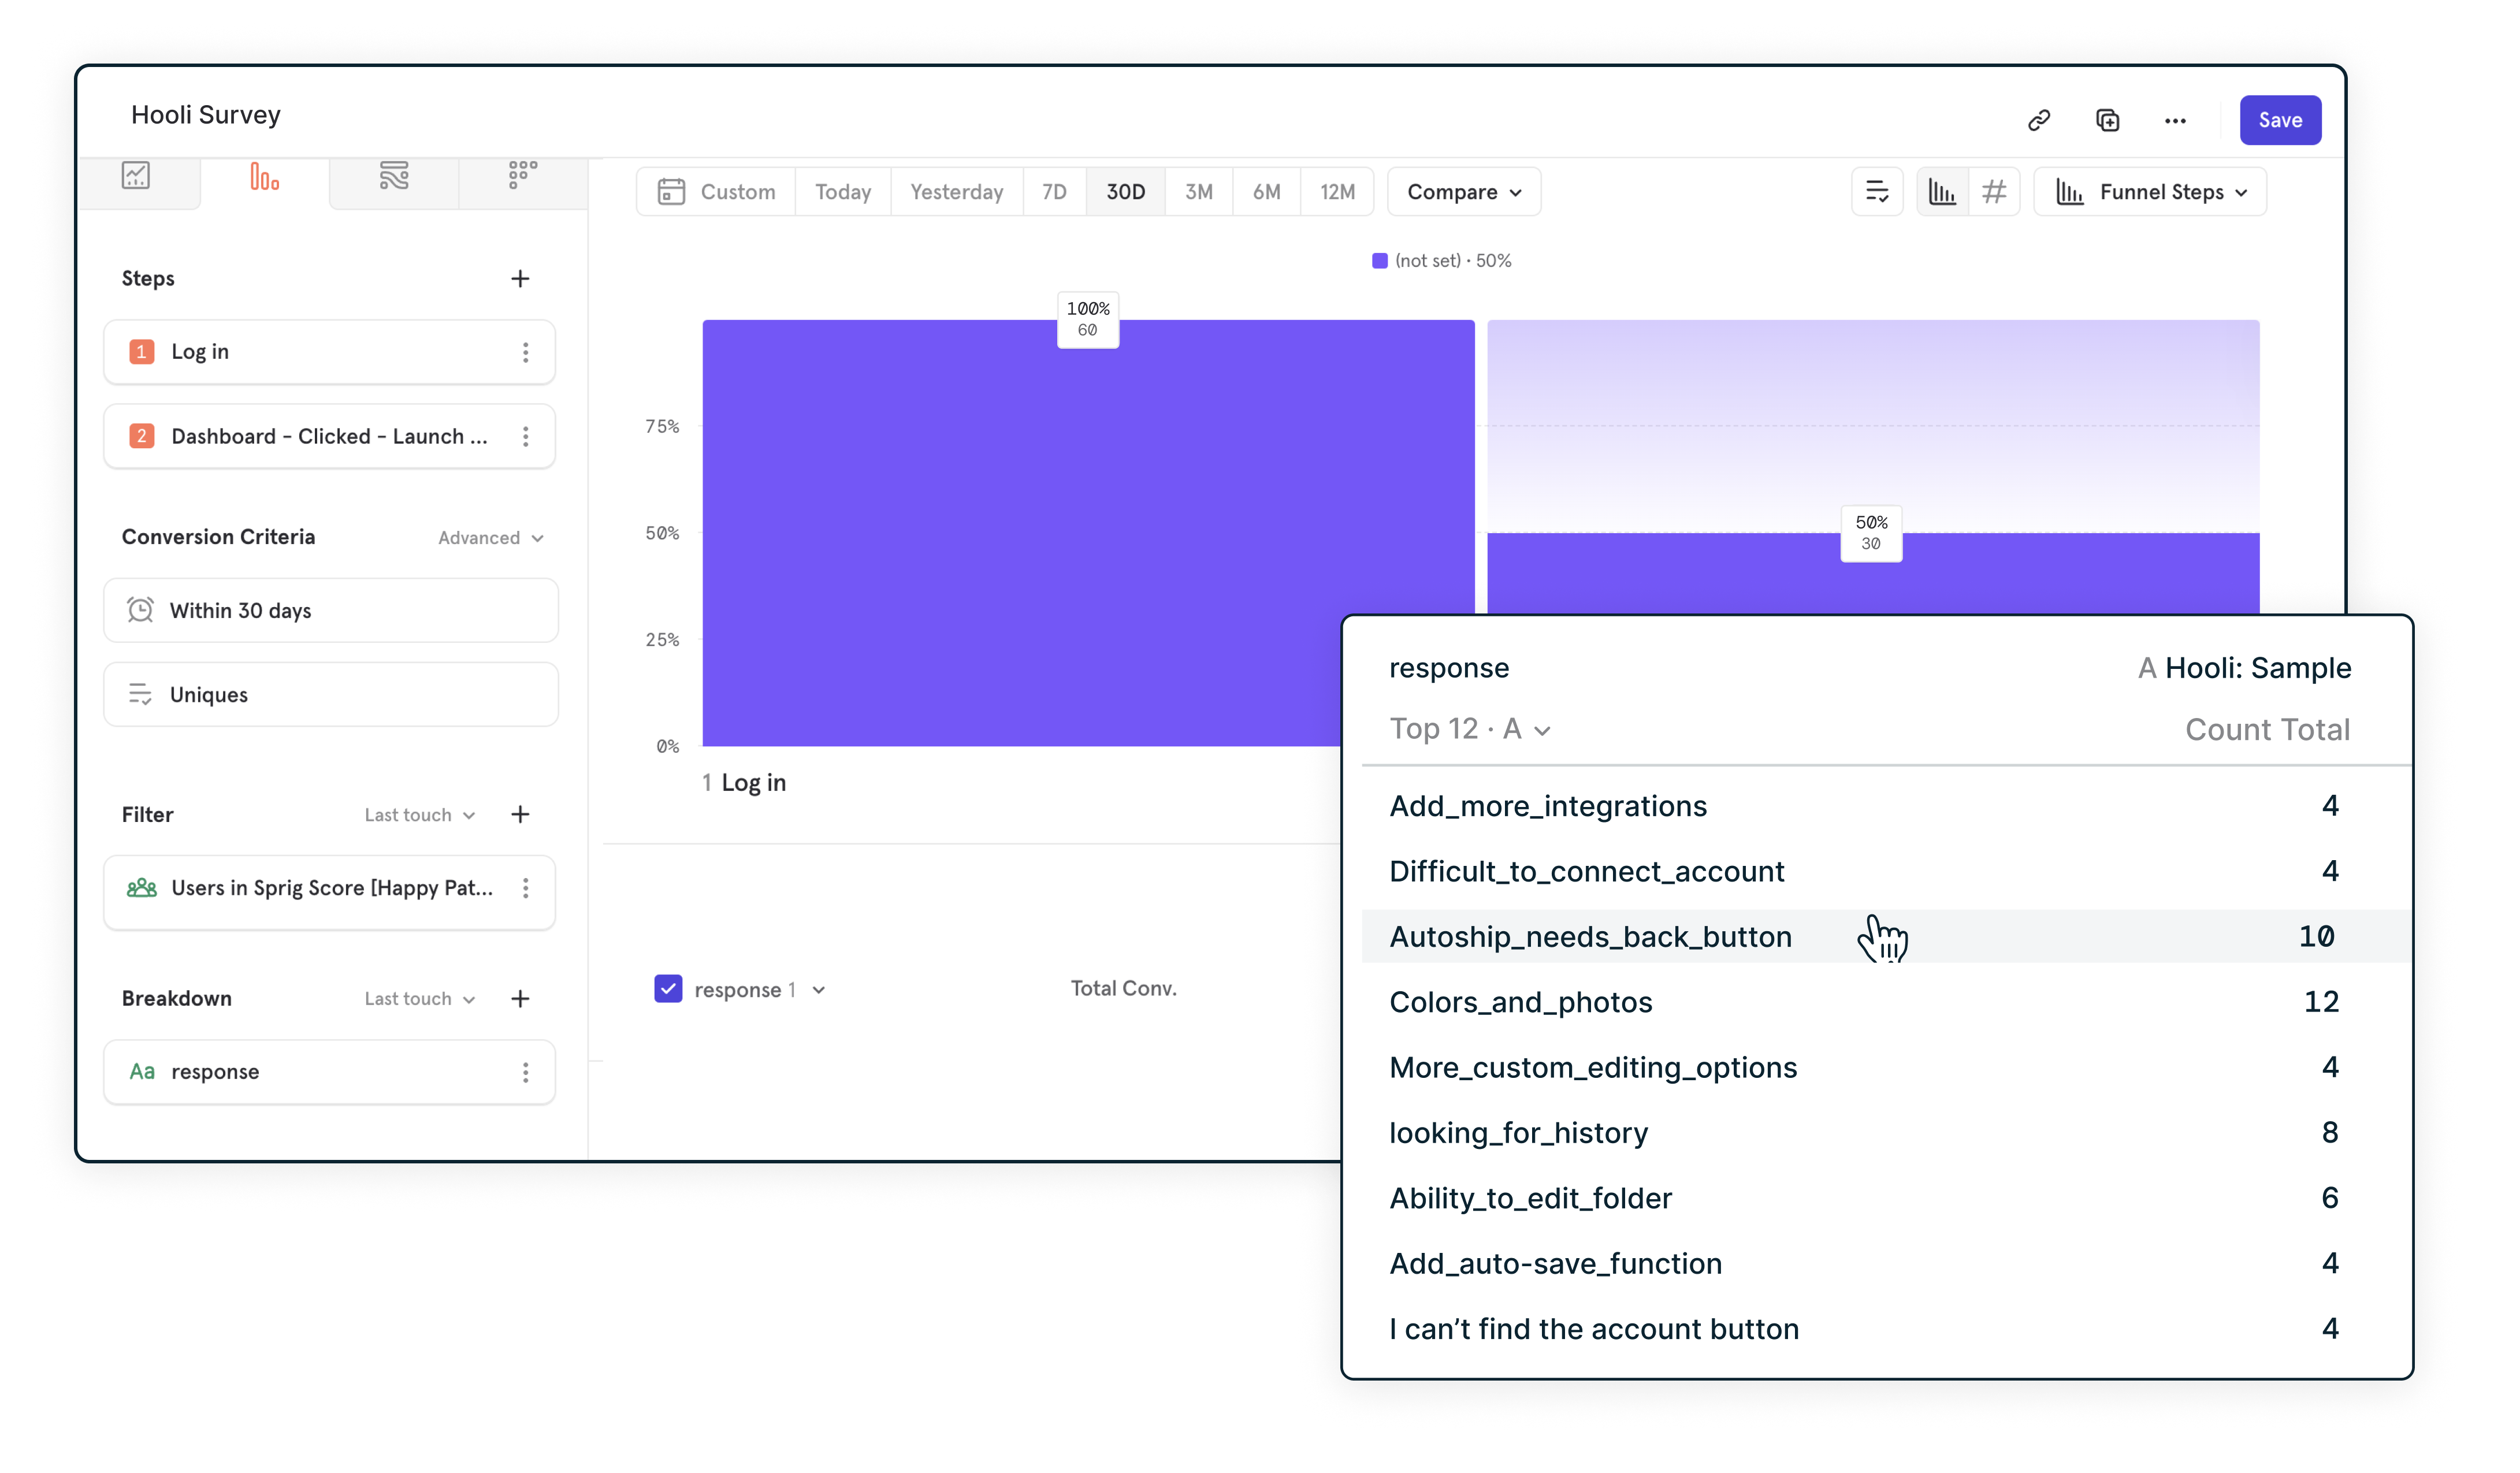
- Create an Insights report and select the specific Sprig survey event, filter by the cohort of users who dropped off, and break down by response to view the reasons why they dropped and how you can optimize your product to convert those users next time.
Learn what your power users want to see next in your product
This integration equips product teams with the critical data to drive the roadmapping process and get the necessary buy-in from executives and any other internal stakeholders. By uniting Sprig user insights and Mixpanel product analytics, you can determine what specific cohorts of users want to see in your product and make smarter roadmap decisions aligned with your overarching strategy and target ICP.
For example, to help Sprig determine which partner integrations to prioritize for the first half of the year, we triggered a Sprig Survey at users who engaged with our website and in-product Integrations Gallery. In this survey, we made sure to ask users which of our current integrations were most valuable to them and which ones they were interested in seeing next.
We viewed this survey response data in Mixpanel to better understand key questions:
- What integrations were power users requesting?
- Did those suggestions align with our strategy going forward?
We were able to view the response data, filtering for specific cohorts like “power users” (i.e., users who launched five studies per month) and “Enterprise Plan” users. Breaking down the data by these cohorts gave us conviction that we were building for the users that were most engaged and invested in our product.
The results showed that users were looking for new destinations for exporting and analyzing responses (i.e., Mixpanel). The survey also revealed demand for more innovative use cases, like survey targeting for A/B testing and experimentation groups. Capturing these insights from our most engaged users gave us the conviction we needed to build integrations with partners like Mixpanel and LaunchDarkly.
How to get started:
- Leverage this Sprig “Understand Feature Demand” template on your website or dashboard to start collecting insights around what your users want to see in your product.
- To prioritize features based on product usage, for instance, create a cohort identifying your power users who also responded to the in-product survey.
- Create an Insights report selecting the “Power Users” cohort created and break down by “response” to understand demand for new features and product improvements.
Understand how to retain cohorts that are likely to churn
Leverage the Sprig and Mixpanel integration to understand how you can retain cohorts that are likely to–deep breaths–churn. When we understand who might churn and their reasons for doing so, product teams can take a proactive approach to cultivate those customer relationships and address specific issues head-on. Product teams can also use this data to identify customers that aren’t a good fit and better inform their acquisition model.
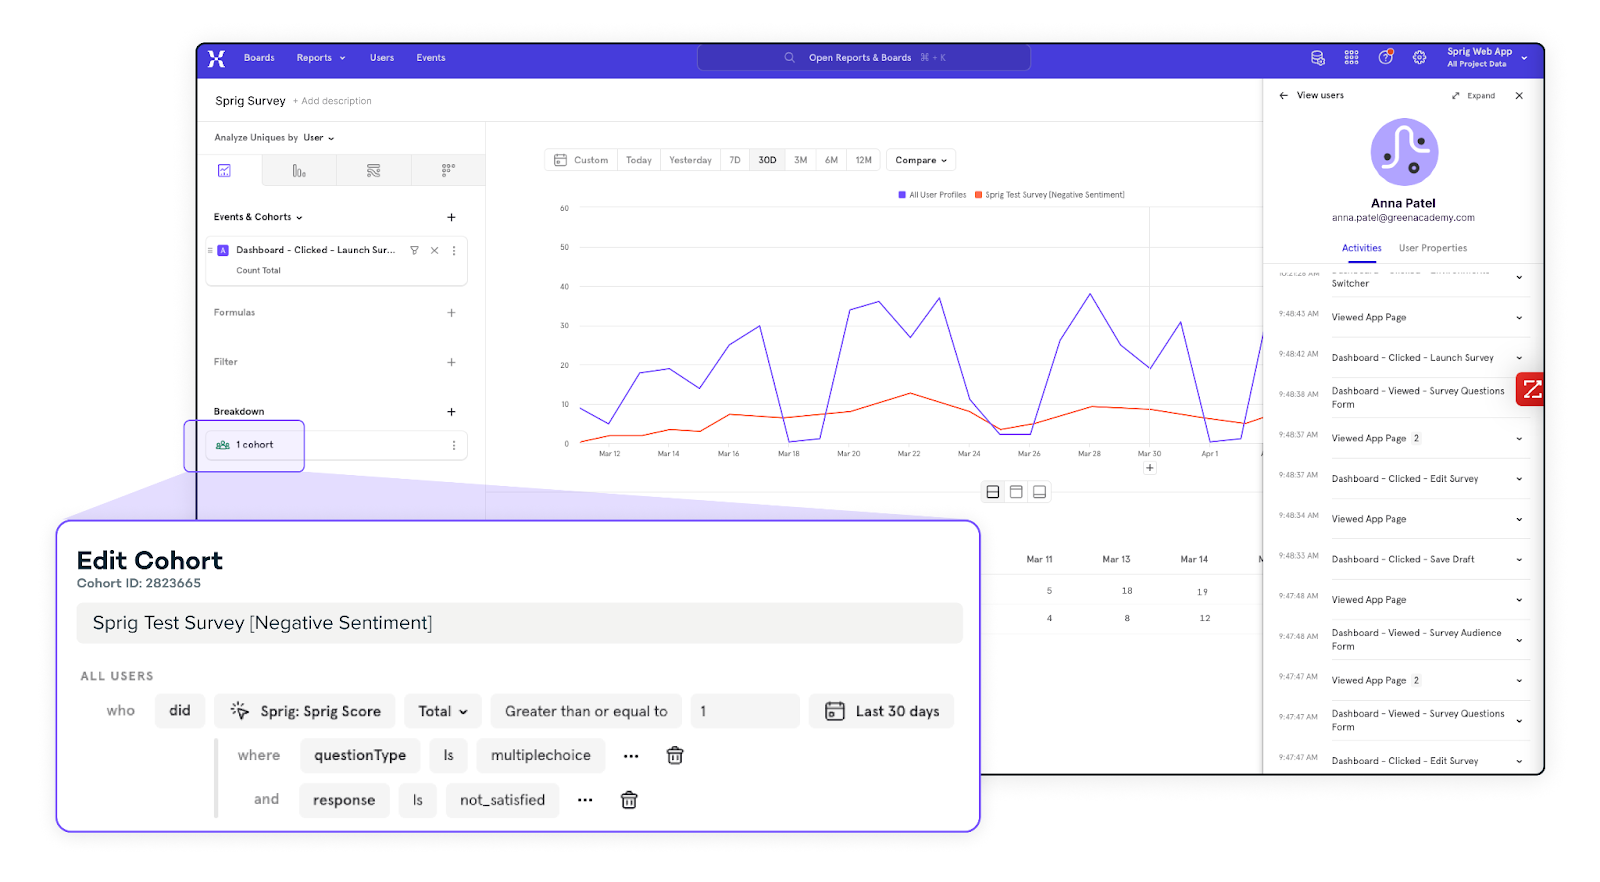
For example, low usage and negative sentiment typically signal unhappy customers. Build a cohort in Mixpanel defined by a metric representing low usage (i.e., logs in less than once every month) and a low Sprig NPS score. Then you can filter for paid subscribers to understand risk revenue. By analyzing their survey responses alongside Mixpanel data, you’ll have a clear picture of why those users are dissatisfied and how you can improve the product experience for them.
Another opportunity is exporting this new Mixpanel cohort, uploading the users into Sprig, and targeting this specific audience for additional feedback.
How to get started:
- Implement a “Measure Subscriber Satisfaction” survey to understand potential areas for improvement.
- Create a cohort identifying users that have signaled potential churn risk.
- Create an Insights report selecting the “At Risk” Cohort and break down by “response” to see open text feedback tied to those users.
Analyze how different user properties affect product sentiment
Finally, the Sprig and Mixpanel integration can be used to analyze how different user properties affect product sentiment. By analyzing Sprig survey response data alongside Mixpanel analytics data, you can identify the factors that are most likely to affect how users feel about your product.
For example, you can look at user sentiment alongside geographic locations, providing a lens into how cultural or linguistic differences contribute to high or lower satisfaction levels and product usage. Uniting product analytics and Sprig survey responses together, one Sprig customer was able to identify that after launching a new investing feature, adoption was especially low but sentiment was high in the country of Uganda. People were excited to use the product, and therefore, adoption should be high, so what was the problem?
When the customer dug into the open-text responses, they were able to identify the root cause, finding that respondents were not aware of how to use the new feature. With this data, they were able to proactively address the lack of knowledge around investing and develop a plan forward to build more user education into the feature.
How to get started:
- Create a cohort based on Sprig survey respondents that expressed positive sentiment.
- Create an Insights report and select the Sprig survey as the event.
- Filter by the cohort of happy respondents and break down by location or another user property to understand how various user properties affect product sentiment.
These are just four ways Sprig and Mixpanel can work together to supercharge your product and user insights. You can learn even more about the integration here.
Gain insights into how best to convert, engage, and retain your users with Mixpanel’s powerful event analytics. Try it for free.