
Contents
In part one of our series about surveys, we talked about the pitfalls and most frequent misuses of surveys in design research. However, it is also clear to us and hopefully to you too, that when surveys are applied well, they can bring wonderful insights and help product teams make better decisions. But with all the talk about best practices, we have not yet shown the practicalities of running a valid UX research study with surveys. Now, we want to pay our debt.
In this article, we will go through the steps of how to actually create surveys. We’ll focus on real life, applied surveys in a business or non-profit environment. By the end of this article, we hope that by following these steps you too will be able to create a valid survey that answers real questions.
So let’s dive in!
Step 1: Align on research objectives
A new research project has started. You got your research question. Or do you have something else? Often, stakeholders will come to you with fuzzy problem areas. Or maybe with ideas and some half-baked assumptions. In other cases, they simply tell you to run a survey to find out x, only because they have heard somebody else did it this way. Or they read an article on the benefits of using surveys. Whatever the case is, it can be tempting to start immediately to work on translating these ideas into survey questions.
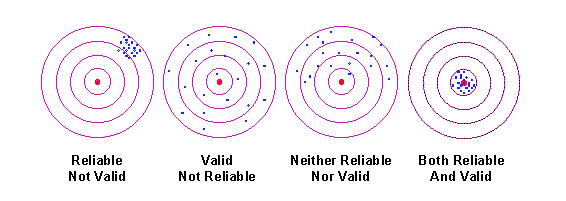
But hold your horses. Just as with any other research methods, we encourage you not to jump straight into execution, but to spend some time finding out what are the core questions. The ones that truly need to be answered. Why take this additional step? Often these starting discussions do not have enough depth to be the basis of true alignment on research objectives. Without that, you risk running technically good surveys that will reliably measure something that is not what your organisation really needs (see the first darts board below).
So do not be afraid to probe your stakeholders. Ask them what would success look like for them? What would they want to learn from this survey (or generally from this research)? When they tell you that, ask further. Why do they need to learn that? How will this knowledge help the team to make product decisions? As a rule of thumb, we suggest you keep on asking these questions until you can summarise your research objectives into 3-4 main questions. This will enhance the validity of your insights.
Do not be afraid to write down these questions and send them back to your stakeholders. Oftentimes, writing helps clarify undisclosed points while providing a common basis for objectives.
If you have enough time, it can also be a good idea to organise a workshop. “Assumptive persona/user journey” workshops can be a great way to see what knowledge we already have based on the data and what are our biggest assumptions. Alternatively, you can also simply ask your stakeholders to put their assumption and current knowledge on sticky notes – group them, discuss them, and vote on them. A workshop like this is a two way street: not only will you have a better foundation for your research, but your stakeholders will also have a better understanding of what you do and why you do it.
Step 2: Educate your stakeholders
After making sure that you understand the problem space, you may continue with an often neglected step. The education of stakeholders.
Just because stakeholders are aware of some research methods, we should not assume that they know the exact benefits and downfalls. Frankly, that is not their job. It is us, researchers, who have to be the experts on these topics. We have to consult our teams about what we do, how we do it and why we do it. Even if you have seen it a million times yourself, it can be beneficial to bring the research methods matrix to meetings from time to time. Ask your stakeholders to place their research questions into the presented categories. After arranging the problems you all can see if a survey is indeed the best method to answer them. This way you can ensure common agreement on not just the research question, but the research methodology too.
One more thing at this step. When you decide to use a certain research method, it is very important to manage stakeholder expectations from the get go. Be transparent about what you can deliver after running your research. It is much better to say in advance that you will not be able to give in-depth contextual information at the beginning of a research project rather than meet with disappointed faces a couple of months later at the insights share-out session.
Step 3: Connect your research questions to your objectives
After you make sure that surveys are indeed the best way to answer your research questions, you can finally start working on the content of the survey. As a first step, we suggest centering your survey questions around your goals. As a starting point, it is best to divide your survey into sections based on research goals. Maybe even paste the original questions as headers. This can act as a north star for your research.
After that, you can move to unpack your research questions, and form your survey questions. We also call them survey or questionnaire items. When forming them, aim for transparency. It is not good enough if you know the reason for including certain items. All your stakeholders should understand why these items are needed.
To make it easier for outsiders to understand the logic behind you choices, you might use a matrix like this:
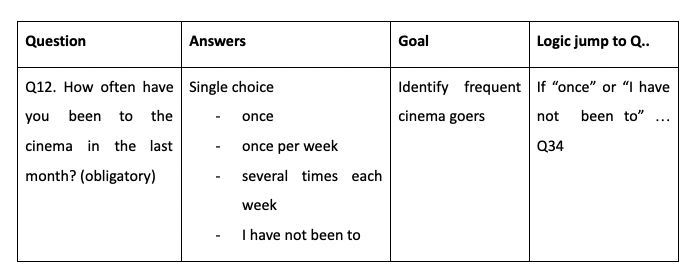
- The ‘Question’ column features the question itself and if participants can skip it or they can not move forward without answering it
- The ‘Answers’ column lists the answer type (single choice, multiple choice, ranking, Likert scale, etc) and the options to choose from
- The ‘Goal’ column shows how this question connects to the research objective
- The ‘Logic jump’ column: you need this column in cases, when depending on their answers participants will get different follow up questions. Applying these jumps help you to only collect data from those participants, who are really interesting for you in this topic area. On the other hand, you save time for others.
Connecting research items to research goals has a second benefit. It provides a helping hand when stakeholders get excited and ask you to include a lot of extra questions. With a clear visible structure at hand, you can just ask them what’s the goal of their new questions. When it is not strictly connected to the already agreed upon research goals, you might kindly suggest adding these questions to the research backlog.
Step 4: Check for biases
Now you are finished with collecting your survey items. Good job, but you are not ready yet. As a next step, you should make sure that the questions you have decided to include do not contain biases. This step should never be skipped, however close your deadline is, unless you want to end up with skewed data aka false insights aka false assumptions about user behaviour. If you are only getting familiar with surveys, we recommend opening a source listing the most common biases and check if your survey questions contain them.
With practice, this step will become easier. You will get a feel to avoid the biggest biases, but still, it is best to ask for a second look from a fellow user researcher. For example, at UX Studio we often pull together quick feedback sessions where we can discuss in person how to improve our items. Believe me, geeking out with other research nerds about question biases is way more fun than it sounds.
Step 5: Run a test round
So, you are now done with your questions. You have selected your preferred survey platform. You have resolved all the comments from your team. So you can move on to uploading the questions to the platform. But, before you actually send it out, we suggest you stop for a minute.

And test it. Why? It is simple. There is nothing worse than sending out a survey only to realise after receiving a hundred responses that a skip logic was not calibrated properly and survey participants have not answered a crucial question. Or that picture that you uploaded to one question is so pixelated that it is not clear what is there anymore. These mistakes are all easily avoidable if you and some trusted colleagues go through the survey a couple of times.
Additionally, it helps you to get a feeling of how it is for the survey participants to fill out your questionnaire. If you are bored, and can not wait to finish, they will be too.
Step 6: Plan your sample
As a next step, make sure to distribute your survey to your target audience. If you ask people who prefer high gastronomy how many times they go out to fast food chains and how they find the experience there, you would probably get the insight that McDonalds should stop making cheeseburgers. Your research question should already define your target audience. In case it hasn’t yet, think about the personas and the target audience of your product. Then make sure you distribute your surveys in places where you can reach them. It is also best to put a couple of screener questions at the beginning of your survey to make sure that they match the desired demographics and behaviours.
To motivate participants to fill in your survey, it is best to offer reasonable incentives for their time. You might define a certain amount per minute or you might make a prize draw. To avoid people filling in the survey quickly just for the money, emphasise at the beginning of the survey the goal of the research (without mentioning your product of course), and place motivating messages throughout the survey. Secret tip: you can use visual elements (emojis, pictures, gifs) to help keep up attention and the good mood of your participants.
Step 7: Consider data analysis
So you managed to collect your data. So far so good. But what is next?
We do not want to tell you how exactly you should analyse your data. That content, in itself, fills many books (here you find a recommended one).
But we can give you general advice that should make your life easier.
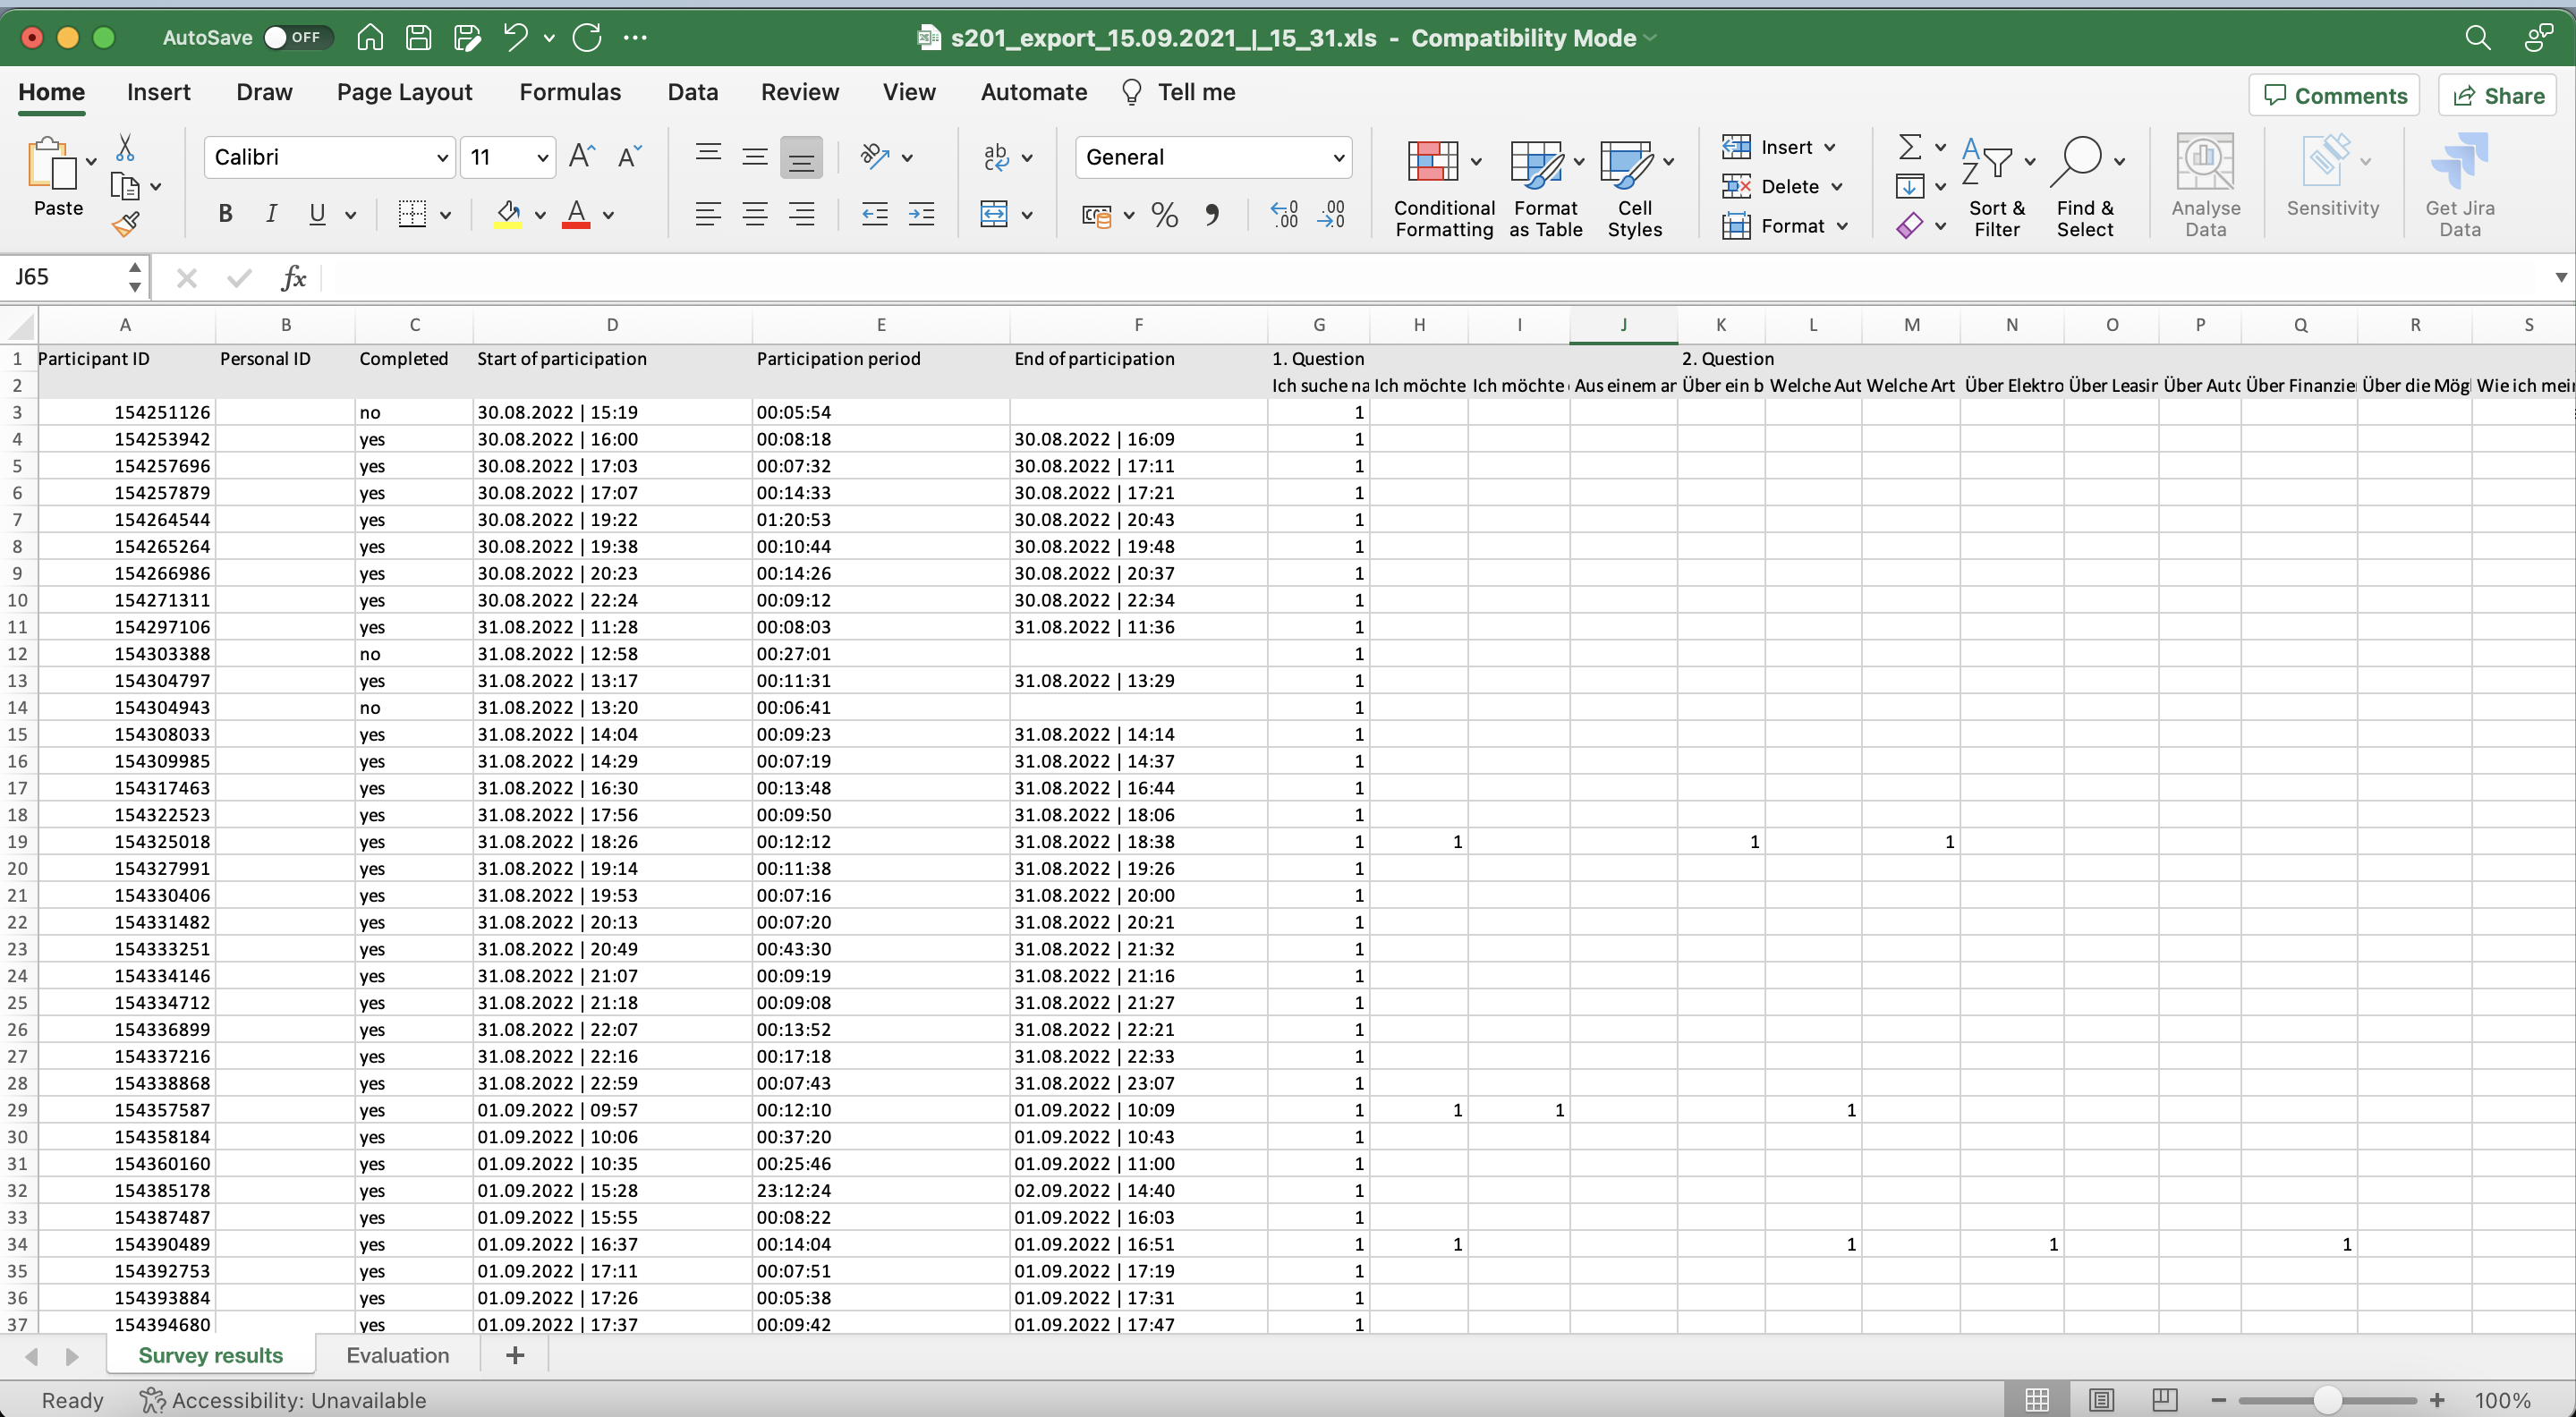
Generally, with surveys you either get a raw dataset or – if you use specialised survey tools- , some preliminary descriptive analysis. As looking at the raw data files can be a bit intimidating, some practitioners proceed to simply presenting these pre-made descriptive slides. However, this can result in false results and/or missing important findings.
To avoid getting false positive (or negative) results, do not forget to plan with data cleaning. Without this step you can not make sure that you are getting answers from the right people. Think back on your target audience. Even if you sampled them, filter for the targeted behaviours once more and exclude the answers that do not fit those. Also, make sure that respondents were committed when filling out your survey. It is important to exclude respondents who maybe got bored or wanted to get their incentive quickly and just clicked through the answers. Here is a straightforward summary of what steps you should follow to achieve clean data.
After data cleaning, it’s time to do the descriptive and comparative statistics.
As a rule of thumb, do not get lost in numbers. Focus on the questions which you have to answer. It is best to go back to your original research questions and focus on running the statistics, and preparing charts and data visualisations which answer those questions.
Do not forget to make your findings actionable. Some findings are easy to understand: if design “A” leads to significantly higher conversion rates than design “B”, all people in the room will understand that based on data we should choose design “A”. But what do we do if, for example, you present that customer effort score is 2.9 in your sample. Is that good? Is that bad? Always summarise your findings and insights in a way that shows why the findings are important. Emphasise how they drive your project and what decisions could be made based on them.
Summary
And we are ready. This is how you will have a valid survey. Although it is a lot of steps, do not be intimidated. As we already said in part one of this article, nobody is born an expert survey maker.
What is important that you follow the core concepts and be honest when something does not work out. Both with yourself and with your stakeholders.
And the having fun part is still true. If you have the chance, discuss your work with other researchers, and feel free to present your findings in a way that is true to you. May that is breathtaking charts or it can be a workshop format. So go ahead, read this article and add surveys to your researcher toolbox. Feel free to bookmark this article!

