
Today, finding a way to reduce churn and grow customer retention is absolutely critical—particularly for SaaS and other subscription-based businesses.
Simply put:
- Churn = lost revenue and wasted CAC
- Retention = sustainable growth and revenue protection
Below, we dig into customer retention analysis and how you can use it to reduce churn and protect your bottom line.
What is Customer Retention?
Customer retention is a measure of how well your company and product encourage customers to stick around for a specific period of time. The timeline varies from one product to another, but retained customers are those who continue to use and pay for your product for (at least) that long.
When you analyze customer retention using data, you can identify the reasons why users churn—making it easier to combat churn and build a product that retains customers.
Why Is Customer Retention Important?
For SaaS and other subscription-based businesses, analyzing customer retention is key to improving it, reducing churn, and building sustainable growth.
Metrics like your customer retention rate (we’ll show you how to calculate that in a bit!) are key health indicators for the business—because they show how well your product keeps customers around and continues to show them value. Plus, customer retention is a vital first step in growing revenue within your existing user base.
By analyzing and better understanding customer retention, you can:
- Banish churn—retention is the anti-churn
- Reduce customer acquisition costs (CAC) by squeezing more revenue from existing customers
- Improve customer lifetime value (LTV) by lengthening the average customer lifetime
- Create more opportunities to grow revenue via up-sells, upgrades, and cross-selling
- Set the stage for sustainable growth and MRR and ARR protection
What Are Customer Retention Analytics?
Customer retention analytics help companies dig into the who and why behind customer retention. By doing so, you can find proactive ways to boost customer retention and protect your bottom line.
Customer retention analytics can tell you:
- Why users churn
- Which behaviors, events, and demographics indicate customers are at-risk for churn
- The costs of churn and impact on your bottom line
- How to build a product that encourages retention and reduces churn
To analyze customer retention and proactively take steps to reduce churn, you need data—good, accessible product and customer data.
That’s why customer retention analysis hinges on building a modern data stack that ensures your org has all the right data and analytics at your disposal. The right data stack helps you turn data into insights—and insights into fast and effective product decisions that enhance retention and banish churn.
What Are the 5 Types of Customer Retention Analytics?
Customer retention analytics break down into five buckets:
- Predictive analytics help predict likely future customer behavior based on historical data, buying cycles, and market trends
- Prescriptive analytics go one step further, prescribing actual actions you can take to prepare for future customer behavior (many companies use Machine Learning to enable this)
- Descriptive analytics look at past data and compare it to current data to outline trends (month-over-month and year-over-year comparisons fall into this category)
- Consumption analytics measure how customers use your product and individual features within it, then analyze how that behavior affects outcomes like retention and revenue
- Diagnostic analytics answer your “why” questions—why customers behave the way they do, why revenue and conversions fluctuate, why some customers churn, etc.
Preparing Your Data for Customer Retention Analysis
Once your data is ready, you can implement a Product Analytics solution to streamline the analysis and visualization part. But before you can dig into customer retention, you need to have the right data collected, organized, and ready for Product Analytics.
Step 1: Identify the Data You Need
The first step is to figure out what kinds of data you need—so you can ensure everything is tracked. For customer retention analytics, you’ll need to collect data from three main categories. You need behavioral data like:
- Which features are used, when, and how often
- User journeys and flows for upgrades, downgrades, and churn
User characteristics like:
- Subscription type
- Location
- Device or browser
- Retention
Contextual data like:
- Acquisition source
- Marketing campaign interactions
- Notifications (both in-app and push)
Step 2: Choose Your Data Tracking and Storage Stack
Once you know which data you need, audit whether you already have access to that data or you need to add it to your tracking plan. After collection, we recommend storing customer and product data in a cloud data warehouse—where it will be organized and readily accessible to your Product Analytics solution.
If you don’t have a data stack in place already, you can read more about choosing a data tracking tool and cloud data warehouse here.
Step 3: Select a Product Analytics Solution
While you can cobble together a crude customer retention analysis using a tool like Google Analytics, it’s much faster and more accurate to use a Product Analytics tool like Indicative.
We trust you to weigh your options and choose the solution that works best for you, but here are some of the reasons we believe Indicative is the best option on the market:
- Quick, easy setup: Indicative connects directly to your data. It’s the only Product Analytics platform to connect to your data warehouse.
- Simple, no-SQL user interface: With Indicative, there’s no SQL or coding required to run analyses, so business users—from product managers to marketers—don’t have to learn code or wait for the data team to run queries.
- Advanced real-time analytics: Product Managers can run analyses on their own and answer questions right away, enabling faster, data-driven decisions and product improvements without the bottle-neck of a data or technical team support.
- Built for customer and product analysis: Unlike SQL and Business Intelligence (BI) platforms, Indicative is built for Product Analytics, to make complex retention analysis quick and accessible throughout the team.
How Do You Analyze Customer Retention?
Once you have all the data you need, how do you make sense of it? How do you actually do customer retention analysis?
The first, most important step is to define what retention means for you. As we said before, customer retention isn’t the same for every product or every company.
A company selling clothing box subscriptions might define retention as a customer who maintains their subscription for at least 6 months. A tax software company may consider a customer retained if they use the software for a second year.
Find out what retention is for your product—then you can measure it.
The next step is to calculate your customer retention rate. This number serves as a baseline metric and an indicator of your progress. Your analysis and resulting improvements all aim to increase your retention rate.
Here’s the formula for customer retention rate:
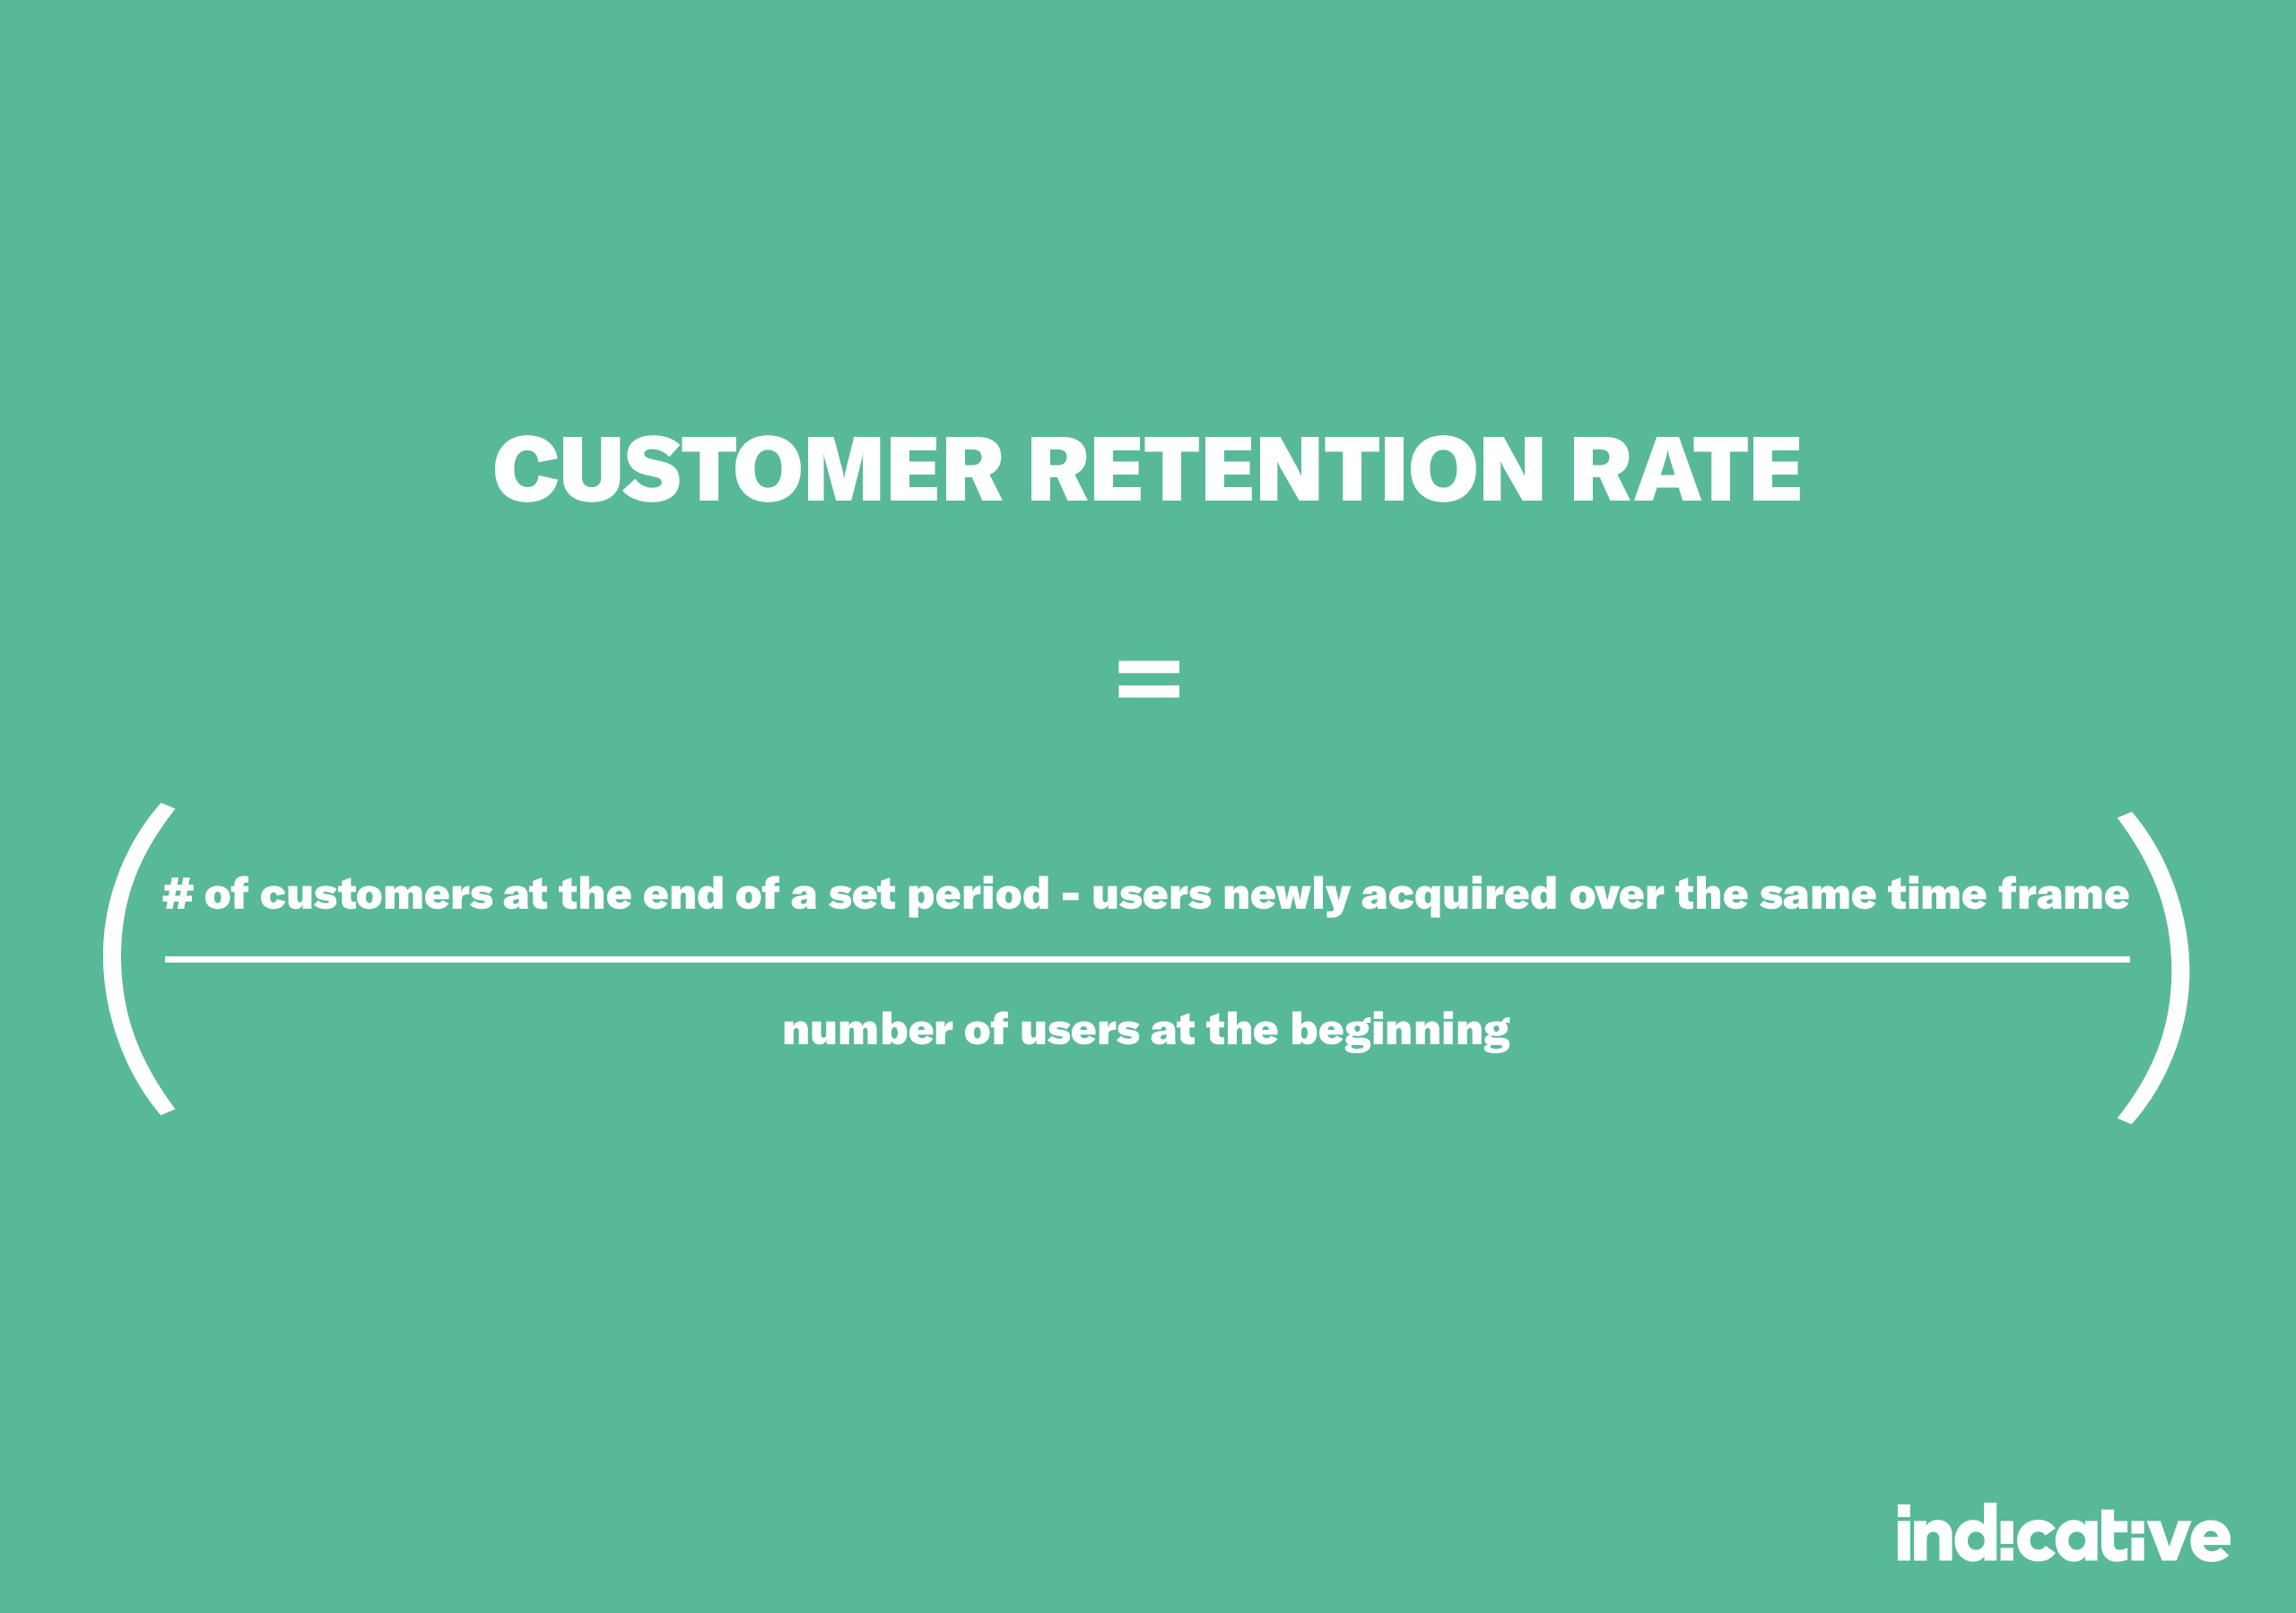
Multiply the answer by 100 to see your retention rate as a percentage.
Now that you’re ready, the next steps are all about using cohort analysis, segmentation, customer journeys and user funnels, and other analyses to better understand retention and how you can improve it.
1. Identify Which Customers Churn (And Which Don’t)
The best place to start is by developing an understanding of who churns (and who sticks around). Lots of characteristics and situations can lead to churn or protect against it, so the best way to approach this is by grouping customers in cohorts.
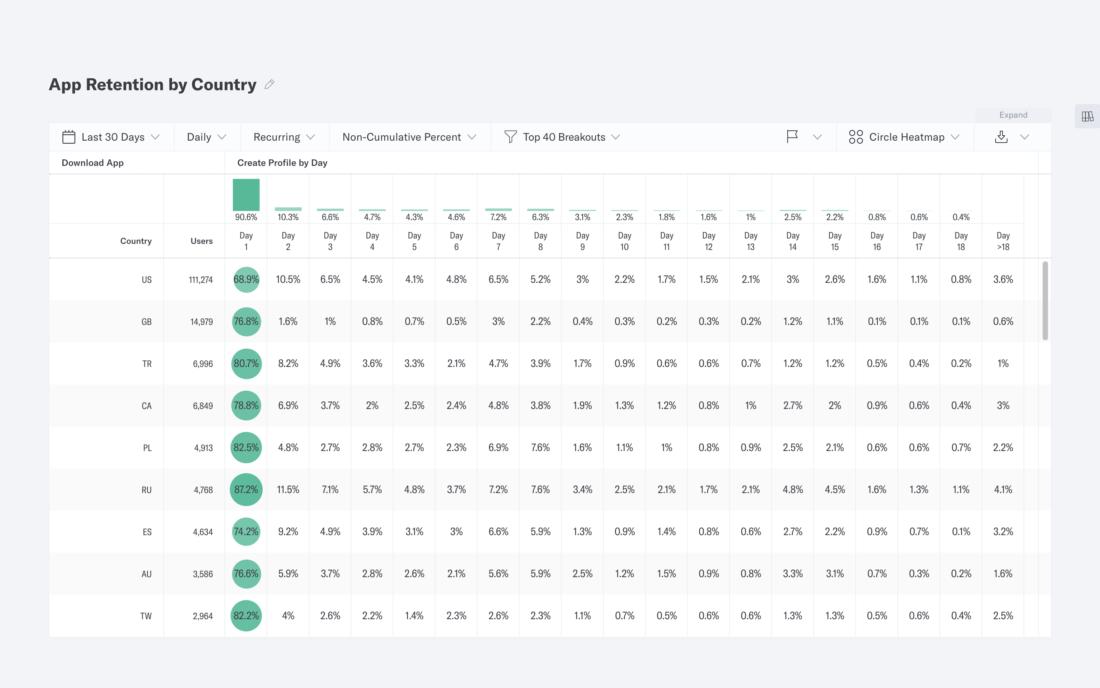
Using the Cohort Analysis feature in Indicative, for example, you can create separate cohorts based on things like when customers sign up, demographics, and other user characteristics. Look at things like:
- Age, gender, income, employment, etc
- Plan or pricing tier
- Acquisition source
- Customer persona
Analyzing churn, retention, and retention rates through this lens can help you develop a comprehensive picture of who churns and who doesn’t, pinpointing specific types of customers who are more or less likely to churn.
2. Find Out Why Those Customers Churn (Or Stick Around)
Figuring out why customers churn can involve a little more in-depth retention analysis. Once you have a cohort or segment of customers with a low retention rate, you need to dig deeper to find out why they’re more likely to churn. This is the crucial step in identifying ways to reduce churn and increase retention overall.
Using Indicative’s Customer Journeys tool, you can dig into the customer behavior that leads up to churn.
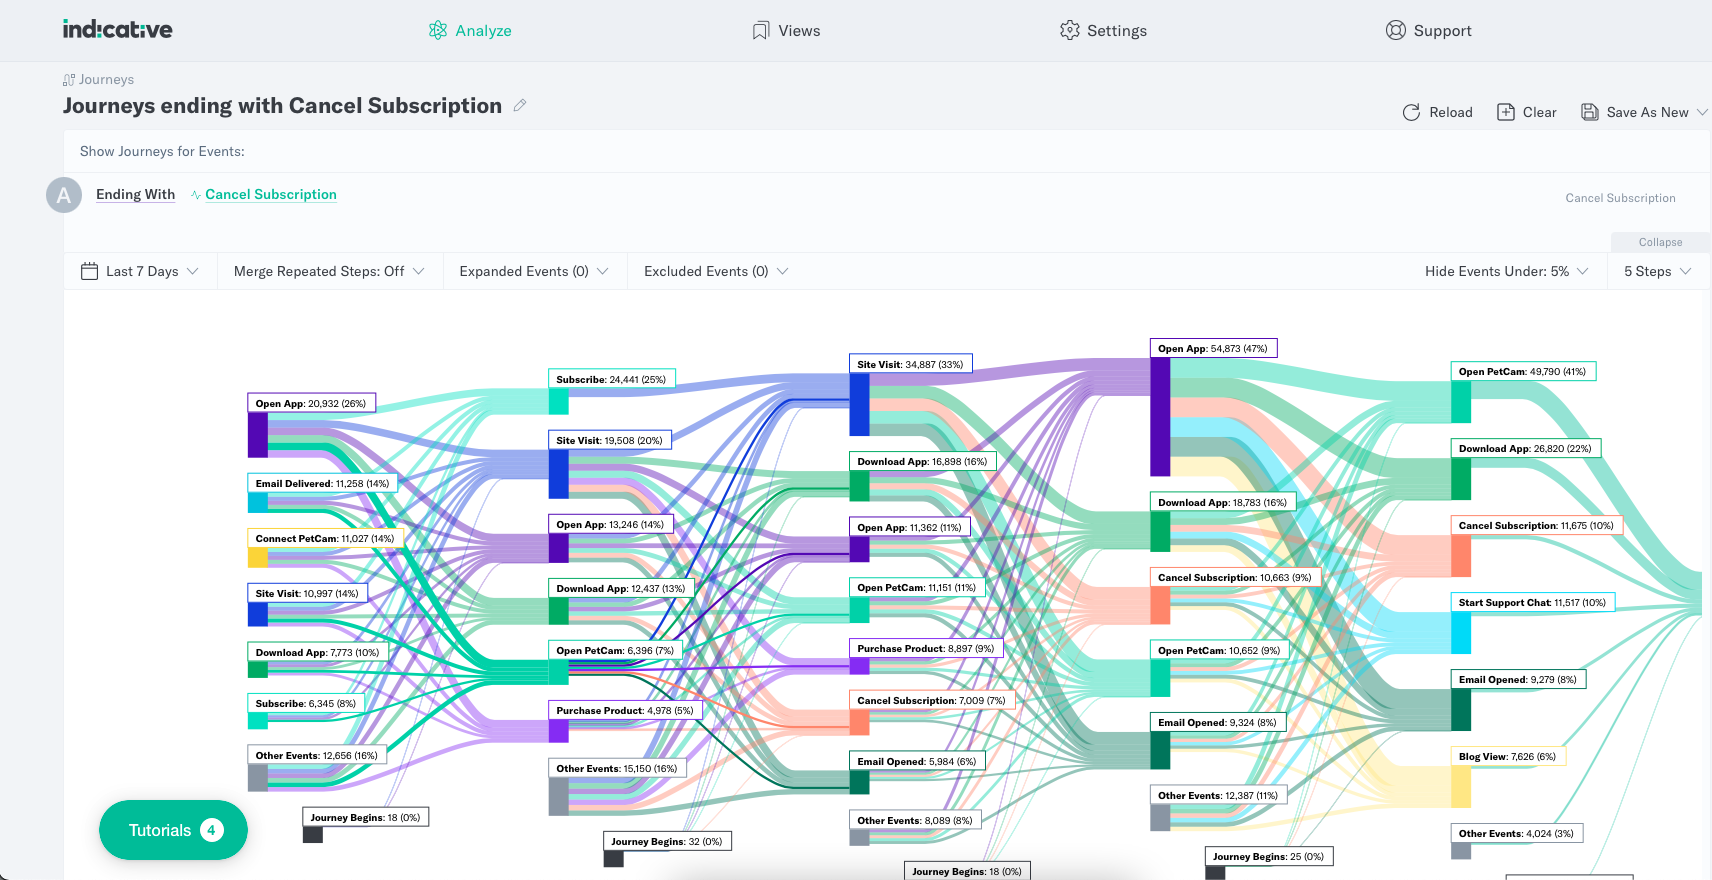
Set churn as the ending event, then look at usage—overall and by feature—and any product errors or issues commonly encountered. Identify features often used by those who churn along with those used by your highest retention customers.
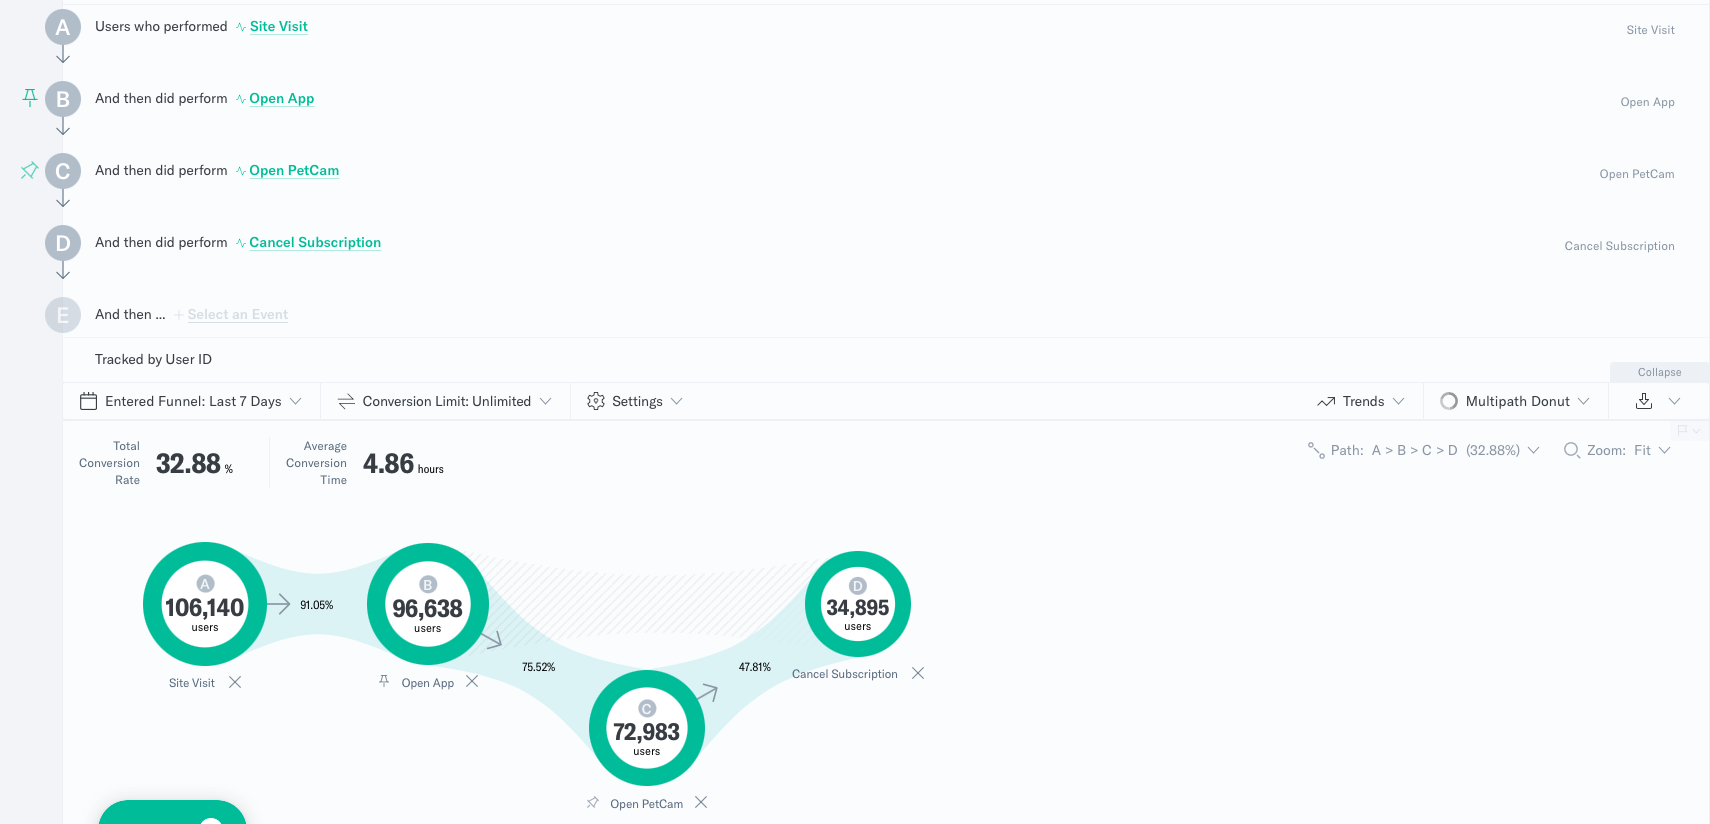
Once you identify user flows that commonly lead to churn and retention, you can pull them into our Multipath Funnel tool to better understand how each step of the path impacts churn.
Remember to identify behaviors and usage patterns that correlate with churn and retention.
3. Flag Behaviors That Indicate Churn Risk
While analyzing user flows that lead to churn, flag any behaviors or characteristics that correlate with high churn and low retention rates. That can include:
- Features
- Usage patterns
- Campaign interactions
- User characteristics
Put an early warning system in place for when customers run into these triggers or when their behavior indicates churn risk, so you can proactively manage the customer and prevent churn.
Strategies to Reduce Churn With Customer Retention Data
Now that you have a holistic understanding of churn, retention, and what causes both, you can implement strategies and changes to reduce churn.
Start by Attracting the Right Customers
All the product optimization and improvement in the world won’t help your customer retention rate if you aren’t attracting the right customers in the first place. Worse, if customer retention analytics based on people who aren’t your target customers are guiding your product strategy, you can spend a lot of time and energy chasing your tail.
While analyzing customer retention above, you should’ve made note of whether certain demographics, acquisition sources, or campaigns correlated with churn. Based on that knowledge, you can tailor future marketing campaigns, channels, and messaging to attract the kind of customers most likely to stick with your product for the long haul.
Prioritize Your Most Valued Customers
Once you have the right customers in the door, prioritize them—spending the bulk of your team’s time and effort on building a better product for these customers and encouraging them to stay.
- Allocate support resources (including live support agents and self-service resources) built for them
- Develop and improve the features these customers use most often
- Spend your time mitigating churn within this group of customers first
You know which behaviors tend to correlate with retention, so invest in encouraging your best customers to follow the best path and usage patterns to reduce churn.
Use Predictive Models and Machine Learning
Predict how customers will behave in the future, and you can proactively improve the product and prioritize changes that will have the biggest impact on retention. That’s where Predictive Analytics comes into play.
But actually predicting how customers will behave in the future is complicated and takes a lot of time. That’s why many companies use Machine Learning (ML) to handle this part.
If you use a Product Analytics tool like Indicative, your data team doesn’t have to spend any time on report requests from the product team—so they have more time to focus on larger projects like implementing and maintaining ML and predictive analytics models that can help with churn reduction.
Establish Flexible, Scalable KPIs
Improving churn and retention rates requires flexible, scalable KPIs and product metrics you can measure and improve over time. We recommend tracking:
- Customer churn rate
- Customer lifetime value (LTV)
- Customer engagement score (CES)
- Net Promoter Score© (NPS)
- Revenue retention rate
- MRR churn rate
Takeaways
- Customer retention analytics are your best tool in fighting churn and protecting revenue
- You can use Cohort Analysis to identify user characteristics—and customer journey and funnel analysis to find behaviors and usage patterns—that lead to churn
- Reduce churn and grow retention by bringing in the right customers, encouraging high-retention behaviors, and improving your product based on predictive modeling

 Indicative Team

