

One of the most exciting parts of working in Gainsight’s Customer Success Operations team is getting a sneak peek at new features and functions as our product team rapidly innovates. We are our own harshest critics – I love giving the product team feedback as I run the Gainsight platform for Gainsight.
Our early access to Gainsight’ beta Horizon Analytics, gave us four months of testing processes, and I have to say the results are exciting. This product enhancement streamlines the end-user experience, surfaces insights that customer-facing teams need in reports and dashboards, all with the end goal of driving greater adoption and retention.
Analytics – Simplified
Since having initial access, we have leveraged the new Dashboard Builders features to enhance our existing dashboards and build new exciting dashboards. Beginning with my day-to-day experiences, the unique bright and clean appearance helps to keep me engaged. Adult learning specialists state that using eye-pleasing colors reduces fatigue, increases the user’s attention level and helps focus on content as much as 40 percent. The new Horizon Analytics Dashboard Builders feature strategic colors that improve clarity and readability – all which is customizable for a customer’s business.
Even more exciting are the enhanced usability and advanced power behind these functions and features. These include the ability to embed links to web pages, such as company portals and reports from other tools, such as Tableau. By embedding links and reports directly into the dashboard, I can increase ease of use and help drive more efficiency for our team. In addition to being able to embed reports, there is a new widget that allows me to include text sections. I can break out the dashboard into different sections based on the use case, business, and explain how these sets of reports can be leveraged.
Centralized Data Visualization
When I want to incorporate insights from other sources, they can now be embedded directly in the dashboard. Imagine looking at data from company portals, Tableau, or elsewhere all in one place. Even edits made from those external locations are automatically updated in real-time. This alleviates the need to switch between applications and gives me the ability to easily share information that our users care about.
Instead of executives looking for data in two places, they can examine all the information, side by side, in one location. Add to it that everything in Gainsight can functionally interact with embedded data, and users never have to leave the platform. By staying inside the platform and dashboard, our operational processes can be streamlined.
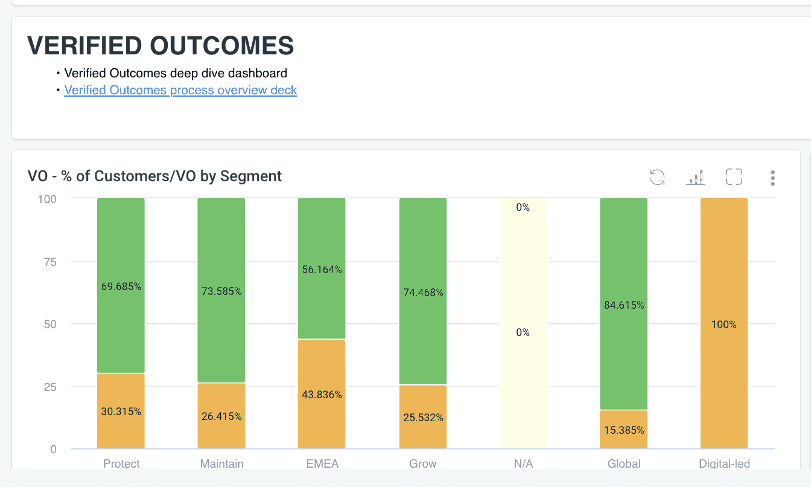
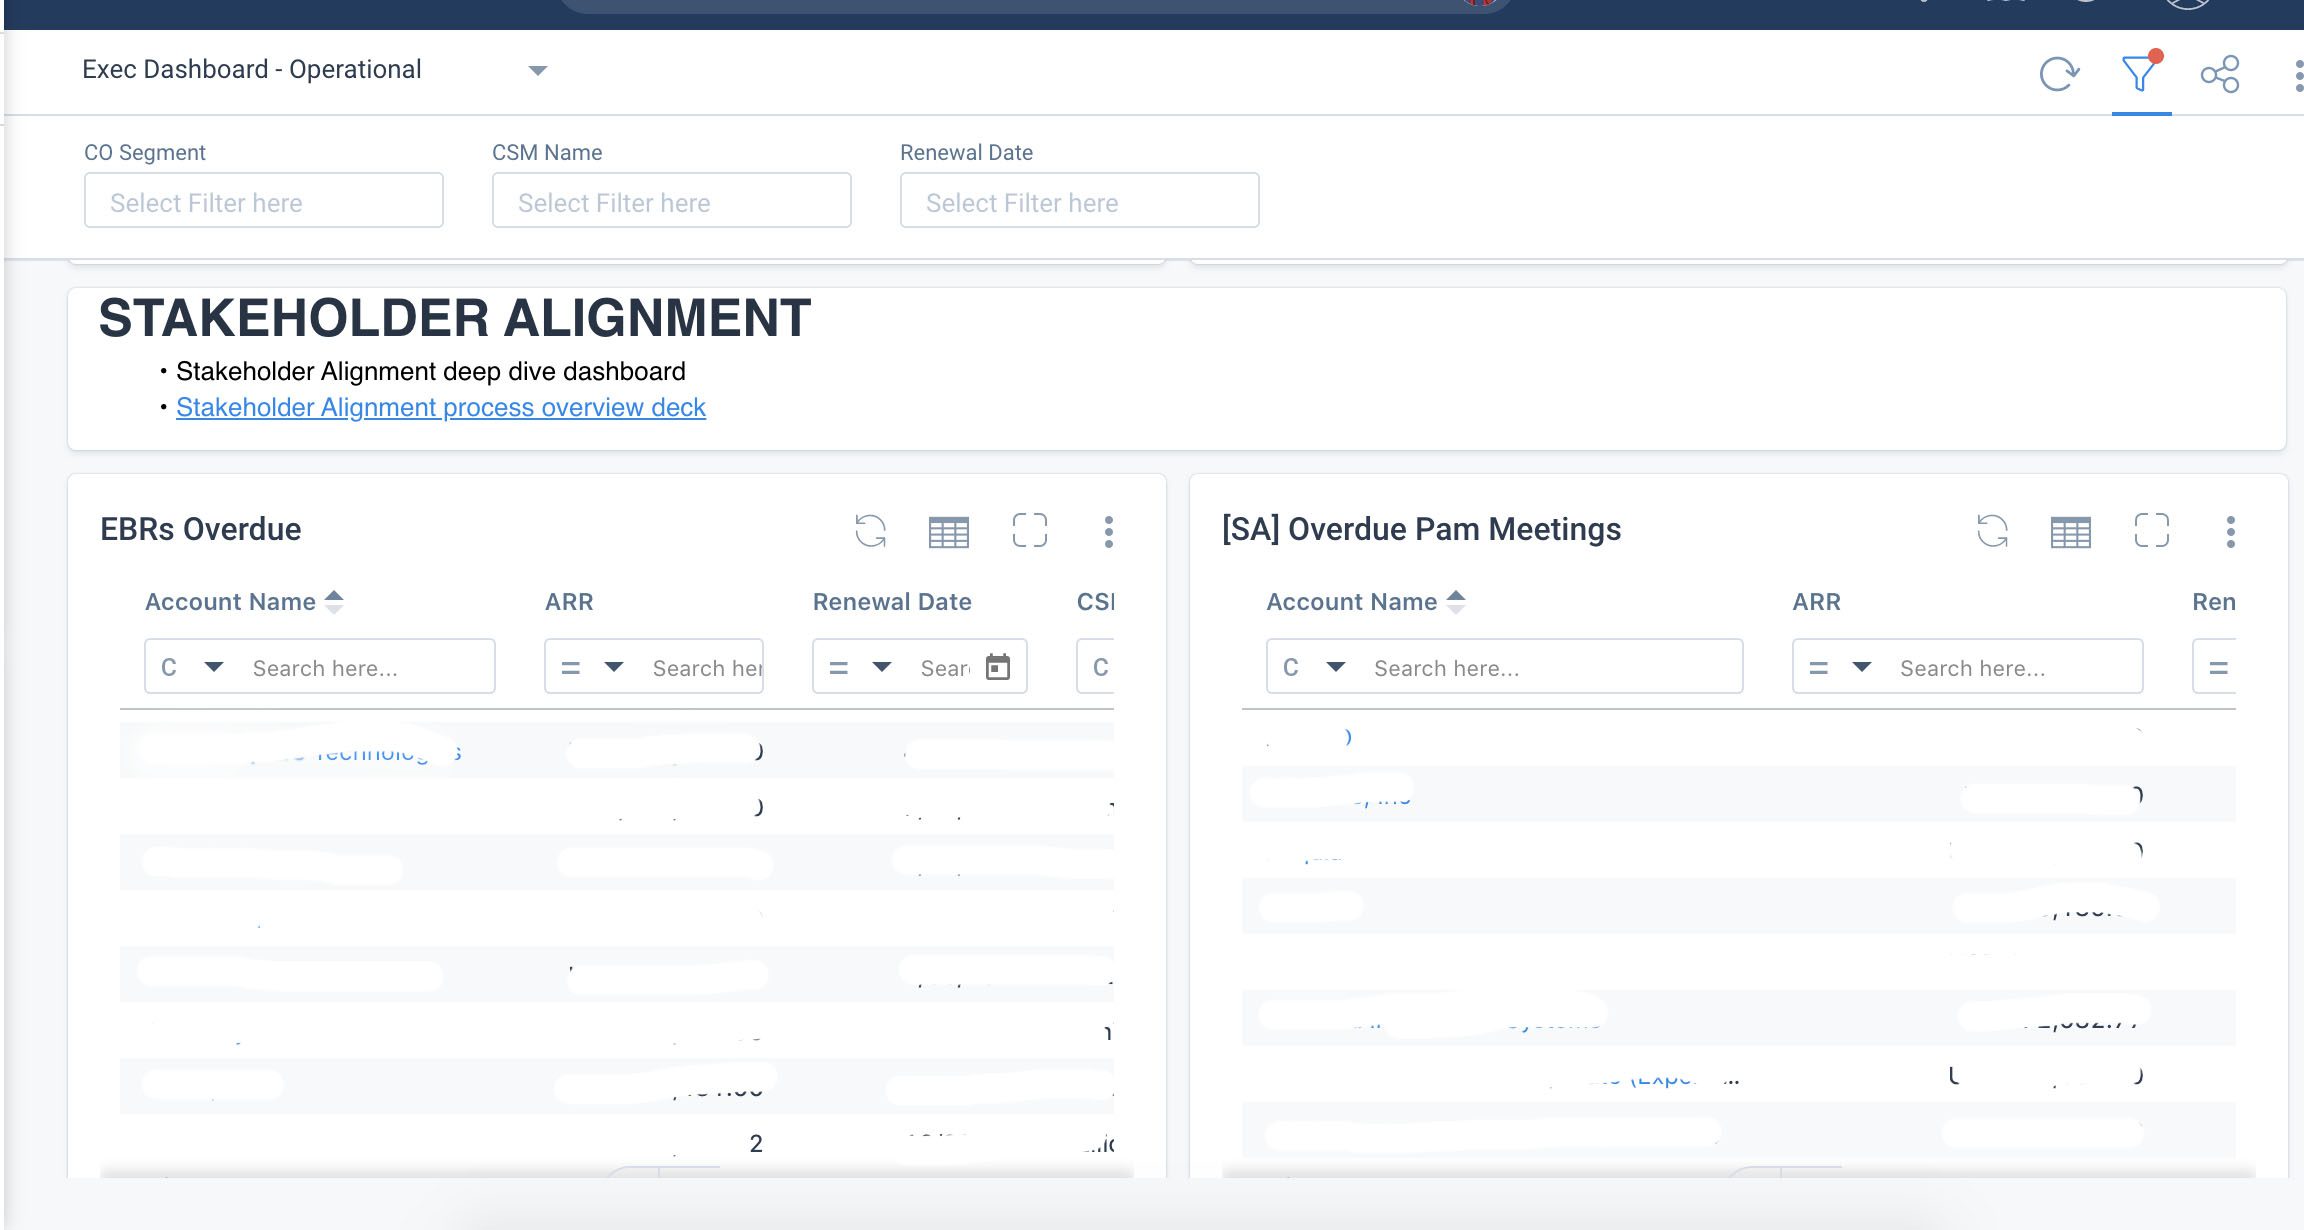
At Gainsight, we drive many key processes through the platform including stakeholder alignment, verified outcomes, and risk management to mention a few. Within a single dashboard, I can include the most important reports for tracking the effectiveness of each process and embed text above each of these sections to include commentary helpful for senior leadership. I can give more details by incorporating links that might take executives to other dashboards or web pages. For instance, if Gainsight’s SVP of CS, Kellie Capote, needs to dig into a particular use case, I can include a link to another dashboard that includes a deeper look into the process.
Additionally, there is no need for descriptive documents outside of Gainsight to guide our executives or users on which dashboards to leverage for specific processes. Directly within the dashboard, I can provide step-by-step in-app guidance. And all of the reports serve as that enablement component. They help users land in the right dashboard and know precisely how to use this data to drive their day-to-day decisions.
Improving Executive Communication
In Horizon Analytics, there are three new stand-out benefits. One is the focus the product team put into reducing the efforts of the operations team to build reports. When building a chart, I can still make that chart clickable to display the underlying data, and now that click-thru saves even if I adjust the report structure. AND we can finally rename the fields in the click-thru to be more readable for our end users!
It’s a lot easier for end-users to read and understand the underlying data. The entire motion saves time as a Gainsight admin. Processes that used to take me at least 20 minutes can be done in less than half the time. On an individual report basis, what used to take me up to ten minutes now takes two to three—a significant improvement.
Another great new feature is the ability to customize the appearance of reports – not just chart type but I can completely change the way the report looks! Utilizing varied font sizes or legend placement, I can create a more consumable report. The full ability of customization throughout Horizon Analytics also includes colors, logos, and embedded images on dashboards. The customization capability extends into decks that I might have to prepare for teammates.
Lastly, the new dashboard sharing capabilities are top-notch! One example is a dashboard that is scheduled to share with executives every Monday. I can set up the schedule, include a note, and send it as a PowerPoint or link to that dashboard (note the link is only for licensed users). Another example is our weekly business review decks that are pre-prepped and ready to go for whoever needs them for business meetings occurring that week.
Mass Edit Reports – Simple, Fast, Easy
There are significant improvements to Data Designer, Renewal Center, and Experience Center. But it’s Horizon Analytics Dashboard’s incredible customization and how fast it loads that makes my job easier. Dashboards aren’t just more customizable, there are also significant improvements to load time. Comparatively, a dashboard that has a large number of reports on it loads quicker than ever before. The process went from minutes to mere seconds.
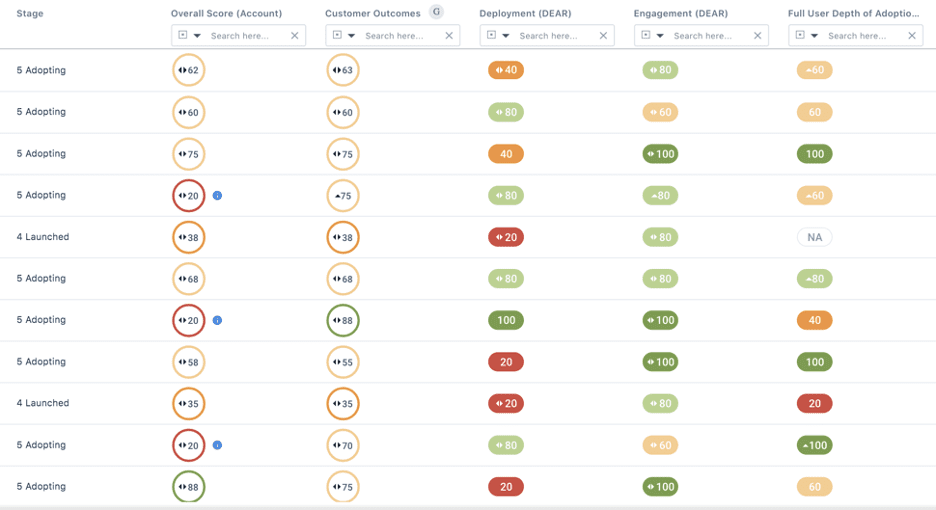
Gainsight has introduced a new scorecard look to our Mass Edit Reports. Horizon Anaytics now offers prepared template reports that enhance the Scorecard and trending scorecard data. Before, I had to create them manually in the platform. Now, they are pre-built while still customizable with a drag and drop motion improvement.
What I see are all customers with their different scorecards in one place. There’s also a new second version of Scorecards called Habits. Habits pivots the scorecard data so I can see the changes in a specific scorecard measure over time. Seeing the trends over time allows for preemptive actions and long-term plans. We leverage these reports to understand if the key motions we’re running are having the intended impact. The look and feel is sublime and these reports are easier to build now that they are out of the box!
Creating Efficiency
Since the introduction of Horizon Analytics, my job is easier with cleaner reports, uncomplicated dashboards, and enhancements that create day-to-day efficiency gains. Also, when taking the pulse on my metrics, there are some definite improvements. I begin my workday with a clearer vision of potential accomplishments and where I need to focus my time in operations.
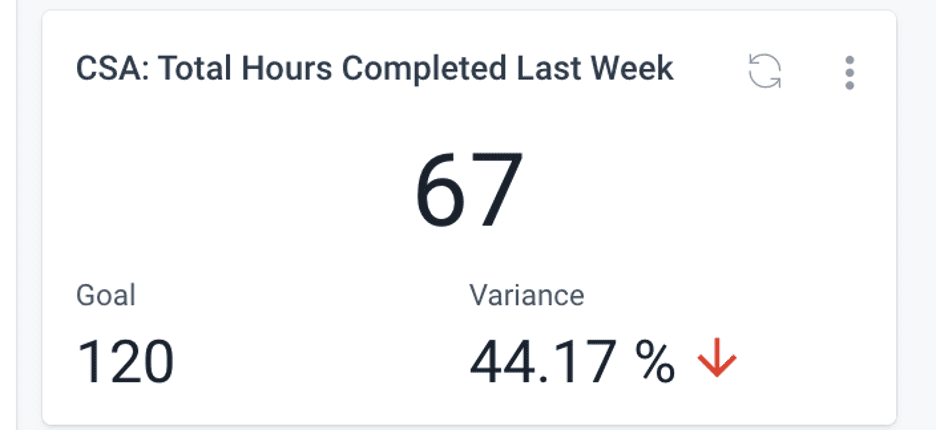
One example is my work managing our Customer Success Architect team, who have a weekly goal of tracking their investment team. Within a “widget report”, we can now add a goal metric to quickly identify how close we are to hitting our number. This quick visualization of where I am regarding the KPIs vital to my role is helpful. We’re already applying this across several other processes at Gainsight, including quarterly GRR, Stakeholder Alignment compliance, and many more!
Achieving Goals
With all of the new capabilities that Horizon Analytics introduces, tools, revisions, and improvements, I believe there is clarity in the daily path I plan and the ability to achieve my goals. It begins with the screen I look at every morning. Fewer elements mean a clean slate. There are also fewer steps to complete my actions – fewer clicks and pages decrease my time spent and improve efficiency. The ability to customize views and provide in-app help via the text sections are going to be a big boost for enablement.
Gainsight has made the platform more powerful, lightweight, and convenient with an enjoyable experience. Everything, including the visual enhancements of Horizon, makes me more excited to use it. As I continue to explore Horizon Analytics, I’m learning how to optimize my use of it. Add that I can robustly share information and reports while saving time through consistent web and mobile experience and the capacity to keep my management in the loop regularly. Simple. Fast. Easy.
Don’t you want to spend time in a product that will not only make your job easier but deliver an experience that you will love? Watch our Horizon Analytics product launch to see for yourself how we can supercharge your insights to ensure your organization stays customer-centric.