


One-click dashboard templates are among a number of tools available within eG Enterprise to allow organizations to rapidly set up targeted and bespoke views for a wide range of audiences across their organizations, whilst avoid the costs and inconsistencies of building and maintaining many individual dashboards.
One-Click Monitoring Dashboards in eG Enterprise
In addition to a wealth of out-of-the-box dashboards that are installed and populated by default ready-to-go upon installing eG Enterprise, for several versions we have had a One-click Dashboard feature that uses templates. These templates provide domain specific overviews for specific technologies and components, for example, generic servers or Java applications. To start monitoring a specific server or group of servers the administrator simply has to create a one-click dashboard, choose the desired template and then configure the GUI to point it at a particular server, a subset of servers or all servers as appropriate.
eG Enterprise supplies a number of built-in templates or users can choose to make their own templates using the GUI editor, or as of v7.2 export existing dashboards as templates.
How to use One-Click Dashboards in eG Enterprise
Our “Java Application” is a particularly popular template as it allows those deploying Java apps to create dashboard overviews for new Java application servers in seconds which they can share with the teams responsible for or involved with that specific server.
To setup a one-click dashboard, go to the “Monitor” tab in the eG Enterprise console and select Dashboards -> My Dashboard -> Dashboards.
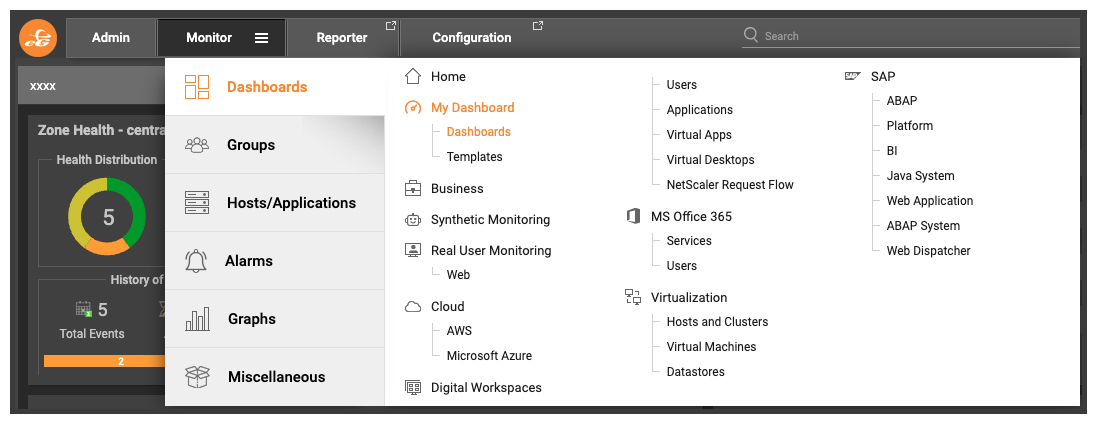
Once on the Dashboards pane, choose “Add New” or the “+” icon and you will be offered the choice to create a custom dashboard or a One-Click Dashboard.

Once you have chosen the one-click dashboard option. You will be presented with a single simple form with a few fields to set that once completed will create your dashboard with a SINGLE CLICK of the “Create” Button – it is that easy.

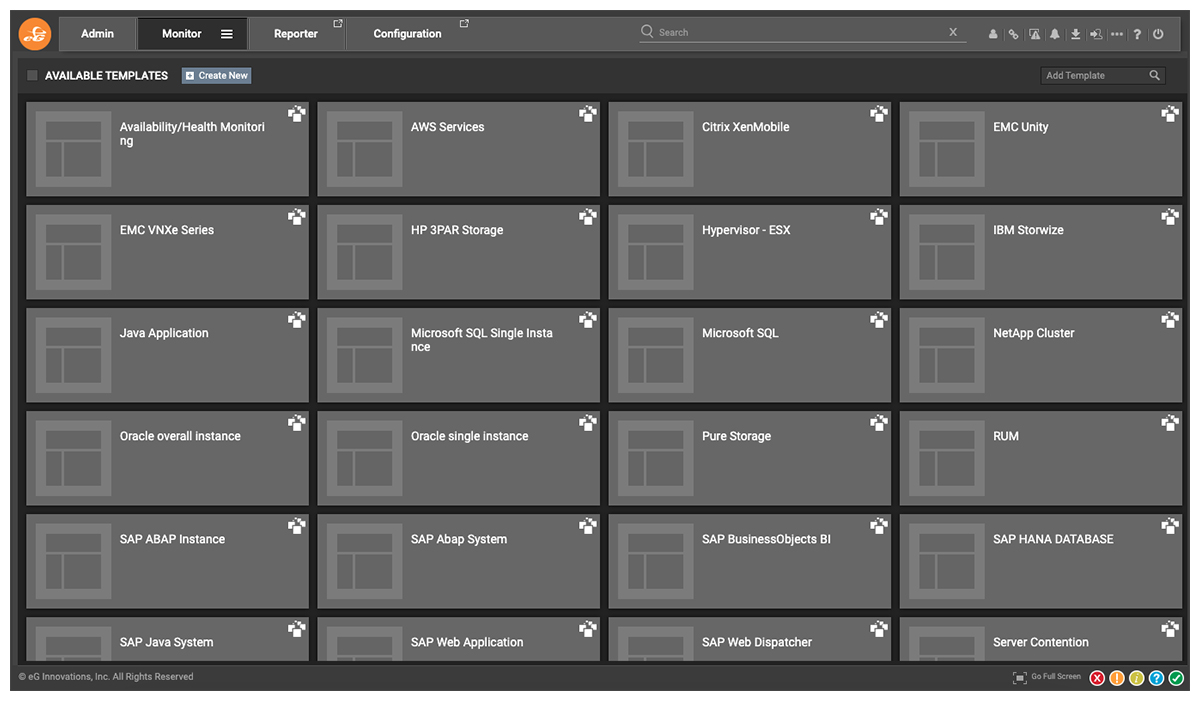
First, fill in your Dashboard Name and Component as you please. Then choose a template from those available which will include any eG Enterprise predefined ones available for the components monitored by eG Enterprise in your environment (you won’t see this list cluttered with templates for things you aren’t using), plus any templates you have created for yourself.

After creating the dashboard it should soon become populated with data. Many of these new dashboards have been designed for use at scale to minimize the amount of unnecessary information presented. When applying this dashboard to 100 rather than 3 Citrix XA servers it would otherwise become rapidly overloaded with data on healthy servers. This means healthy metrics regarding servers not experiencing contention are not added and helpfully only the servers of concern are shown.
Widgets on the Server Contention dashboard will show those servers with concerning symptoms such as “high CPU queue”

New Dashboard Templates in eG Enterprise v7.2
The recently released version 7.2 of eG Enterprise includes new additional dashboard templates for our one-click dashboard feature for several technologies, including:
- New dashboards for DB2 include “DB2 Overall” and “DB2 Single Instance”
- “Hitachi VSP Gx00 Series”
- “Microsoft SQL Single Instance”
- New dashboard templates for SAP including “SAP ABAP System”, “SAP BusinessObjects BI”, “SAP HANA DATABASE” joining other SAP templates such as those for “SAP Java System”, “SAP BTP Cloud Foundry Environment”, “SAP ABAP Instance” and “SAProuter”
- For Citrix customers there is a new “XA7 Overview” dashboard
- Additional EMC dashboards include ones for “EMC PowerVault ME” and “EMC VNXe Series”
- For SQL and database users, new dashboard options include “Microsoft SQL Single Instance”, “SQL Server Overall” and “MySQL Database”.
- There is also a new dashboard to monitor a “NetApp Cluster”.
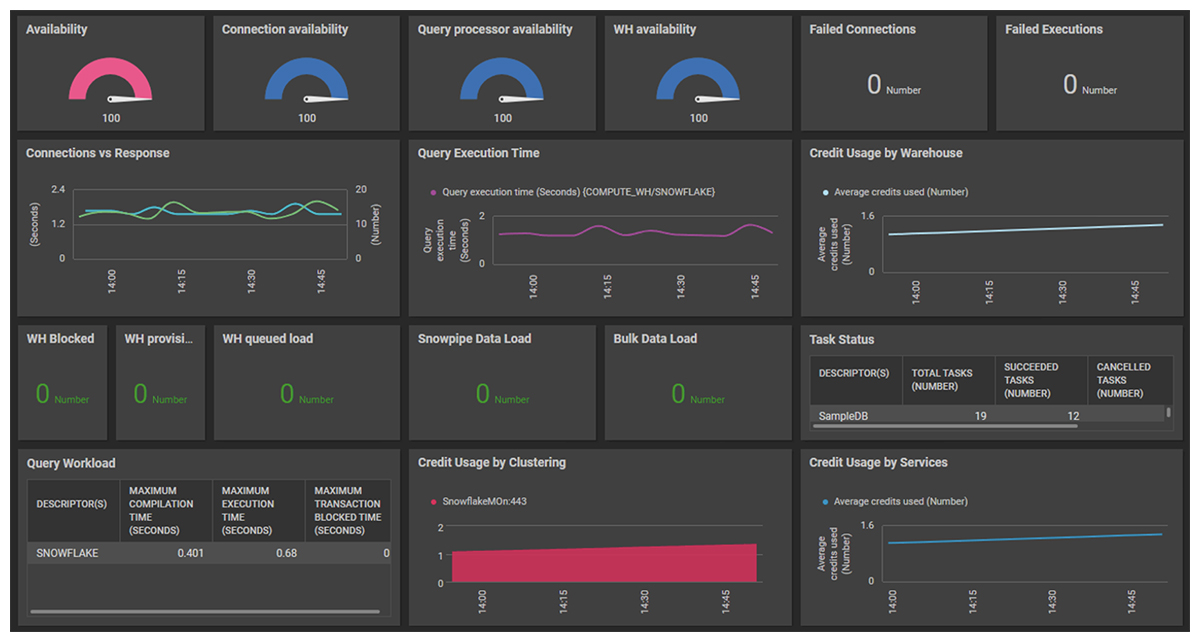
- For those using Snowflake for cloud-based data warehousing, “Snowflake Overall” and “Snowflake Single DB” are available.
- Other new templates include “IBM Storwize” and “HP 3PAR Storage”, “Oracle overall instance”, and the particularly useful “Server Contention”.
New to v7.2 – How to Export a Custom Dashboard as a Template
In addition to the out-of-the-box templates provided within the eG Enterprise product, customers can now export any customized dashboards they have designed for use as templates for reuse within their business. Ensuring customizations are standardized and reused with the benefits of consistency and eliminating unnecessary repeated customization. Previously templates needed to be created using the GUI template editor.
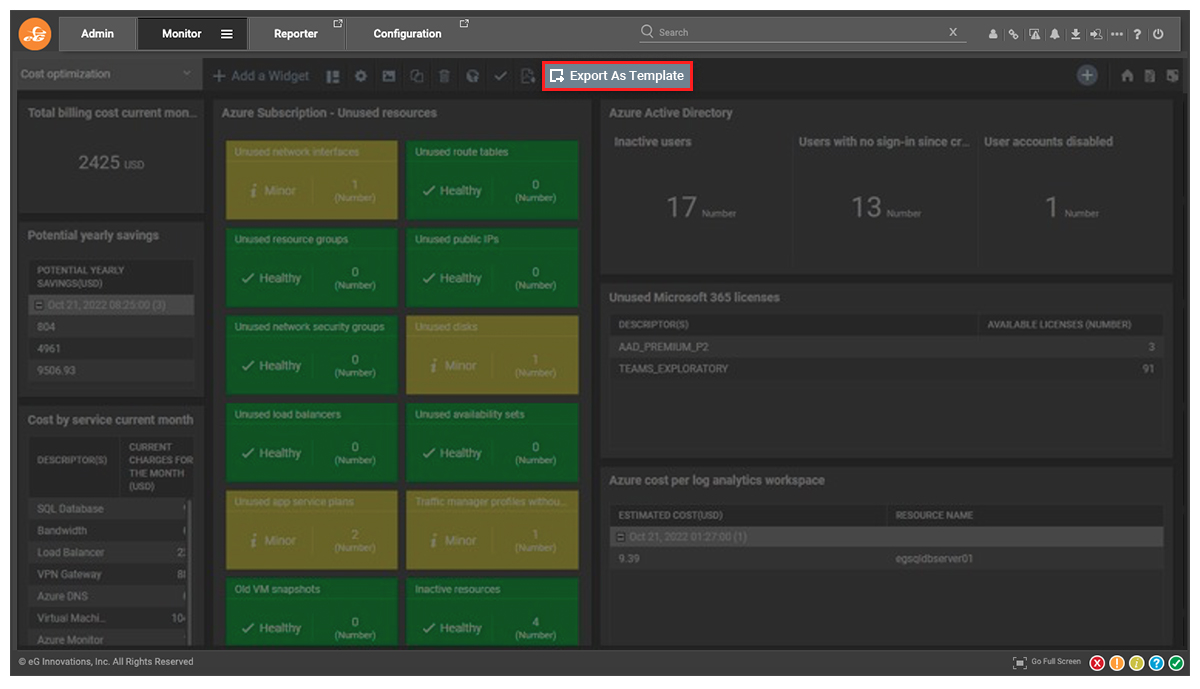
When editing your custom dashboard in v7.2, you will now find an “Export As Template” button in the tool bar.
One-click Dashboard Templates
One-click dashboards available in eG Enterprise v7.2 now include:
- SAP BTP Cloud Foundry Environment
- Redis
- SAP Web Dispatcher
- RUM
- Citrix XenMobile
- Availability/Health Monitoring
- SharePoint Usage Analytics
- SharePoint
- Hypervisor – ESX
- Systems
- AWS Services
- XA7-DirectorView
- XA7-Overview
- Java Application
- VMware Virtualization
- Microsoft SQL
- SAP ABAP Instance
- SCP Neo
- AWS Connect
- SAProuter
- Server Contention
- Oracle single instance
- Oracle overall instance
- Microsoft SQL Single Instance
- SQL Server Overall
- Mongo Database
- MySQL Database
- PostgreSQL Database
- DB2 Single Instance
- DB2 Overall
- SAP ABAP System
- SAP Web Application
- SAP Java System
- SAP BusinessObjects BI
- SAP HANA DATABASE
- Snowflake_Single_DB
- Snowflake_Overall
- EMC Unity
- Pure Storage
- IBM Storwize
- Hitachi VSP Gx00 Series
- EMC VNXe Series
- EMC PowerVault ME
- HP 3PAR Storage
- NetApp Cluster
- Kubernetes/Container engine
Other Dashboard Features
Users who have more complex needs beyond either:
- The eG Enterprise out-of-the-box dashboards
- Or the one-click dashboards available from the built-in eG Enterprise templates
Can use “Custom” Dashboards or build their own templates for one-click dashboards. Details on how to do this are available in the documentation, see:
- How to Add a Custom Dashboard (eginnovations.com)
- Designing a My Dashboard (eginnovations.com)
- Building a Custom Template (eginnovations.com)
A wealth of customizable and pre-built widgets are available to those building custom dashboards. These can also be added to existing dashboards if augmentation is required. The new version 7.2 of eG Enterprise has also added a number of new widgets that I hope to cover in a future blog, so if you are already using eG Enterprise it is worth overviewing the new widgets when you upgrade.
eG Enterprise is an Observability solution for Modern IT. Monitor digital workspaces,
web applications, SaaS services, cloud and containers from a single pane of glass.


