Every time there is an outage, questions are asked about an organization’s monitoring strategy:
- Were the right tools in place?
- Were there early warning indicators?
- How much time did the IT Operations team need to identify the cause of the problem and fix it?
- Did the tools in use alert the IT Operations team to an incident when it happened?
- Could they have done better?
After all, when an IT outage occurs, it disrupts the business. Employee productivity is impacted, customers are unable to transact, and the organization’s brand is at stake.
 Monitoring needs to cover all aspects of IT – from hardware, to storage, to server to the application stack. With the focus on keeping users happy, the importance of monitoring at the application layer has had more attention recently.
Application performance monitoring refers to the detailed insights gleaned about an application’s performance. It is no longer sufficient to know if an application process is running or not, or whether the application is responding to a request.
In this blog, we will focus on Application Performance Monitoring (APM) – what is it, why is it important, and why enterprise IT teams are focusing on it.
What is Application Performance Monitoring?Application performance monitoring is the strategy and practice of continuously monitoring and tracking the performance of business applications and the user experience of end users as they access the applications to understand trends, isolate anomalies, and get actionable insights for problem resolution and code optimization. |
The Basis of Application Performance: User Experience
 Measuring the availability, response time, and behavior of each business transaction is key to understanding the user journey. When a user performs a transaction on a digital business service, the application owner needs to know:
- If the application is responding as it should
- Whether all the backend processes are being executed as they should
- If there is any slowness in transaction processing, which part of the application architecture is causing it
- Whether there is an error/bug in the application code, a problem in the application server or in the web front end, a query executing slowly, a hotspot in the backend database, slow network, etc.
So, monitoring must evolve from just looking at hardware metrics to analyzing application codes and business transactions. The performance of an application should be measured with a user-centric view. This forms the basis of Application Performance Monitoring (APM).
Why is Application Performance Monitoring Challenging?
|
The toughest IT performance problem today is the one where users complain that the “application is slow”. IT administrators then must figure what is causing the slowness – is it due to the application code or the underlying infrastructure?
|
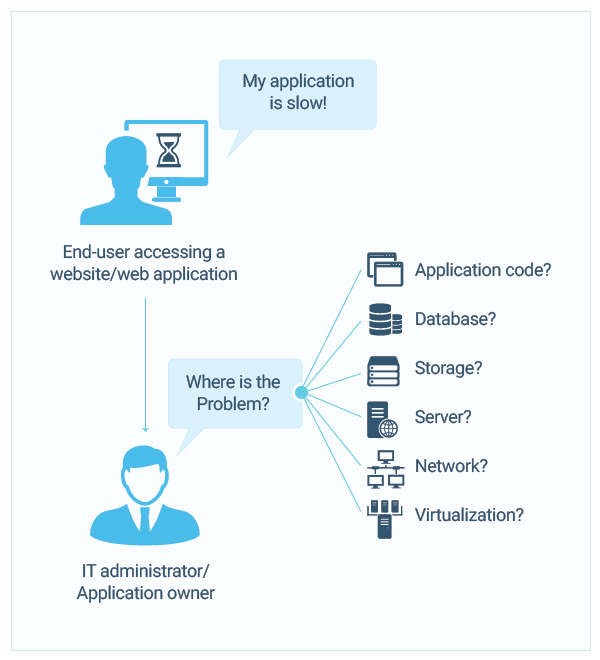 Most modern applications are multi-tiered with multiple tiers of components working together to support the application. For example, a website may involve several web server front ends, a few middleware application servers, and backend database servers. The use of multiple tiers means that there are more elements that must function well for the application as a whole to be performing well. When a problem occurs, the multi-tier architecture makes its diagnosis harder. Which of the tiers is causing the issue?
Modern applications also span domains of control. The infrastructure being used could be on-premises or cloud-based. The infrastructure could be operated by one team, the server OS could be the responsibility of another team, and the application could be the responsibility of yet another team. As each team uses different toolsets for monitoring and administration, there is no single pane of glass from where IT administrators can determine why an application is slow.
|
According to industry analyst, Gartner, enterprises will have increased the percentage of applications they monitor with APM tools from 5% in 2018 to 20% in 2021.
|
Five Aspects of Application Performance Monitoring
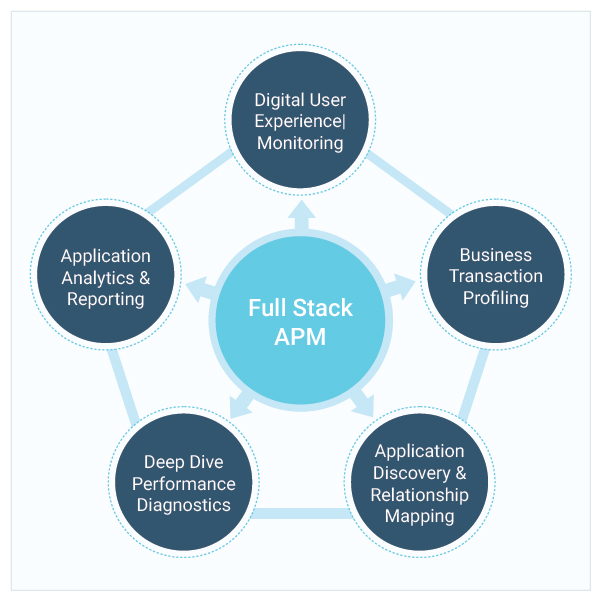 An APM solution you deploy should ideally have the following five capabilities:
- Digital user experience monitoring: This deals with tracking the experience of application users and identifying times when they experience slowness, errors, and downtime. There are two popular approaches to doing this: by synthetically simulating user transactions and testing them proactively from different locations; and by passively monitoring user experience of real users as they access applications in real time.
- Transaction profiling: This involves instrumenting bytecode during application runtime and analyzing the transaction flow through every tier of the application architecture to isolate where slowness is being caused. Using a tag-and-follow approach, business transactions can be traced through the front end, across the middleware, and all the way to the backend database.
- Application code-level diagnostics: When transaction tracing reveals that slowness is occurring at the application server, the application developer needs to know if there is a problem in the application code. According to a DZone performance survey, 43% of application performance issues are due an issue in the code. Transaction profiling usually provides the capability for developers and app owners to drill down into the code and get method-level processing time breakdown. If a user transaction is slow, it is then possible to pinpoint the exact line of code, database query, or third-party call that is taking high processing time.
- Application deep-dive analysis: When there’s a problem in the application infrastructure – say in the application server when the connection pool is exhausted or there is high wait time for threads, or in the JVM or .NET CLR level when Garbage Collection is happening frequently or there is insufficient heap memory – it will affect application performance. Detailed visibility into the application infrastructure is a must.
- Infrastructure visibility in context of application performance: Many application issues occur due to slow network connectivity, a memory leak in the server, virtualization bottlenecks, storage hotspots, etc. So, monitoring the health and availability of the supporting infrastructure is paramount to ensuring application performance success. Infrastructure monitoring should be in context of application monitoring and ideally should be integrated into an APM solution.
Why is APM Gaining Popularity?
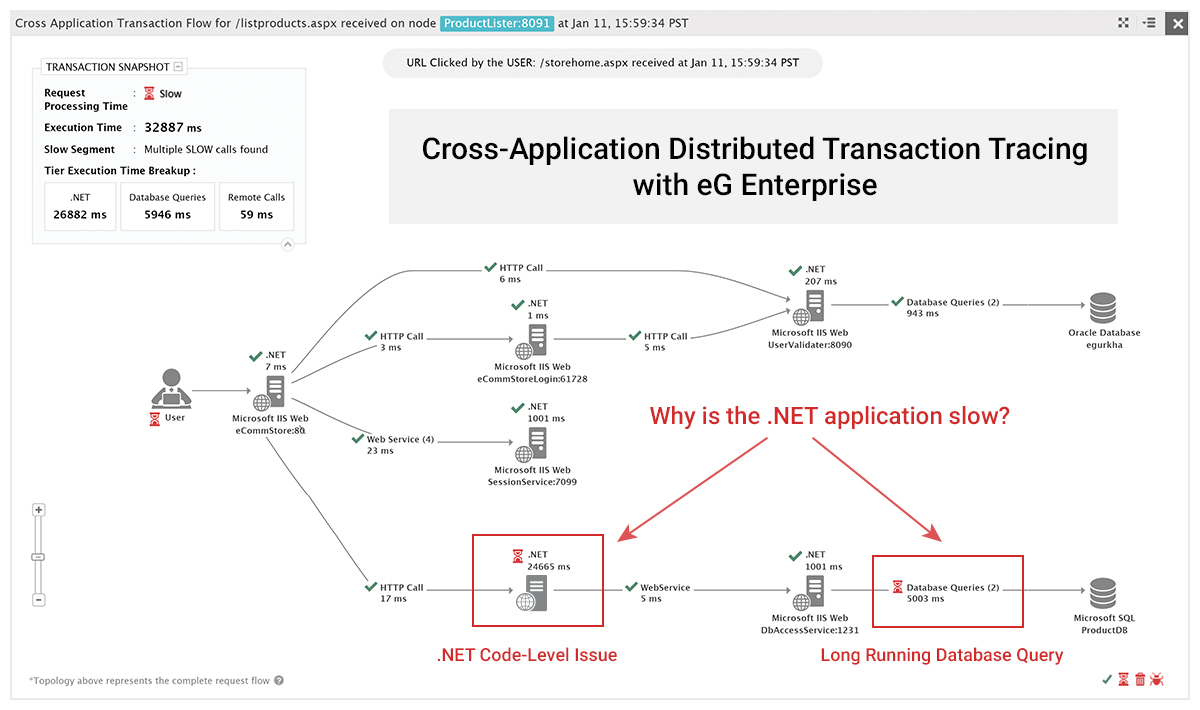
Of all the APM capabilities defined above, transaction profiling is the one that is the most important. The reason is that transaction profiling helps pinpoint the time spent in each application tier. This helps precisely pinpoint the cause of slowness. If the problem is in the application stack, transaction profiling can tell you where it is – is it in the application code, which method or line or code, or is it due to an SQL query, or is it due to an external/third-party service used by the application? This information is critical for fast and rapid problem diagnosis and resolution.
With transaction profiling in place, an application owner can clearly identify which tier/domain is responsible for an issue. In this way, APM tools complement traditional silo tools. In a multi-domain environment, the cross-tier visibility that transaction profiling provides is vitally important. For transaction profiling to be successful, its overhead must be low – i.e., the scalability of the application should not be affected. Transaction profiling must be done in a way that does not require the application code to be re-written. This way, even off-the-shelf commercial applications can be profiled.
No More “It is Not Me” – Eliminate Finger Pointing
In the past, IT Operations teams have spent endless hours firefighting issues. Getting a single pane of glass visibility was difficult. The database administrator does not want the application owner to know how his/her database is functioning. In the same way, the application owner does not want to reveal details of his/her application to the network team and so on.
 As a result, each IT domain had their own monitoring tools and when application slowness occurs, it was very difficult to pinpoint where the problem lies. Transaction profiling is a boon for application owners. Without needing any special permissions from the different domain administrators, they can now track where time is being spent. This means, agents do not have to be deployed on the database servers, and even without this, application owners can still get insights into how well the database queries are being processed and they can provide evidence that application slowness is due to a database slowdown. This is an incredibly powerful capability and significantly helps enhance IT effectiveness and efficiency.
When it comes to application performance, another aspect to bear in mind is reproducibility. Often, problems happen in production systems and they cannot be reproduced in staging. IT administration teams are left wondering what caused the issue. And as the cause of the problem is not resolved, the same issue may recur.
Transaction profiling gives detailed insights from a production deployment that allows IT teams to determine the cause of application performance issues and resolve them easily and accurately.
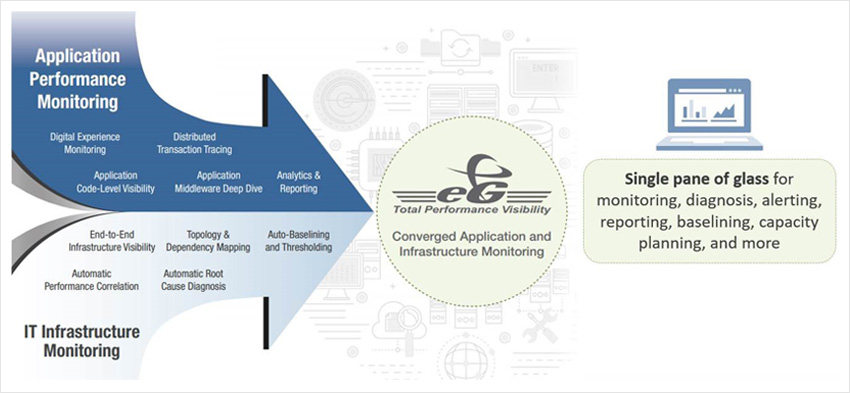
The Case for Converged Application and Infrastructure Performance Monitoring
At the same time, bear in mind that application slowdowns can also be caused by infrastructure issues. Failure of a disk drive of a RAID, overcommitment of virtualized resources, cloud platform issues, etc., can all cause an application to become slow. Transaction profiling or broader APM capabilities cannot provide sufficient information to troubleshoot such issues. This is where a converged approach to application and infrastructure monitoring becomes necessary.
Over the last couple of years, infrastructure vendors, such as Datadog, SolarWinds, Splunk, and others have included application performance monitoring capabilities in their toolsets while APM vendors, such as New Relic have been adding infrastructure monitoring capabilities.
- The same agent that monitors the infrastructure also monitors the application stacks.
- Color-coded service topology views provide insights into infrastructure performance while drilldowns provide application performance insights.
- Automated troubleshooting is enabled by a patented root-cause diagnosis engine that considers all forms of dependencies: application-to-application, application-to-VM, VM-to-physical machine, etc.
eG Enterprise is an Observability solution for Modern IT. Monitor digital workspaces,
web applications, SaaS services, cloud and containers from a single pane of glass.