
You’re not selling used cars
Some years ago, I was a middle manager attending my company’s annual kickoff. It began as so many all-hands meetings do about all that we accomplished the year before, followed by industry trends and a distant 10-year vision for our company. The finance team then closed the meeting by presenting a revenue forecast based on a model that accounted for seasonal trends, inflation, the number of salespeople we planned to hire, and the impact of marketing spend on revenue. At the end of the presentation we were provided with a final revenue number we were all told to work towards and then encouraged to work with our leaders on our OKRs, because, after all, our bonuses depended on this.
But here’s the rub – we were a software company that made more money the more customers used our platform. Yet I couldn’t understand how my activities were relevant to the company strategy. As a member of the product team, I couldn’t influence seasonal trends or economic tailwinds like inflation. It seemed strange to me that hiring more salespeople would generate more sales indefinitely. After all, wouldn’t we eventually run out of potential customers to sell to if we didn’t build new features to increase our total addressable market? Similarly, though we had a marketing plan that allowed us to get more than a dollar back for every dollar we spent, I realized that at some point it wasn’t going to work anymore. Our revenue model sounded like it could have applied to a used car business – but we were a software company! We needed an effective SaaS revenue forecast method, taking tech trends into account.
The truth is that the work we did in product development did matter, but much of our impact was guesswork. Our organization did not have a way to correlate behaviors on our platform as leading indicators that drove lagging indicators to the business, such as revenue. Perhaps this sounds like a familiar story to you, too. In the absence of this, the business built a model that was generally applicable to most businesses, but it didn’t capture how new features introduced on our platform improved the business. Product development teams love to celebrate the fact that they make data-driven decisions, but are you measuring the right things that are driving the right decisions?
“Product development teams love to celebrate the fact that they make data-driven decisions, but are you measuring the right things that are driving the right decisions?”
If you find yourself relating to this tale of corporate woe, there is hope! In this article, we’ll provide a brief primer on business forecasting models, zero in on causal forecasting methods that incorporate product development, and then conclude with a few examples showing the benefits of data-driven decision-making to inspire you to action.
Business Forecasting Models
Forecasting, the business activity of projecting future revenues and expenses, is a critical activity that nearly all growing technology companies do. Without some sense of what will happen in months and quarters ahead, decisions about how to invest in the business become guesswork. While it may seem daunting to foretell the future, forecasting approaches are surprisingly simple, in large part because it is not meant to be a precision activity. At best it sets expectations for the investors and employees of the company regarding what they can expect for their contribution to the company within a margin of error.
Historical vs. Causal Forecasting Method
There are two types of financial forecasting methods commonly used by companies. One approach, historical forecasting, involves analyzing patterns and trends from historical data to make predictions about future results. This forecasting method assumes that the future will be similar to the past in terms of events and trends. On the other hand, causal forecasting method looks at the cause-and-effect relationships between variables to make predictions. This forecasting method assumes that changes in one variable will affect another variable in a predictable way. For software companies, a causal forecasting method is a formula that equates to revenue or net income (if the company is profitable).
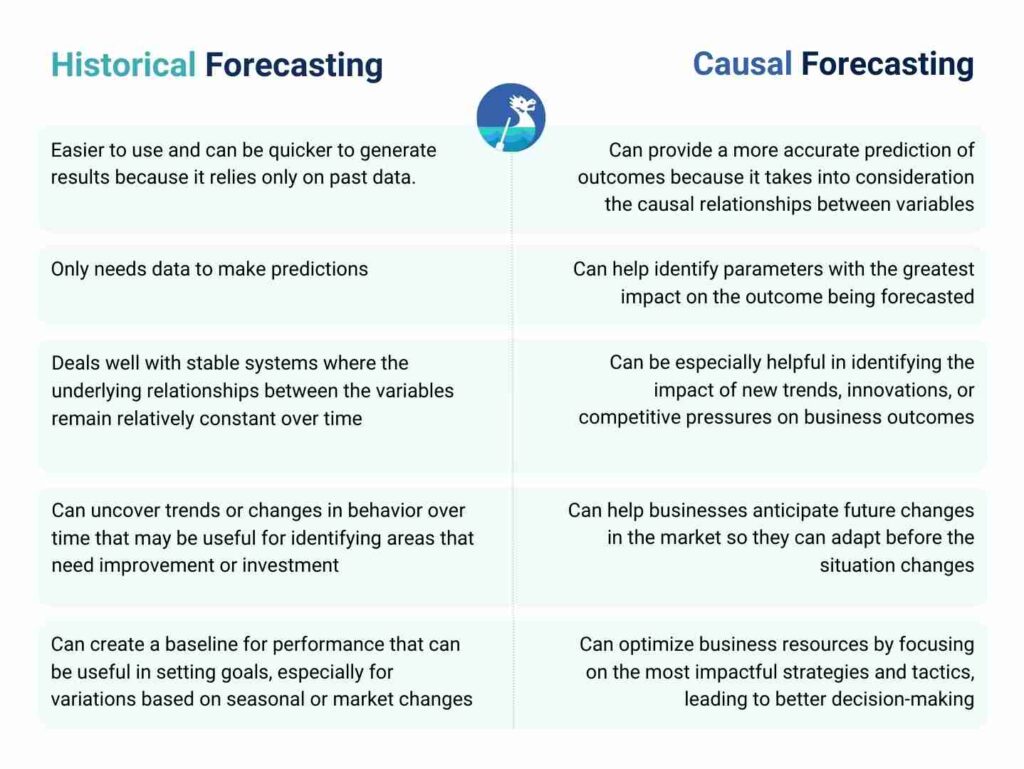
For many organizations, a historical forecasting method is appealing for the following reasons:
- Historical forecasting is often easier to use and can be quicker to generate results because it relies only on past data.
- Historical forecasting only needs data to make predictions, while causal forecasting requires a deep understanding of the relationships between the parameters of the formula.
- Historical forecasting deals well with stable systems where the underlying relationships between the variables remain relatively constant over time.
- Historical forecasting can help uncover trends or changes in behavior over time that may be useful for identifying areas that need improvement or investment.
- Historical sales forecasting can be helpful in creating a baseline for performance that can be useful in setting goals, especially for variations based on seasonal or market changes.
However, a historical forecasting method is almost always the wrong approach for the technological industry because changes in our industry happen frequently, and past success is no guarantee for future returns.
According to a study conducted by Small Business Trends in 2019, only 50% of start-ups survive their first four years in business. Furthermore, the World Economic Forum also stated in a report that around 90% of start-ups fail within their first year of operation. This highlights the high-risk nature of running a software start-up and just how short of a time horizon most start-ups operate. The story isn’t much better if you’re an established company. According to a report published by the Statistic Brain Research Institute in 2016, the failure rate for all U.S. technology companies after 10 years was 71%.
Our field is incredibly dynamic, so if your company relies heavily on historical forecasting approaches, advocate for a causal forecasting approach instead. A causal forecasting method addresses these shortcomings in the following ways:
- Causal forecasting can provide a more accurate prediction of future outcomes because it takes into consideration the causal relationships between variables.
- Causal forecasting can help identify which parameters have the greatest impact on the outcome being forecasted, which can be helpful in making decisions of where to focus efforts to maximize results.
- Causal forecasting can be especially helpful in identifying the impact of new trends, innovations, or competitive pressures on business outcomes.
- Causal forecasting can help businesses anticipate potential future changes in the market or environment, giving them an opportunity to adapt before the situation changes.
- Causal forecasting can help businesses optimize their resources by focusing on the most impactful strategies and tactics, leading to better decision-making and potentially better financial performance.
Causal Forecasting Method Examples
Example 1: Using a Causal Forecasting Method for Simple E-Commerce
To help you wrap your head around what a causal forecasting method looks like for a simple e-commerce business, consider the following:
Net Income = (Number of Visitors * Conversion Rate * Average Cart Value) – Fixed Costs – Variable Costs
Where:
- Number of Visitors = The total number of visitors to the e-commerce website
- Conversion Rate = The percentage of visitors that make a purchase on the website
- Average Cart Value = The average value of purchases made by customers in one transaction
- Fixed Costs = The fixed expenses associated with running the e-commerce business, such as rent, salaries, and insurance
- Variable Costs = The variable expenses associated with each sale, such as product costs, shipping costs, and payment processing fees
Having the business described in a formula is useful; it highlights the parameters of the business within the team’s control that are possible to predict, such as fixed costs, and which parameters the team can influence. In this case, there’s a role for product development to play with conversion rate and average cart value.
For example, a product team with an idea for a feature that could improve the conversion rate by 20% can use this prediction as part of a pitch to justify the potential revenue impact of their invention. Rather than having teams be goaled on revenue, we now have an opportunity to create a game for our team where we decide if we’re winning or losing by keeping track of conversion rate. In my experience, when teams understand what score they can influence, they naturally develop the strategy to come up with game-winning tactics!
Example 2: Using Causal Forecasting Method for Advertising E-Commerce
Causal forecasting methods are unique to each business, and there are many models one could surmise. Another potential model for an e-commerce site that doesn’t have a shopping cart and generates most of its traffic from advertising could be:
Net Income = (Product Page Views * Conversion Rate * Average Order Value) – (Cost of Goods Sold + Marketing Expenses)
Where:
- Product Page Views = Number of times the product pages are viewed by visitors
- Conversion Rate = Percentage of product views that result in a purchase
- Average Order Value = Average amount spent by a customer per order
- Cost of Goods Sold = Cost incurred in producing and delivering the products sold
- Marketing Expenses = Cost incurred in advertising and promoting the e-commerce site and its products
Instead of factoring in visitors, this model assumes that higher product page views, conversion rates, and average order values lead to increased sales and revenue for the e-commerce site.
Note that the details of the models may change the behavior of your team. In this case, a focus on product page views versus all site visits will encourage your team to think through ways to encourage people to view products and not just focus on increasing visitors. Furthermore, what you choose to add to your model may require some thought. Different people visiting the e-commerce site may inherently have different conversion rates, so the model may not work if there aren’t guardrails around what types of users are considered valid visits.
World-Class Product Teams and Their Success Stories
To motivate your causal forecasting journey, which is a keystone to developing a strong product operations muscle, here are three examples of world-class product teams who have used this approach to great success; true data-driven decision making examples using causal financial forecasting modeling.
Amazon
Components of the causal model: Amazon’s causal model includes factors such as product selection, pricing, customer ratings, customer reviews, and shipping options.
- Metric improved: Conversion rate
- Feature introduced: Amazon’s “Buy Box” algorithm, which uses machine learning to determine the optimal seller and price for a product, improving the likelihood of a purchase.
- Revenue impact: By improving conversion rates, Amazon has been able to increase its sales
Netflix
Components of the causal model: Netflix’s causal model includes factors such as subscriber growth, content library, content cost, user experience, and engagement metrics.
- Metric improved: User retention rate
- Feature introduced: Netflix’s recommendation algorithm, which leverages machine learning and user data to recommend content personalized to each user’s preferences.
- Revenue impact: By improving user retention, Netflix has been able to sustain growth in its subscriber base, which is a key driver of its revenue growth.
Salesforce
Components of the causal model: Salesforce’s causal model includes factors such as lead generation, lead conversion rates, sales team performance, customer satisfaction metrics, and competitive landscape.
- Metric improved: Sales team performance
- Feature introduced: Salesforce’s “Einstein Analytics” platform, which uses machine learning and data analysis to provide insights into sales team performance and identify areas for improvement.
- Revenue impact: By improving sales team performance, Salesforce has been able to increase its revenue growth and customer satisfaction metrics.
Wrapping up
For software companies, forecasting with dynamic causal modeling that incorporates product development can provide a more accurate and actionable prediction of future outcomes. It can help identify the parameters that have the greatest impact on business outcomes and allow teams to focus on where to make the greatest impact. The causal models will not be the same for all businesses and will need to be tailored to your specific industry and business model. By looking at examples of world-class product teams, you can see how they have leveraged causal forecasts to achieve success. So if you want to start making data-driven decisions that drive real business results, it’s time to embrace causal forecasting.


