This site uses cookies to improve your experience. To help us insure we adhere to various privacy regulations, please select your country/region of residence. If you do not select a country, we will assume you are from the United States. Select your Cookie Settings or view our Privacy Policy and Terms of Use.
Cookie Settings
Cookies and similar technologies are used on this website for proper function of the website, for tracking performance analytics and for marketing purposes. We and some of our third-party providers may use cookie data for various purposes. Please review the cookie settings below and choose your preference.
Used for the proper function of the website
Used for monitoring website traffic and interactions
Cookie Settings
Cookies and similar technologies are used on this website for proper function of the website, for tracking performance analytics and for marketing purposes. We and some of our third-party providers may use cookie data for various purposes. Please review the cookie settings below and choose your preference.
Strictly Necessary: Used for the proper function of the website
Performance/Analytics: Used for monitoring website traffic and interactions
Consider companies that have revolutionized industries. Did Amazon optimize around static KPIs, or did they constantly experiment with business models that defied expectations? By the time youve optimized for a particular KPI, your competition may already be moving on to the next opportunity.
Excellent Product Taste: You love creating beautiful, delightful user experiences and staying current with trends in the SaaS and AI industries. Prarthana Reddy Candidates short profile Prarthana has over 8 years of experience in the tech industry, with 6+ years as a product manager in both B2B and B2C environments.
On the contrary, there are too many ways to conduct a root cause analysis depending on your industry, business model, and even company size (think of Six Sigma in manufacturing, total quality management, DMAIC, etc.). In the same way, you can start from your business KPI and then break it down into sensitive metrics you can act on.
Subscribe and join the 28K+ customer service professionals who receive industry news, tips, and career guidance directly on their LinkedIn feed. Because CX Score is great for reviewing trends, we use it to measure week-over-week performance for both Fin and as a team wide KPI for human support. Our new CX Score is the perfect example.
Learn about the importance of mobile app KPI dashboards and copy dashboards from real mobile app product managers, engineers and designers. A key performance indicator (KPI) dashboard is a visual representation of data that quantifies how well a team is performing towards its goals. How do I create a mobile app KPI dashboard?
Do you need some behavioral KPI examples to understand what metrics to track and why? Behavioral key performance indicators (KPIs) can help you understand user experience and measure feature adoption. TL;DR Behavioral KPIs refer to metrics that track and measure customer behavior and engagement with your products or services.
A close look at key performance indicators (KPIs) and the impact they have on the efficacy of User Experience (UX). A great understanding about how KPIs can inform your UX research on both a qualitative and quantitative level. The post How to assess the efficacy of UX: KPI methods appeared first on TryMyUI Blog.
And if I’m measuring on a specific outcome, let’s say like user growth, and an executive is measuring on a different ruler motivated by a different KPI or incentive structure, it’s really hard to reconcile those things because you’re measuring things differently. It’s an issue because you always measure yourself on your own ruler.
Centralize KPI Reporting. The OKR approach doesn’t work without product KPI’s, and product KPI’s don’t work without measurements. Recently some executives questioned why one product KPI, that I track in my report, was moving very slowly. When I started at my company we had some product telemetry in place. Better Products.
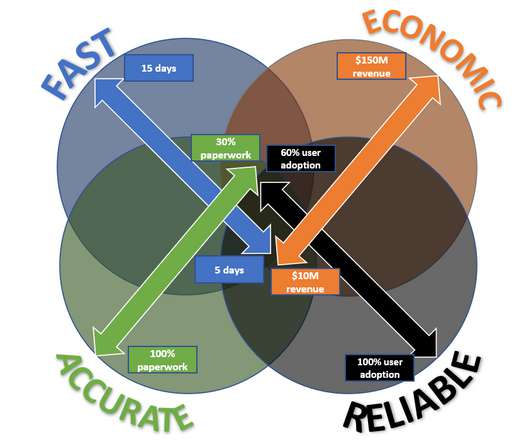
KPI-1 : Cycle time reduction. Let’s define the next set of KPIs. KPI 2 : # Insurance Carriers using the solution? —?Hypothesis: Hypothesis: 2 in year 1, 10 in year 2, 20 in year 3, 50 in year 4 KPI 3 : Annual Revenue? —?Hypothesis: Fast We hypothesized that the solution could reduce cycle time by up to 15 days.
What are KPIs? KPI stands for key performance indicators , and they are a way for you to understand the performance against the key results that you have set. Let's tap into our examples again and look at how we might understand performance with a KPI example added: Real-world example: Objective: Reduce body fat %.
With the right Growth KPI in place for active usage, you make a tangible impact on the business when you improve the number. Making that a Growth KPI would have shown a dip in your operation fairly early on, signaling a need for some changes. Step one is to define the Growth KPI in your analytics tool.
When I first started to work at Intercom as a Customer Support Representative (CSR), KPIs were completely foreign to me. I had previously worked in the television and film industry, where there was an entirely different metric – either I delivered high quality work on time or I didn’t, and I was out. What KPIs should you track?
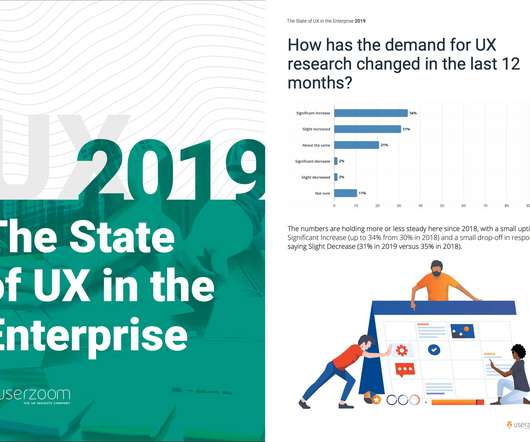
As we wrap up another thrilling and fast-paced year in the life of the experience industry, it’s time to take a quick breath, take stock of how far we’ve come and think about what’s in store for 2020. With growing demand for ‘better UX’ across all industries, there will be higher demand for UX leaders. Download the library.
The reality was, though, that Covid had impacted marketing budgets across all industries, most of the time in a drastic way. In the end, we had great momentum on the deal size, but if we considered revenues as our KPI, we were at a standstill. During this time, we were able to get eyeballs and interest. It wasn’t helping them much.
Go beyond NPS as a core KPI. Net Promoter Score, or NPS, has become the industry standard for gauging customer loyalty. The technical skills our respondents possess increased from there, with 25 percent of respondents reporting strong technical skills (i.e. likely starting as an engineer and moving into mobile product management).
Gainsight was fortunate enough to “be in the room” at Industry , one of Product Managers’ largest conferences. Three Major Takeaways from Industry. Alignment is key—KPI alignment, executive alignment, and cross-functional alignment are critical for success. Build for customer needs versus making product fit customer.
But with the onset of the COVID-19 pandemic that disrupted entire industries, forced many of us into working remotely, and brought about unprecedented digital transformation, the last two years have been particularly demanding. We don’t hold onto these stressful targets just because they’re industry standards.
For example, in the airline industry, we have upgrades for frequent travelers, or in the hospitality industry, we have upgraded hotel rooms or upgrade them to premium for car rentals. For example, in the Airline industry, we can Add a hotel or rent a car at the checkout instead of booking them separately.
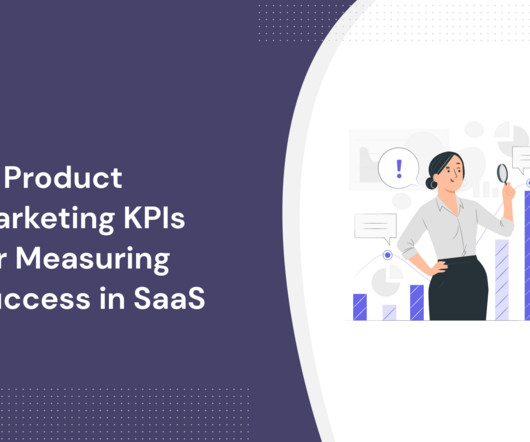
Go ahead and skip directly to the product marketing KPIs list or continue to read if you’re just starting out and looking to understand more about what product marketing is first. What is a Product Marketing KPI metric? Product Marketing KPIs vs Product Marketing OKRs. What is a Product Marketing KPI metric?
However, KPIs identify more specific goals that can be adjusted based on performance. For example, you might identify patterns in your attrition rates (metric), indicating whether or not your intention to increase customer satisfaction rates for the quarter (KPI) is on track. Conversations per agent.
But the industry is undergoing a fundamental transformation. Historically, business users have been presented with dashboards that describe the current state of a KPI, i.e. Net Profitability, Customer Retention, and more. Why do you think AI is such an important topic right now in the BI and analytics industry? How does it work?
If you’re unsure of what a decent customer retention rate is for your product, you should start by looking at industry averages. However, you shouldn’t always compare your performance to that of the industry standard. 10 Customer retention KPIs and metrics to measure retention. Retention KPI #4 DAU to MAU rate.
To collect the data to measure this KPI, you need to define what activities make up an “aha moment.” You can use this KPI to identify places where you may need to set user expectations during your onboarding process. Breadth of adoption shows the initial appeal of a new feature.
KPI tracking – Easily track KPIs, create dashboards, and visualize your analysis. Automated “Smart alerts” reduce manual tracking for new releases and KPI trends. As mentioned above, the Customer Analytics industry is expected to grow rapidly over the next several years. How long does it take them to come back?
Having trouble deciding which customer service KPI to use? There are some vanity metrics among the KPIs for customer service. So let’s look at the most important KPIs that will help you create strategies to provide superior customer service and boost retention. Customer service KPI #1 Customer Satisfaction Score.
But for those of us in the tech industry, this hits home. We see mounting evidence of a generation of disillusioned employees in the technology industry coming to terms with this dichotomy. Uncanny Valley , the memoir of a young professional trying to find meaningful work in the tech industry, became a New York Times Bestseller.
However, our suggestion is to avoid sticking blindly to frameworks that have been around for decades and don’t really reflect the reality of the SaaS industry. analyzing the industry, defining the target market, segmenting the customers Product design Building the product? Sure, every product goes through four stages?—?introduction,
Or that an OKR is the same as a KPI. UX Designers are sometimes also known as Product Designers (especially in the Silicon Valley tech industry), and they are primarily responsible for designing apps/software that solve a problem or provide a service. That’s a big mistake! What Does Good Design Look Like?
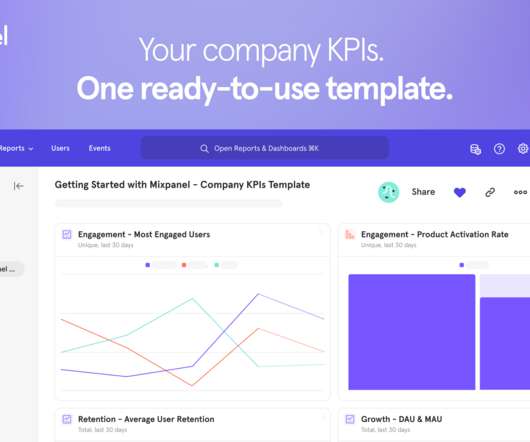
In just four clicks, users go from a blank slate to nine comprehensive and customizable reports that are relevant across companies in different products and industries. While ad hoc analysis can be terrific for answering one-off questions, the Company KPI Dashboard illustrates the value of looking at your metrics holistically.
Retention is a metric that measures how many users return to your product over a period of time and considered to be one of the most important KPIs when trying to analyze the product health or potential, it is a key indicator for growth and impacts almost every key business metric (e.g. What are the standards that are common in your industry?
We wanted to know: what are the industry standards for support teams? If you’re focusing on time to close as your primary support KPI, it could inadvertently encourage your support reps to prioritize the fastest, easiest short-term solve – not necessarily the one with the greatest long-term result for the customer. Who reviews?
Over the past year at LinkedIn I developed a strong appreciation for using Net Promoter Score (NPS) as a key performance indicator (KPI) to understand customer loyalty. The Origin of NPS. Net Promoter Score (NPS) is a measure of your customer's loyalty, devised by Fred Reichheld at Bain & Company in 2003.
As companies usually have many different KPIs, maintaining or growing customer retention is a key KPI that each business commonly shares. You might also be interested in Mobile app KPI dashboard examples and how to use them What is customer retention and why is it so important? What are industry retention rates?
With the right Growth KPI in place for active usage, you make a tangible impact on the business when you improve the number. Making that a Growth KPI would have shown a dip in your operation fairly early on, signaling a need for some changes. Step one is to define the Growth KPI in your analytics tool. How to get started.
We’re one of Europe’s leading online fashion platforms and in the past few years we’ve moved from a more traditional “internal IT setup” to a product-driven culture that develops industry-leading bespoke enterprise solutions. We created multi-disciplinary teams that own specific business KPIs, together with their internal users.
Classical music is a very niche industry—it’s easy to get PR for new products and services; we were featured in a lot of online and offline publications, so the initial spike of users came in pretty fast. The post Metrics that matter to Primephonic: the KPI that drives product roadmap prioritization appeared first on Mixpanel.
Classical music is a very niche industry—it’s easy to get PR for new products and services; we were featured in a lot of online and offline publications, so the initial spike of users came in pretty fast. The post Metrics that matter to Primephonic: the KPI that drives product roadmap prioritization appeared first on Mixpanel.
Leading industry online publications talk about marketing OKRs in general, looking at the acquisition stage of the journey only. OKRs are different from KPIs because a KPI is strictly a metric that reflects performance. There are two main performance frameworks in product marketing – OKRs and KPIs.
preset quarterly goals or strategic need to focus on a new KPI) A broader change in your industry and/or prototypical customer’s life (e.g. To do this, you should consider sharing: Data from preceding experiments/features that make a case for this feature A business imperative that is internal to your own company (e.g.
For us a market interaction is any interaction such as an industry event, a meeting with a partner or a client, or prospect engagement (with or without sales). Some screenshot extracts of the survey are shown below: If it’s not written up, it doesn’t count towards your KPI. Get People out of the Office.
There’ve been a few situations where Alexis and I have simultaneously contacted somebody within our department who’s responsible for a specific KPI because the Mixpanel app allows us to be synchronized. Mixpanel: What’s different about tracking metrics in this industry compared to other companies that you’ve worked at?
In addition to looking at the specific individual, it's often helpful to assess are there specific industries where your product is most valuable? You may find over time that the metrics you're currently using don't do a good job of capturing customer value, so expect to iterate on your KPI hypotheses as much as any other.
A business user simply selects a KPI of interest, and machine learning algorithms run automatically across all data points that are related to generate the key reasons “why” a KPI is trending upward or downward. With Birst Smart Analytics announced today, we do just that.
We organize all of the trending information in your field so you don't have to. Join 96,000+ users and stay up to date on the latest articles your peers are reading.
You know about us, now we want to get to know you!
Let's personalize your content
Let's get even more personalized
We recognize your account from another site in our network, please click 'Send Email' below to continue with verifying your account and setting a password.


Let's personalize your content