User Activity Patterns: How to Identify Them For SaaS
Tracking user activity patterns helps you understand users better and uncover insights to increase product engagement.
This article shows you practical steps to accomplish this task. You will also find the best tools for the job and learn about key behavior metrics to monitor for tracking user patterns.
TL;DR
- User activity patterns are the trends and recurring behaviors users exhibit when interacting with a website or app.
- Activity patterns identify contexts in user behavior, helping you make informed decisions to improve user experience.
Benefits of tracking user behavior data:
- Understand current usage patterns.
- Increase product stickiness.
- Identify and remove friction.
- Create data-driven product strategies.
- Reduce customer churn.
Metrics that help measure user behavioral patterns
- Activation rate.
- Product/Feature adoption rate.
- Click rate.
- Drop-off rate.
- Average session duration.
- Product retention rate.
7 types of reports to help measure user engagement patterns:
- Trend analysis.
- Funnel analysis.
- Path analysis.
- Cohort analysis.
- Feature and events reports.
- A/B testing.
- Heatmaps.
A step-by-step process for analyzing user behavior trends:
- Identify the user persona you wish to track.
- Chart out their user journey map.
- Collect data from multiple sources to identify patterns.
- Supplement collected data with user feedback.
- Act on the users’ behavior insights to increase satisfaction.
3 tools for tracking user behavior patterns:
- Userpilot – Best for in-depth user behavior analysis.
- Hotjar – Best for qualitative analysis.
- Amplitude – Best for tracking mobile app usage patterns.
Ready to start tracking user behavioral analytics for your tool? Book a demo and see how Userpilot’s in-depth product analytics and feedback features can help you gain data-driven insights.
![]()
Try Userpilot and Take Your Product Engagement to the Next Level

What are user activity patterns?
User activity patterns are the trends and recurring behaviors multiple users exhibit when interacting with your website or app.
These behavior patterns offer insights into user preferences and their experience across the customer journey. Product teams use this data to improve user experience with their app.
Benefits of tracking user behavior data for SaaS
Here’s a look at the key benefits of monitoring user actions and tracking how existing customers interact with different features:
- Understand current usage patterns: Tracking user behavior allows you to stay updated with changing user preferences so you can serve your target audience better.
- Increase product stickiness: When you know how people use your product and what they value most, you can tailor features and enhancements to motivate long-term engagement.
- Identify and remove friction: By understanding how users interact with different aspects of your tool, you can spot issues such as confusing navigation, slow loading speeds, or even bugs in your app. Eliminating these friction points creates a smoother, more delightful user experience.
- Create data-driven product strategies: Instead of relying on assumptions, user behavior data provides concrete evidence of how existing customers engage with your product. This allows you to make informed decisions about the overall product direction.
- Reduce customer churn: Identifying the points in your product where users drop off allows you to proactively address issues that lead to churn.
Metrics that help measure user behavior trends
Regularly track the following metrics to spot shifts in behavior easily:
- Activation rate is the percentage of new users that complete a vital engagement milestone and experience the core value of your product.
- Product/feature adoption rate measures how many users incorporate your product or a specific feature into their workflows, engaging with it regularly.
- Click rate is the percentage of users who click on a specific element of your website or app (links, buttons, and the like). A good example is tracking feature usage by monitoring clicks to a module.
- Drop-off rate calculates the percentage of users who leave a process or flow before completing it, such as exiting during onboarding or abandoning the account renewal process mid-way.
- Average session duration tracks the average length of a user’s engagement with your app. Longer session durations suggest a higher level of interest and satisfaction.
- Product retention rate shows the percentage of users who remain active and engaged over a specific period.
7 types of reports to help measure user engagement patterns
The metrics above can help indicate an increase or decrease in user interest. On the other hand, behavior reports help you understand and interpret user behavior patterns.
Here are seven types of reports to explore.
1. Trend analysis
Trend analysis tracks how specific metrics change over time, such as daily active users, session duration, or user engagement within your app.
This allows you to identify trends in user behavior and analyze them to investigate their reasons.
For example, let’s say you find that users are increasingly buying and engaging with a specific add-on.
That’s a sign that it’s valuable to them. Based on this insight, you can segment similar users and market the add-on to them, delivering more value and boosting your revenue.

2. Funnel analysis
Track funnel progression across all user journey stages with the funnel analysis report, and monitor friction points. You can do this for any funnel in your app, such as the free-to-paid conversion funnel or the account expansion funnel.
By understanding where users get lost, you can optimize your conversion funnels to improve their experience and increase conversion rates.
Case in point: Imagine you perform a funnel analysis and find many new users dropping off before adding team members to their accounts. Based on the data, you could hypothesize that they’re having trouble finding the appropriate button for the action.
To remedy this, you deploy hotspots or tooltips to guide them and increase the percentage of users who complete that important step. This improves funnel progression and reduces friction for new users.

3. Path analysis
Unlike funnel analysis, which focuses on a set sequence of steps, path analysis explores all the paths users navigate, offering a more organic view of user behavior.
While there are many uses of this report, a prominent one is identifying paths power users take to complete tasks and improve product adoption rates.
Power users are your most engaged and loyal users. The paths they choose to complete actions are often the paths of least resistance. In the world of SaaS, we refer to these as happy paths, and they’re integral to driving product success.
For example, you can find the fastest way users move from free trial to paying customers. What features do they engage with? What actions do power users take? These invaluable insights can help product teams create in-app engagement flows to encourage new users’ behavior down the same path.

4. Cohort analysis
Cohort analysis groups users based on shared characteristics or behaviors, such as sign-up date, company profile, or acquisition channel, and tracks their behavior over time.
This approach lets you observe user behavior patterns such as retention rates for specific segments, monitor shifts in engagement over the user lifecycle, and evaluate the effects of specific events or updates on different groups.

5. Feature and events reports
Tracking feature usage and popular events helps you understand what users value most about your app.
Generate these reports to identify your popular and least used features. For the popular ones, check to see why users love them and find ways to make the experience even better.
You can also consider sunsetting some of your least-used features. This is usually a good call when feature adoption is low despite your best in-app marketing efforts.

6. A/B testing
A/B testing helps you compare two or more UX variations to understand which version resonates more with users.
You can run either a controlled A/B test or a head-to-head test (or a combination of both), depending on your needs.
Controlled tests compare a variable (e.g., an in-app onboarding flow or a landing page design) against a control group (usually the current version) to assess the impact of a specific change.
Head-to-head A/B testing, on the other hand, involves directly comparing two different versions without a designated control group. Here, both variables are new, and you test them against each other to see which performs better.
For example, it’s a head-to-head A/B test when you experiment with two new UI placements for a feature release announcement.

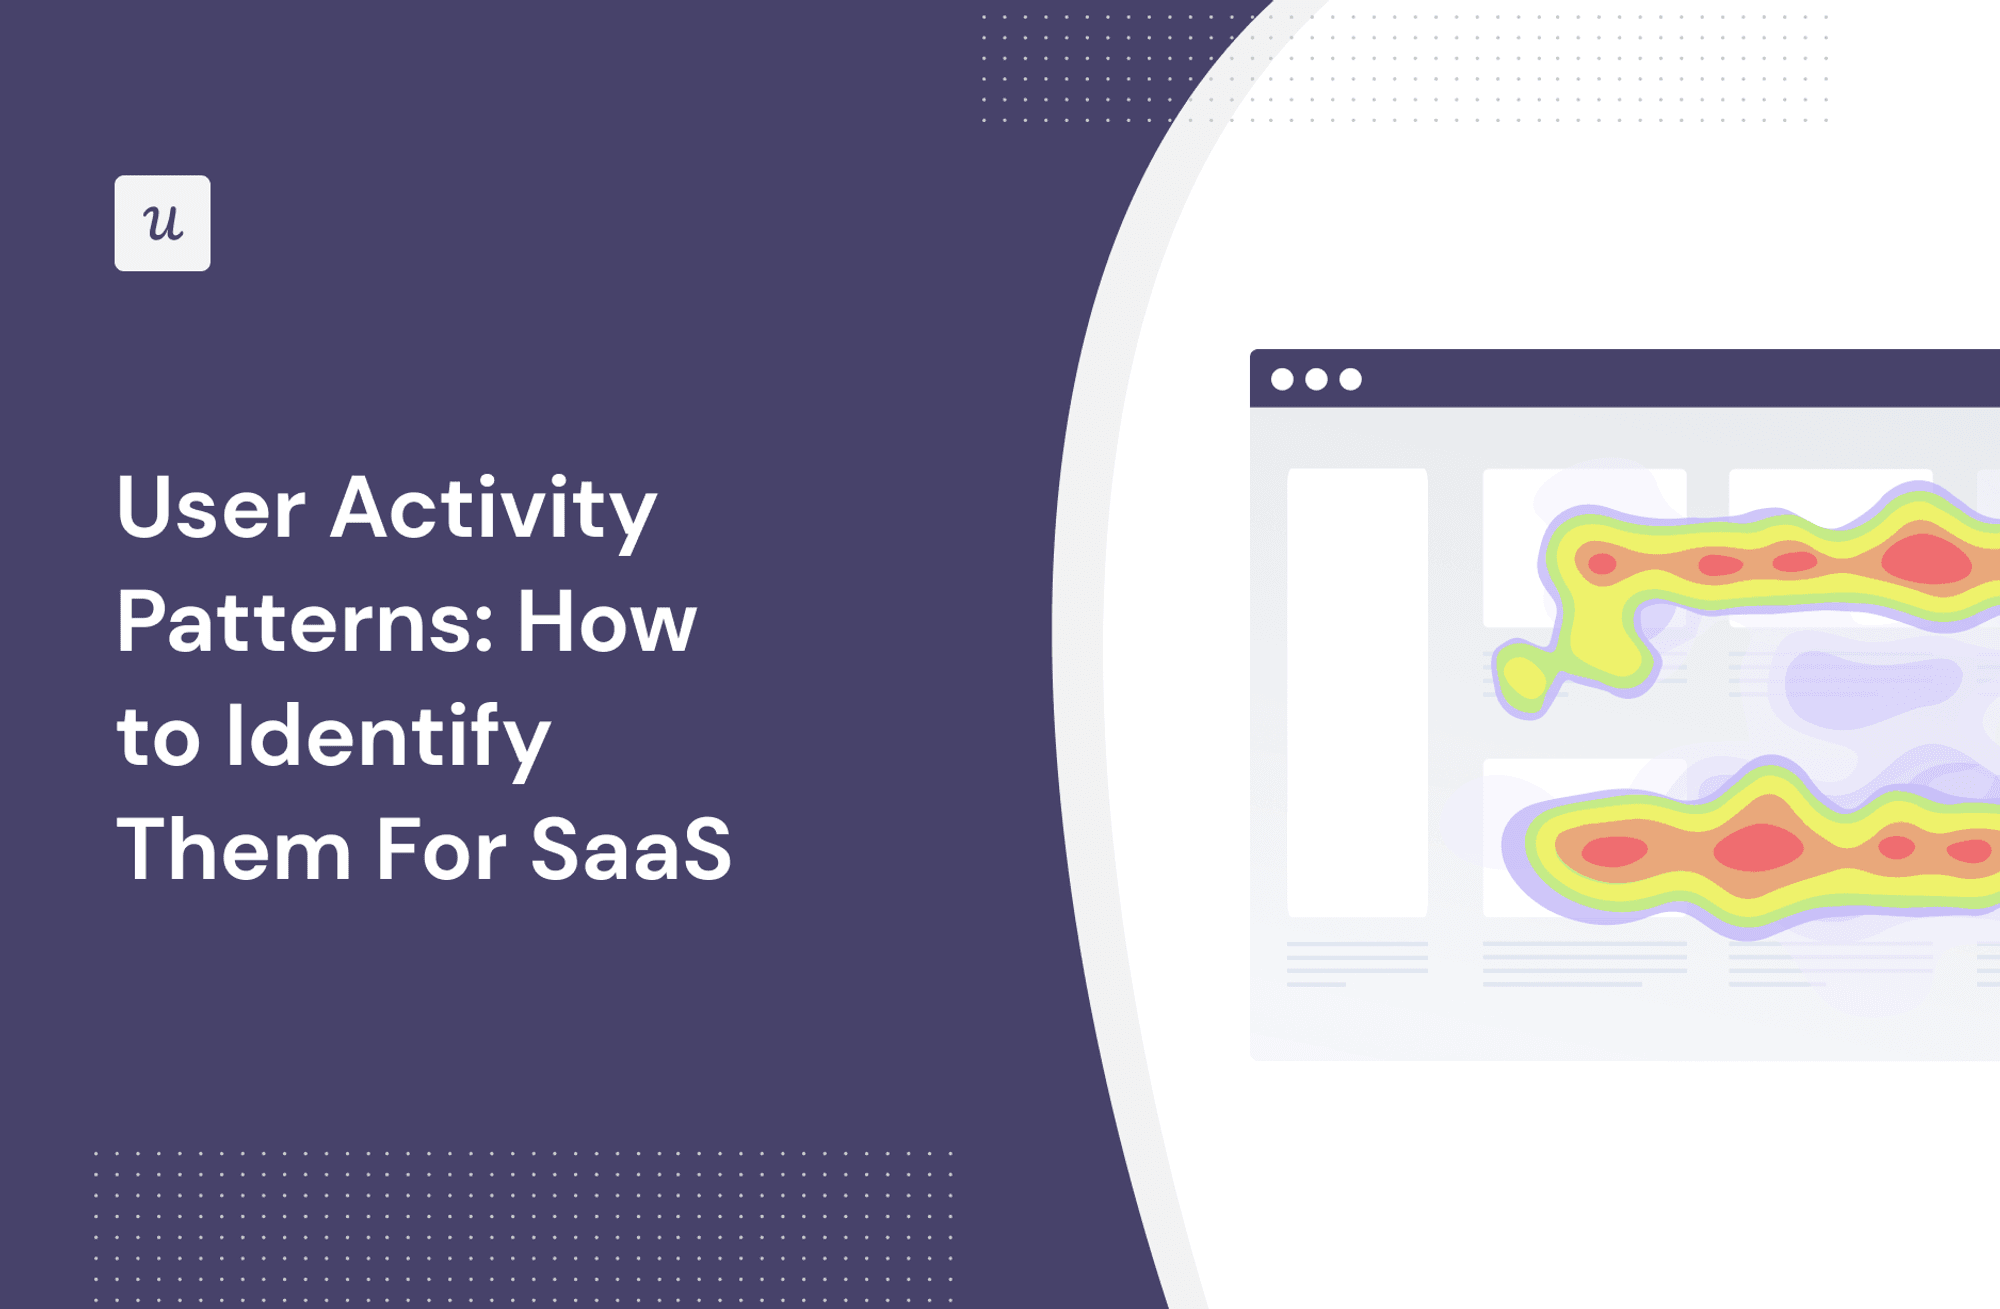
7. Heatmaps
Heatmaps offer a deep dive into user interaction patterns by giving visual reports of user clicks, hovers, and other mouse movements. They are ideal for identifying what users love and dislike about your tool.
Below are the different heatmap types and the kind of user activity patterns they measure:
- Feature click heatmaps: Track where users click in your app. This includes clicks on buttons, links, images, and other interactive elements, revealing the information users seek.
- Scroll heatmaps: Show how far down a page users scroll and where they spend the most time.
- Mouse-tracking heatmaps: Visualize the movement of a user’s mouse across the screen—revealing areas of interest and indecision even if users don’t click.
- Eye-tracking heatmaps: Offer the most direct insight into user attention, showing which areas draw immediate focus and how the user’s visual attention is distributed across a page.

The step-by-step process for analyzing user behavior trends
Follow these steps to collect, analyze, and act on user data to improve your product experience.
1. Identify the user persona you wish to track
Begin by defining the user persona(s) for your analysis.
This first step is important because no two user groups behave the same way: they have different needs, engage with varying features, and typically come to your tool with different end goals.
Once you’ve decided on the user persona(s) to target, it’s time to highlight key information about them. Include details on their demographics, pain points, motivations, and goals.
Below is an example you can use as a template:

2. Chart out the user journey map
User journey maps help you visualize the steps users go through as they engage with your product, from initial awareness to the ultimate goal or conversion.
When drafting the journey map, ensure it covers all the stages users go through.
Define the actions users take at each stage, along with their needs and the emotions they feel across each touchpoint.
Such level of detail allows you to dig deep into user motivation and preferences. It then becomes easy to understand the reasons behind different user activity patterns.

3. Collect data from multiple sources to identify patterns
Gather user data from various reports (such as the ones we covered in the previous section). This helps you gain a comprehensive view of user behavior across different aspects of your tool.
Let’s say you want to analyze and understand user activity patterns on your free trial to paid conversion funnel.
You can combine funnel analysis with path analysis. That way, you’ll see a breakdown of not only who moves to what stage but also the paths they follow and what actions yield the best conversions.
When analyzing data from multiple sources, use an analytics dashboard like the example below to view all key reports in one place.

4. Supplement collected data with user feedback
User feedback helps you validate report findings and identify the why behind user activity trends.
Examine the data from your reports and determine the best ways to frame your questions. Then, deploy open-ended and closed-ended surveys to gather user feedback in-app.
Compare the answers with the reports you’re observing and try to note the correlations.

5. Act on user behavior insights to increase satisfaction
Finally, use the insights from your analysis to implement changes aimed at improving user satisfaction.
For example, say the user activity data shows your users are more interested in using your knowledge base to find answers than chatting with support.
That’s your sign to focus on optimizing your knowledge base, making it more content-rich, and improving the information search sessions.

3 tools for tracking user activity patterns
The tools in this section make it easy to track user activity patterns and collect useful insights.
Let’s go over them and identify features that help track user behavior.
1. Userpilot – Best for in-depth user behavior analysis
Userpilot is a product growth platform with powerful user behavior analytics.
The platform lets you track customer journeys and create in-app experiences to improve your overall product experience.
Here’s how Userpilot helps you understand user activity patterns:
- Analytics reports: Track trends, funnels, cohorts, and user path analysis without needing to code. This helps you uncover data to extract invaluable insights regarding user behavior.
- Feature usage reports: Curious about how users interact with your important features? Use feature usage reports to find trends in feature usage.
- Analytics dashboard: View all important reports in one place. Access various analytics dashboards, such as product usage, core feature engagement, and user retention dashboards, depending on your needs. Userpilot also allows you to create custom dashboards to view reports of your choice in one place.

- Heatmaps: Spot features with high and low engagements based on the most UI interactions.
- Session recordings: Get granular behavior insights by watching session replays to learn how customers interact with your app. This feature is coming soon to Userpilot.
- Surveys: Trigger quantitative and qualitative in-app surveys to get direct feedback and understand the reasons behind user behaviors.
- Customer segmentation: Track feature usage and behavioral data for each of your different personas to gain valuable insights and improve your personalization strategy.
2. Hotjar – Best for qualitative analysis
Hotjar is a comprehensive tool designed for website analytics and user surveys.
Here’s how Hotjar helps you understand user behavioral data:
- Heatmaps and session recording: Get a visual understanding of how users interact with your website. These help identify popular tasks so you can understand what to prioritize.
- Hotjar AI: Hotjar’s new AI feature helps users create feedback surveys in seconds. The AI can also analyze user responses and provide real-time summaries.
- Funnels: Identify drop-offs and track how users progress through different journey stages.
- Always-on feedback widget: Collect contextual feedback as visitors interact with your website.

3. Amplitude – Best for tracking mobile app usage patterns
Amplitude is a product analytics platform that provides in-depth insights into user activity patterns across websites and apps. It particularly stands out for its ability to track the behavior of users accessing your app from mobile phones.
How Amplitude helps you understand user activity patterns:
- Event tracking: Track virtually every user action within your product. Analyze the report to understand why users behave in certain ways.
- Cohort analysis: Group users by shared attributes and analyze behavior patterns within specific subsets of your customer base to get granular insights.
- Product impact analysis: Measure the effectiveness of new features or changes to your product by comparing user behavior before and after implementation.

Conclusion
User needs and motivations change as they progress through the customer journey. By tracking the data generated, you can spot behavioral shifts and deploy interventions where necessary.
Ready to start tracking user activity patterns for your tool? Book a demo and see how Userpilot’s in-depth analytics and feedback features can help.
Try Userpilot and Take Your Product Engagement to the Next Level

