


In A/B testing, there are two main ways of interpreting test results: Frequentist vs Bayesian.
These terms refer to two different inferential statistical methods. Debates over which is ‘better’ are fierce – and at AB Tasty, we know which method we’ve come to prefer.
If you’re shopping for an A/B testing vendor, new to A/B testing or just trying to better interpret your experiment’s results, it’s important to understand the logic behind each method. This will help you make better business decisions and/or choose the best experimentation platform.
In this article, we discuss these two statistical methods under the inferential statistics umbrella, compare and contrast their strong points and explain our preferred method of measurement.
What is inferential statistics?
Both Frequentist and Bayesian methods are under the umbrella of inferential statistics.
As opposed to descriptive statistics (which describes purely past events), inferential statistics try to infer or forecast future events.
Would version A or version B have a better impact on X KPI?
Side note: If we want to geek out, technically inferential statistics isn’t really forecasting in a temporal sense, but extrapolating what will happen when we apply results to a larger pool of participants.
What happens if we apply winning version B to my entire website audience? There’s a notion of ‘future’ events in that we need to actually implement version B tomorrow, but in the strictest sense, we’re not using statistics to ‘predict the future.’
For example, let’s say you were really into Olympic sports, and you wanted to learn more about the men’s swimming team. Specifically, how tall are they? Using descriptive statistics, you could determine some interesting facts about ‘the sample’ (aka the team):
- The average height of the sample
- The spread of the sample (variance)
- How many people are below or above the average
- Etc.
This might fit your immediate needs, but the scope is pretty limited.
What inferential statistics allows you to do is to infer conclusions about samples that are too big to study in a descriptive way.
If you were interested in knowing the average height of all men on the planet, it wouldn’t be possible to go and collect all that data. Instead, you can use inferential statistics to infer that average from different, smaller samples.
Two ways of inferring this kind of information through statistical analysis are the Frequentist and Bayesian methods.
What is the Frequentist statistics method in A/B testing?
The Frequentist approach is perhaps more familiar to you since it’s more frequently used by A/B testing software (pardon the pun). This method also makes an appearance in college-level stats classes.
This approach is designed to make a decision about a unique experiment.
With the Frequentist approach, you start with the hypothesis that there is no difference between test versions A and B. And at the end of your experiment, you’ll end up with something called a P-Value (probability value).
The P-Value is the probability of obtaining results at least as extreme as the observed results assuming that there is no (real) difference between the experiments.
In practice, the P-Value is interpreted to mean: the probability that there is no difference between your two versions. (That’s why it is often “inverted” with the basic formula p = 1-pValue, in order to express the probability that there is a difference.)
The smaller the P-Value, the higher the chance that there is, in fact, a difference, and also that your hypothesis is wrong.
Frequentist pros:
- Frequentist models are available in any statistic library for any programming language.
- The computation of frequentist tests is blazing fast.
Frequentist cons:
- You only estimate the P-Value at the end of a test, not during. ‘Data peeking’ before a test has ended generates misleading results because it actually becomes several experiments (one experiment each time you peek at the data), whereas the test is designed for one unique experiment.
- You can’t know the actual gain interval of a winning variation – just that it won.
What is the Bayesian statistics method in A/B testing?
The Bayesian approach looks at things a little differently.
We can trace it back to a charming British mathematician, Thomas Bayes, and his eponymous Bayes’ Theorem.

The Bayesian approach allows for the inclusion of prior information (‘a prior’) into your current analysis. The method involves three overlapping concepts:
- Prior – information you have from a previous experiment. At the beginning of the experiment, we use a ‘non-informative’ prior (think ’empty’)
- Evidences – the data of the current experiment
- Posterior – the updated information you have from the prior and the evidences. This is what is produced by the Bayesian analysis.
By design, this test can be used for an ongoing experiment. When data peeking, the ‘peeked at data’ can be seen as a prior, and the future incoming data will be the evidence, and so on.
This means ‘data peeking’ naturally fits in the test design. So at each ‘data peeking,’ the posterior computed by the Bayesian analysis is valid.
Crucially for A/B testing in a business setting, the Bayesian approach allows the CRO practitioner to estimate the gain of a winning variation – more on that later.
Bayesian pros:
- Allows you to ‘peek’ at the data during a test, so you can either stop sending traffic if a variation is tanking or switch earlier to a clear winner.
- Allows you to see the actual gain of a winning test.
- By its nature, often rules out the implementation of false positives.
Bayesian cons:
- Needs a sampling loop, which takes a non-negligible CPU load. This is not a concern at the user level, but could potentially gum things up at scale.
Bayesian vs Frequentist: which is better?
So, which method is the ‘better’ method?
Let’s start with the caveat that both are perfectly legitimate statistical methods. But at AB Tasty, our customer experience optimization and feature management software, we have a clear preference for the Bayesian a/b testing approach. Why?
Gain size
One very strong reason is because with Bayesian statistics, you can estimate a range of the actual gain of a winning variation, instead of only knowing that it was the winner, full stop.
In a business setting, this distinction is crucial. When you’re running your A/B test, you’re really deciding whether to switch from variation A to variation B, not whether you choose A or B from a blank slate. You therefore need to consider:
- The implementation cost of switching to variation B (time, resources, budget)
- Additional associated costs of variation B (vendor costs, licenses…)
As an example, let’s say you’re a B2B software vendor, and you ran an A/B test on your pricing page. Variation B included a chatbot, whereas version A didn’t. Variation B outperformed variation A, but to implement variation B, you’ll need 2 weeks of developer time to integrate your chatbot into your lead workflow, plus allocate X dollars of marketing budget to pay for the monthly chatbot license.
You need to be sure the math adds up, and that it’s more cost-effective to switch to version B when these costs are weighed against the size of the test gain. A Bayesian A/B testing approach will let you do that.
Let’s take a look at an example from the AB Tasty reporting dashboard.
In this fictional test, we’re measuring three variations against an original, with ‘CTA clicks’ as our KPI.
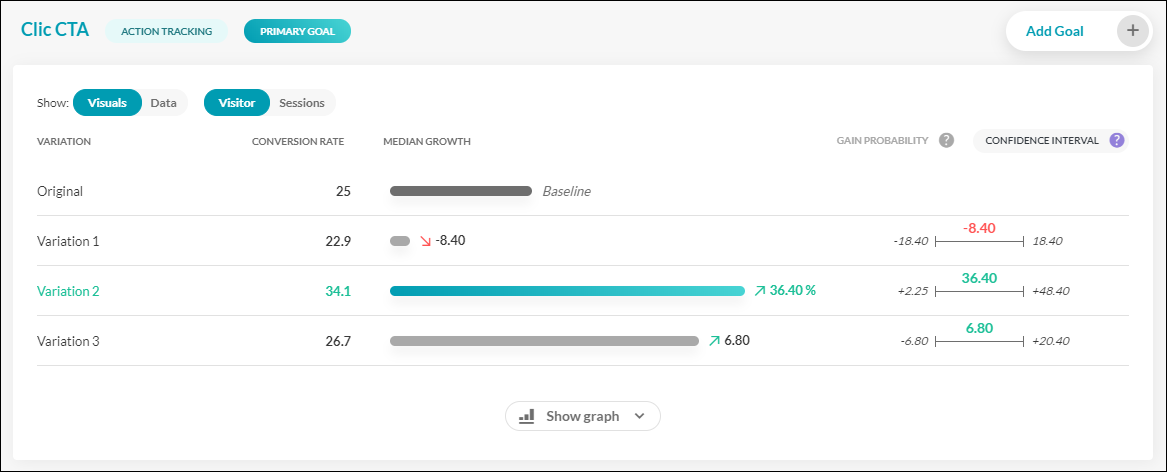
We can see that variation 2 looks like the clear winner, with a conversion rate of 34.5%, compared to the original of 25%. But by looking to the right, we also get the confidence interval of this gain. In other words, a best and worst-case scenario.
The median gain for version 2 is 36.4%, with the lowest possible gain being +2.25% and the highest being 48.40%
These are the lowest and the highest gain markers you can achieve in 95% of cases.
If we break it down even further:
- There’s a 50% chance of the gain percentage lying above 36.4% (the median)
- There’s a 50% chance of it lying below 36.4%.
- In 95% of cases, the gain will lie between +2.25% and +48.40%.
- There remains a 2.5% chance of the gain lying below 2.25% (our famous false positive) and a 2.5% chance of it lying above 48.40%.
This level of granularity can help you decide whether to roll out a winning test variation across your site.
Are both the lowest and highest ends of your gain markers positive? Great!
Is the interval small, i.e. you’re quite sure of this high positive gain? It’s probably the right decision to implement the winning version.
Is your interval wide but implementation costs are low? No harm in going ahead there, too.
However, if your interval is large and the cost of implementation is significant, it’s probably best to wait until you have more data to shrink that interval. At AB Tasty we generally recommend that you:
- Wait until you have recorded at least 5,000 unique visitors per variation
- Let the test run for at least 14 days (two business cycles)
- Wait until you have reached 300 conversions on the main goal.
Data peeking
Another advantage of Bayesian statistics is that it’s ok for you to ‘peek’ at your data’s results during a test (but be sure not to overdo it…).
Let’s say you’re working for a giant e-commerce platform and you’re running an A/B test involving a new promotional offer. If you notice that version B is performing abysmally – losing you big money – you can stop it immediately!
Conversely, if your test is outperforming, you can switch all of your website traffic to the winning version earlier than if you were relying on the Frequentist method.
This is precisely the logic behind our Dynamic Traffic Allocation feature – and it wouldn’t be possible without Mr. Thomas Bayes.
Dynamic Traffic Allocation
If we pause quickly on the topic of Dynamic Traffic Allocation, we’ll see that it’s particularly useful in business settings or contexts that are volatile or time-limited.
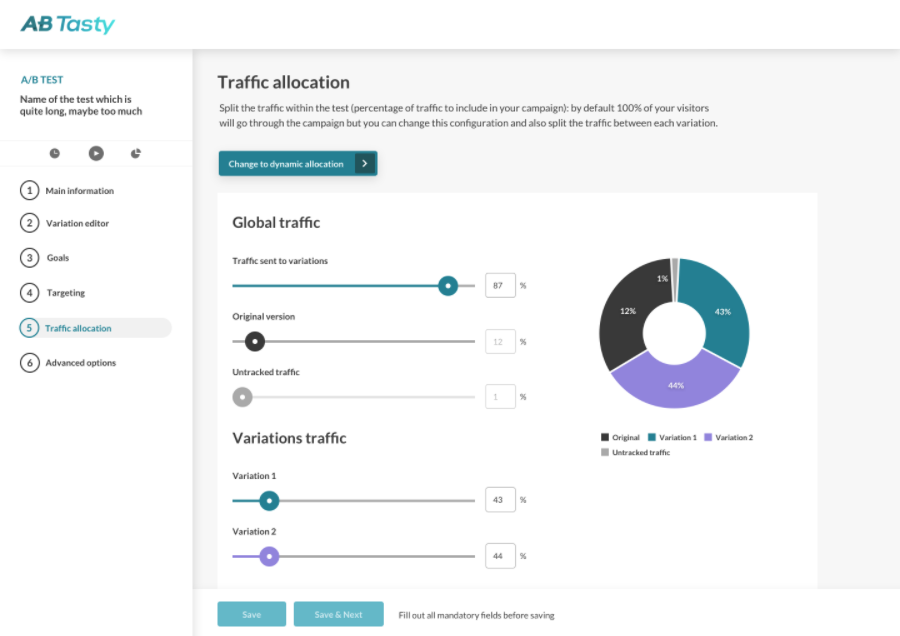
Dynamic Traffic Allocation option in the AB Tasty Interface.
Essentially, (automated) Dynamic Traffic Allocation strikes the balance between data exploitation and exploration.
The test data is ‘explored’ rigorously enough to be confident in the conclusion, and ‘exploited’ early enough so as to not lose out on conversions (or whatever your primary KPI is) unnecessarily. Note that this isn’t manual – a real live person is not interpreting these results and deciding to go or not to go.
Instead, an algorithm is going to make the choice for you, automatically.
In practice, for AB Tasty clients, this means checking the associated box and picking your primary KPI. The platform’s algorithm will then make the determination of if or when to send the majority of your traffic to a winning variation, once it’s determined.
This kind of approach is particularly useful:
- Optimizing micro-conversions over a short time period
- When the time span of the test is short (for example, during a holiday sales promotion)
- When your target page doesn’t get a lot of traffic
- When you’re testing 6+ variations
Though you’ll want to pick and choose when to go for this option, it’s certainly a handy one to have in your back pocket.
Want to start A/B testing on your website with a platform that leverages the Bayesian method? AB Tasty is a great example of an A/B testing tool that allows you to quickly set up tests with low code implementation of front-end or UX changes on your web pages, gather insights via an ROI dashboard, and determine which route will increase your revenue.

False Positives
In Bayesian statistics, like with Frequentist methods, there is a risk of what’s called a false positive.
A false positive, as you might guess, is when a test result indicates a variation shows an improvement when in reality it doesn’t.
It’s often the case with false positives that version B gives the same results as version A (not that it performs inadequately compared to version A).
While by no means innocuous, false positives certainly aren’t a reason to abandon A/B testing. Instead, you can adjust your confidence interval to fit the risk associated with a potential false positive.
Gain probability using Bayesian statistics
You’ve probably heard of the 95% gain probability rule of thumb.
In other words, you consider that your test is statistically significant when you’ve reached a 95% certainty level. You’re 95% sure your version B is performing as indicated, but there’s still a 5% risk that it isn’t.
For many marketing campaigns, this 95% threshold is probably sufficient. But if you’re running a particularly important campaign with a lot at stake, you can adjust your gain probability threshold to be even more exact – 97%, 98% or even 99%, practically ruling out the potential for a false positive.
While this seems like a safe bet – and it is the right choice for high-stakes campaigns – it’s not something to apply across the board.
This is because:
- In order to attain this higher threshold, you’ll have to wait longer for results, therefore leaving you less time to reap the rewards of a positive outcome.
- You will implicitly only get a winner with a bigger gain (which is rarer), and you will let go of smaller improvements that still could be impactful.
- If you have a smaller amount of traffic on your web page, you may want to consider a different approach
Bayesian tests limit false positives
Another thing to keep in mind is that because the Bayesian approach provides a gain interval – and because false positives virtually only appear to perform slightly better than in reality – you’re unlikely to implement a false positive in the first place.
A common scenario would be that you run an A/B test to test whether a new promotional banner design increases CTA click-through rates.
Your result says version B performs better with a 95% gain probability but that the gain is minuscule (1% median improvement). Were this to be a false positive, you’re unlikely to deploy the version B promotional banner across your website, since the resources needed to implement it wouldn’t make it worth the minimum again.
But, since a Frequentist approach doesn’t provide the gain interval, you might be more tempted to put in place the false positive. While this wouldn’t be the end of the world – version B likely performs the same as version A – you would be spending time and energy on a modification that won’t bring you any added return.
Bottom line? If you play it too safe and wait for a confidence level that’s too high, you’ll miss out on a series of smaller gains, which is also a mistake.
Wrapping up: Bayesian vs Frequentist
So, which is better, Frequentist or Bayesian?
As we mentioned early, both approaches are perfectly sound, statistical methods.
But at AB Tasty, we’ve opted for the Bayesian approach, since we think it helps our clients make even better business decisions on their web experiments.
It also allows for more flexibility and maximizing returns (Dynamic Traffic Allocation). As for false positives, these can occur whether you go with a Frequentist or Bayesian approach – though you’re less likely to fall for one with the Bayesian approach.
At the end of the day, if you’re shopping for an A/B testing platform, you’ll want to find one that gives you easily interpretable results that you can rely on.
