
October marks the start of the fourth quarter. In most software companies the process for developing their annual business plan comes to a head at this time. Past performance is assessed, research is conducted, and goals, strategies, and tactics for the new calendar year are developed. Product management should be an integral part of this process. It’s time for your product management report card.
What is a Product Management Report Card?
A product management report card is an assessment of how your organization performed in achieving its goals for the year. It provides a fact-based approach to understand what worked in the past year, what didn’t work, and what can be improved in the next year. It is an input to your overall product management retrospective.
There is no ‘standard’ product management report card. Each company has its own approach to product management. Tools for assessing product management performance in a startup will be different for those used to assess product management in a mature company that serves a late majority/laggard market. You need to tailor your product management report card to your market, position in the market, and your enterprise’s overall ability to execute.
There are dozens of product management metrics you could include in a product management report card. The needs of a company that follows the Lean Startup approach are very different than those that follow a Pragmatic Marketing approach. Most report cards focus on Key Performance Indicators (KPIs). Product management report cards should concentrate on core product management responsibilities – understanding market problems, translating the problems into themes, epic, and stories, prioritizing the work to be done, etc. It is also important to understand how product management’s work impacts other parts of the enterprise – marketing, sales, engineering, operations, support, finance, etc. The KPIs should focus on outcomes not just outputs.
Annual planning is one f the common ceremonies for software companies. Your report card should be based on the goals and objectives set in the prior year’s planning process.
To illustrate the concept, we have developed a sample product management report card. The company is a middle-aged enterprise software company that follows an Agie approach. The report card is divided into five sections. Each section has three to five KPIs. The report card shows the prior year’s performance, the goal for the current year, and a calculation of performance. This is not a prescription for what you should do – just an illustration of the concept.

Product Management Report Card Components
Overview
Like the report cards you received in school, product management report cards should look at several different topics. Multi factor analysis provides is a good technique for looking at product management performance. Product management report cards should focus on outcomes, not just outputs. Each topic covered by the report card should be a metric that reflects some type of outcome the enterprise wants to achieve.
Each product management report card should be structured to reflect the values of your enterprise. Startups have different values than enterprises in the late majority stage of the technology adoption life cycle. Some common sections of a product management report card include:
- Revenue. The overwhelming majority of software enterprises are for-profit enterprises. The mission of these companies is to grow Enterprise Value. Revenue is a key component of Enterprise Value.
- Customers. The number and behavior of customers is a key indicator of product management success or failure.
- Marketing. Product features and quality have a direct impact on the effectiveness of marketing programs.
- Backlog. In Agile enterprises, the backlog is one of product management’s core responsibilities. Understanding the dynamics of backlog is a key indicator of product management success.
- Customer Service. While product management is not responsible for customer service, the features implemented in the product and the quality of those features have a direct impact on the enterprise’s success.
Revenue
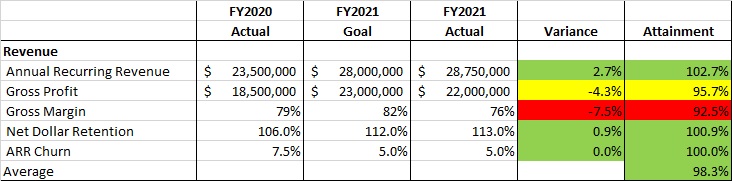
Revenue is a great tool to assess product management success or failure. Topline Annual Recurring Revenue is the primary metric to gauge a product’s success. If you need to brush up on your SaaS revenue basics, check out Product Managers Should Understand SaaS Revenue Basics. Gross profit is equal to revenues minus cost of revenue )COR) or cost of goods sold (COGS). Gross margin is equal to the percentage of gross profit versus revenue. Cost of Revenue includes items like sales commissions, royalties for embedded software, hosting costs, etc. Product managers’ decisions can directly impact non-sales compensation-related COGS items.
Net Dolar Retention is another key metric. Net Dollar Retention is Net Dollar Retention would include Revenue Renewal Amount plus Revenue from Upselling or Cross-selling to existing customers minus Churned Revenue (revenue lost when existing customers do not come back). High net dollar retention is a strong sign for a growth-based company, as achieving a high percentage growth year over year is difficult when the level of churn (lost customers) is high. Among public SaaS companies, 109% is the median.
ARR Churn or Annual Recurring Revenue churn is the percentage rate at which SaaS customers cancel their recurring revenue subscriptions. The decisions product managers make about features, defect correction, and adoption of customer enhancement requests directly impact ARR Churn.
Customers
Customers are obviously another key dimension of product management performance. A couple of common KPIs for customers include:
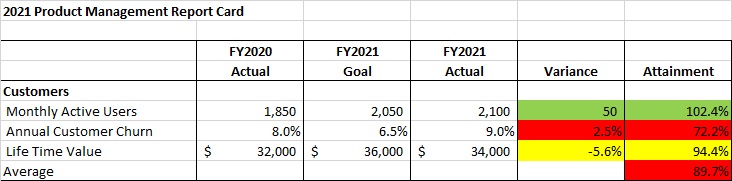
- Monthly Active Users (MAU) is a common metric to measure product stickiness. Daily Active Users( DAU) or Weekly Active Users (WAU) are also used.
- Annual Customer Churn is the number of customers that cancelled their use of your product in a specific time period. Monthly customer churn is also used often.
- Life Time Value (LTV) is a metric that describes the amount of gross profit a customer will contribute to your enterprise over the life of the customer. Some companies used total revenue instead of gross profit.
Marketing
Product managers are not responsible for marketing, but their product decisions do impact key marketing KPIs.
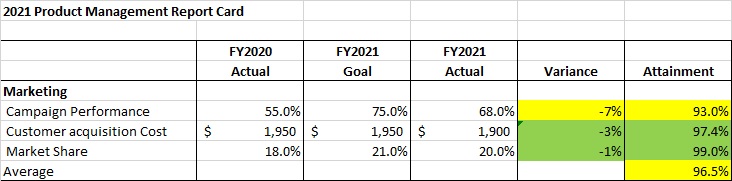
- Campaign Performance. Product features and capabilities have a major impact of marketing campaign performance. Great products aligned to market opportunities are easy to market. Poor products are hard. Understanding campaign performance gives product managers insights. There are many types of marketing campaigns — paid SEO, content marketing, social media advertising (Facebook, Instagram, LinkedIn, etc.), webinars, email marketing, etc. Some enterprises track KPIs based on campaign types, others track at a summary level.
- Customer Acquisition Cost. CAC is a metric that describes the efficiency of marketing spend. If you want to understand the details of typical SaaS marketing campaign CAC performance, check out The Ugly Truth of B2B SaaS Customer Acquisition Costs.
- Market Share is the percentage of your product’s target market your product is responsible for. Typically this is your product’s annual revenues divided by the total market size.
Backlog
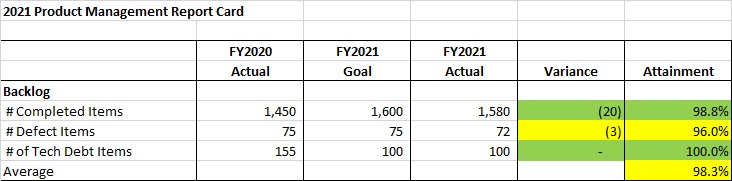
The backlog is a core product management deliverable. It is a prioritized list of deliverables (such as new features, non-functional requirements, or technical debt elimination) that should be implemented as part of a product. Some backlog KPIs include:
- # of Completed items. The number of product backlog items completed in a specific time period.
- # Defect Items. The number of product backlog items related to product defects.
- # of Tech Debt Items. The number of technical debt-related product backlog items.
Customer Service
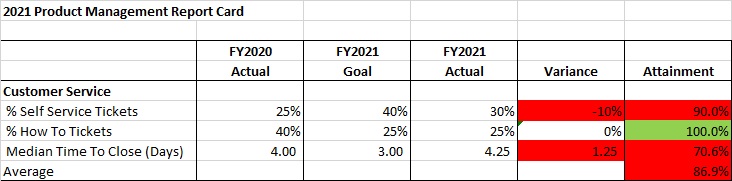
Like Marketing, product management is not responsible for customer service. But their product decisions do impact key marketing KPIs.
- % of Self Service Tickets. A key metric for customer service is customer self service. It drives higher productivity and enables CS to focus on customers with difficult issues. The quality and capabilities of a product can greatly enhance the ability for customer self service.
- % of How To Tickets. The most common type of customer service ticket is a ‘how-to’ ticket. The better designed a feature is and the better quality of documentation/help can dramatically reduce the percentage of how-to tickets.
- Median Time to Close. The elapsed time to close a ticket is directly related to customer satisfaction. The quality of the product and product management’s prioritization of defect resolution directly impacts the median time to close a ticket.
Summary Report Card
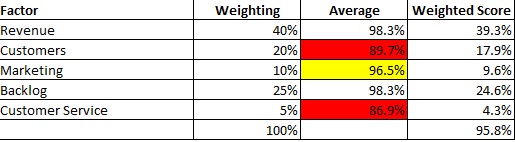
A summary product management report card should put all of the ‘grades’ in context. Not every metric is as important as another. You should establish weights for each factor that reflect the priorities if your enterprise. What is important to a late-stage company is going to be very different than what is important to a startup.
It is also important to have a consensus on the definition of each KPI or metric in the report card. As noted in Product Manager Metrics: Process is as Important as Formulas
“All parts of the organization that are impacted by a metric must share a common definition of what the metric is, how it will be calculated, and how the results will be interpreted. Marketing, Sales, and Finance may have different views on how LTV could be calculated, but these views have to be reconciled and one definition agreed to. Otherwise, the organization whose views were not addressed will ignore or dismiss the metric. The consequences of not taking corrective actions could be serious.”
Summary
October marks the start of the fourth quarter. In most software companies the process for developing their annual business plan comes to a head at this time. Past performance is assessed, research is conducted, and goals, strategies, and tactics for the new calendar year are developed. Product management report cards are a key part of this process. It’s time for your product management report card.
Also published on Medium.