


Observability: Something Old, Something New
Heaven knows we all could use some luck these days, and observability may be just the thing we need. But observability isn’t luck, and it isn’t really new either. A few people even know that observability is an aspect of control theory, which dates back to the 1800s! In this blog post, I’ll cover some of the history of observability vs. traditional monitoring paradigms, and particularly, how they apply to the new world of microservices and containerization technologies, such as Docker and Kubernetes (K8s).
Observability vs. Monitoring
Monitoring tells you when something is wrong while observability enables you to understand why. Monitoring is a subset of and a key facilitator for observability. You can only monitor a system that is observable.
Observability is a measure of how well you can understand your system’s internal states from its external outputs. Observability uses instrumentation to provide insights that assist monitoring.
Ismail Egilmez at Thundra wrote an excellent blog post last year covering some of the differences between monitoring and observability in which he highlighted how the very architecture of modern application architectures and deployments means monitoring alone is insufficient. He said:
“Modern distributed applications cannot be effectively monitored by legacy methods, which are based on handling predictable failures. With microservices architecture now the de facto standard for web applications, effective debugging and diagnostics require that the system be observable — that is, its internal state can be inferred by observing its output.”
Something Old
Internal/External Monitoring
When eG Innovations introduced eG Enterprise in 2000, we explained what we called ‘selective, external monitoring’ and ‘precise, internal monitoring’.
At the time, vendors that monitored things like response time (i.e., end user perspective) often had no capability to monitor anything else. So, you could tell that ‘the system was slow’ but could not find out WHY.
eG Innovations’ application of both external and internal performance monitoring used (and still uses) a combination of both approaches to enable proactive monitoring and optimization of digital ecosystems.

So, this ‘old’ approach is still in use today and is quite valid from an observability perspective.
Control Theory and Performance Monitoring
We did a webinar as part of a ‘shift-left’ series back in 2018 titled, “End-to-End Monitoring for ITSM and DevOps” and it had a section on monitoring, observability, and DevOps.
In it, we described how monitoring and control loops can be simple…

… Or complex!

The fact is digital business services have end-to-end and top-to-bottom dependencies.
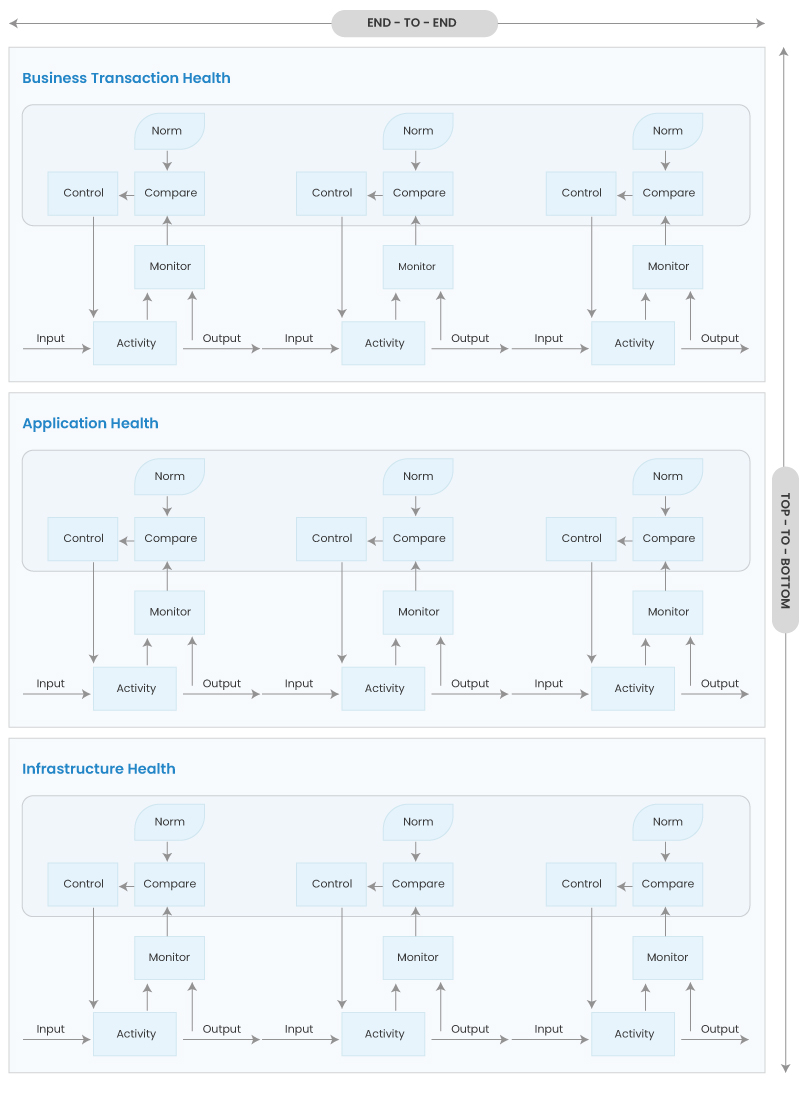
Deviations from normal behavior can ripple across these dependencies, and this is inclusive of applications and infrastructure regardless of the deployment model.
When monitoring is fragmented across different toolsets operating at infrastructure, application, and business transaction levels the result is not typically what I would call a very ‘observable’ system.
These layers are interdependent, and any user who asks, ‘why is my application slow?’ is likely to agree unless you can isolate (or prevent him or her from having to call in the first place!).
As an ITIL Expert, of course I used ITIL to illustrate my points in the webinar. In that example, Service Strategy defines the architecture and standards, and Service Design defines norms (along with monitoring and control mechanisms).
Disclaimer: For the ITIL evangelists among you, ITIL v4 has just been released and I’ve not had an opportunity to review it at the time of writing this blog post.

What’s interesting today is that back then I mentioned that “Monitoring and control loops are within an organizational context; design must bridge strategy and operations.”
The Three Pillars of Observability
Logs, metrics, and traces are often known as “the three pillars of observability”. Some have, however, extended this to four signal sources under the mnemonic MELT (Metrics, Events, Logs, Traces). Many traditional IT tools focus primarily on metrics, the measures that indicate an issue whereas it is often error logs and traces that source and identify the root cause of the issue.
Of course, collecting this data alone is insufficient and modern observability platforms, such as eG Enterprise use technologies such as Machine Learning and Statistical Correlation Analysis within an AIOps (Artificial Intelligence for IT Operations) engine. Root cause analysis and diagnosis via such technologies is key to modern products achieving observability. Key features to evaluate in AIOps platforms are listed here.
Something New
Converged Application Performance Monitoring (APM)/Infrastructure Performance Monitoring (IPM)
What’s ‘new’ is the rapid migration to cloud-native architectures, which leverage containers (i.e., Docker, Kubernetes, etc.), DevOps principles, and CI/CD pipelines. Indeed, the recent acceleration in uptake of K8s technologies has been fueled by a wealth of enterprise offerings, such as Amazon EKS, VMware Tanzu, and Microsoft’s Azure Kubernetes Service (AKS).
Whether it is internal systems or customer-facing web applications, the digital user experience drives business today. No single factor is more important. But when there is a performance slowdown, this is where the agreement ends, and the challenges begin. Without a truly unified and holistic view of all factors—across applications and the infrastructure—that affect the user experience, you are effectively flying blind.
But while enterprise operating models are changing, and applications controlled by technologies like Kubernetes have many similar characteristics of other N-tier ecosystems–the differences lie in the dynamicity of each tier with microservices being increasingly adopted and the short lifespan of a container making it necessary to track application tiers as a whole rather than individual containers. These differences pose interesting challenges for monitoring tools.
Docker
Whether you are using Docker for modern app development, microservices, CI/CD, digital transformation, DevOps, or edge computing, eG Enterprise provides unified performance visibility into Docker containers and the application servers, applications, and databases running on them:
- From a central console, get telemetry from across your container environment
- Understand resource usage and capacity needs to futureproof container provisioning
- Obtain code-level visibility of applications running inside Docker containers
- Get correlated insight to identify root cause of performance bottlenecks
- Automate monitoring in your auto-scaling Docker environment
Kubernetes
eG Enterprise is an enterprise-class, converged application and IT monitoring solution that provides unified performance visibility into the Kubernetes orchestration environment, the containers provisioned, and workloads running on them:
- From a central console, get telemetry from across your Kubernetes cluster, nodes, and pod deployments
- Understand resource usage and capacity needs to futureproof container provisioning
- Obtain code-level visibility of applications running inside the containers
- Get correlated insight to identify root cause of performance bottlenecks
- Automate monitoring in your auto-scaling Kubernetes environment
- Agnostically monitor the performance, availability, and billing of Kubernetes environments hosted on the cloud
What’s Old is New
The ability to leverage the same embedded analytics and layered user interface and include pre-built models for Docker and Kubernetes (along with the other 200+ out-of-the-box components) is both something old and something new.
Every migration starts from where you are today.
eG Innovations has helped customers answer the question, ‘why is my application slow?’ in the most performance sensitive and demanding customer environments for over two decades now. From digital workspaces to digital workloads running complex n-tier, distributed, and cloud-based ecosystems, eG Innovations has been pioneering unified performance management.
You could continue to swap out monitoring tools, but you don’t have to. eG Enterprise can unify your performance monitoring with personalized, role-based views regardless of where you are on your digital journey.
Observability requires total performance visibility; take a look at eG Enterprise today.
eG Enterprise is an Observability solution for Modern IT. Monitor digital workspaces,
web applications, SaaS services, cloud and containers from a single pane of glass.


