SaaS Product Success Metrics: The Ultimate Guide for 2023
Wondering what product success metrics you should use in 2023?
Measuring product success during the early stages of your SaaS business can help you spend wisely and reduce wasted energy.
Today, let’s find out how you can leverage product success metrics to add more value for your users and drive retention.
TL;DR
-
- Product success is the overall effectiveness of a product or service within the market.
- A successful product is not only a good product-market fit but also has high retention rates and customer engagement scores.
- Monthly Recurring Revenue is the expected revenue stream you can earn from all the active subscriptions each month.
- Customer Engagement Score measures the engagement level of free trial users and paying customers.
- Customer Lifetime Value is the predicted revenue generated from a user over the period they’re a paying customer.
- Net Promoter Score measures customer satisfaction and loyalty.
- Customer retention rate gives the percentage of customers you retain over a specific time period. On the flip side, the customer churn rate measures the percentage of customers you lose.
- Put insights into action! Want to start driving product success with personalized onboarding experiences, code-free? Get a Userpilot demo and we’ll show you how!
What is product success?
Product success is the overall effectiveness of a product or service within the market.
Companies use various metrics to measure product success and understand how their product is impacting their revenue, profitability, and brand image.
How to define a successful product in SaaS?
A successful SaaS product satisfies the customers in all possible ways. That is, the product:
- Is a good product-market fit. That means that your product is needed by people and is a solution to their problems and pain points.
- Keeps the customers engaged. If customers find value in your product and it’s easy for them to use, they become more engaged.
- Is repeatedly purchased by customers. Customer retention is another key driver for product success. If they are satisfied with your product, they will become loyal customers improving your retention rate.
- Has relatively high retention rates and low churn rates. On the flip side, if the retention rate is higher that means that you have a low churn rate. That’s great.
6 product success metrics to measure success
Without product success metrics, your teams wouldn’t have enough ways to learn how the different elements of your product perform. These metrics will give them an overview of your company’s growth and valuable data on customer interactions with your product.
The product success metrics you use depends on the type of product you have. Otherwise, you would get overwhelmed by the plethora of such metrics out there.
Let’s give an example. As Netflix is a video-streaming service, the ratio of daily active users (DAUs) to monthly active users (MAUs) is one of the most crucial metrics for the platform.
So, here are the 6 most important product success metrics for SaaS companies.
- Monthly Recurring Revenue
- Customer Engagement Score
- Customer Lifetime Value
- Net Promoter Score
- Customer Retention Rate
- Customer Churn Rate
Monthly Recurring Revenue
Since SaaS businesses are subscription-based, their growth depends on repeat purchases by customers. The higher the renewal rates, the more valuable your product is to customers.
Therefore, Monthly Recurring Revenue (MRR) is key to tracking your product’s success. MRR is the expected amount of revenue you can earn from all the active subscriptions each month.
MRR is equal to your average revenue per account (ARPU) multiplied by the number of accounts in one month.
This metric summarizes your entire revenue so that you can estimate the future profitability of your business.

How to increase your MRR
To improve your MRR, use contextual in-app messages to communicate with your users just when they need it. This way, you can guide and help them gain value down the different stages of their user journey.
You can use in-app messages to:
- Gather customer feedback on your product
- Use in-app guidance to direct customers on how to use your product and onboard them effectively
- Send notifications to customers about announcements and updates
- Boost account expansion and feature adoption.
Increasing account expansion is not only likely to raise your expansion MRR but also your MRR. The more users spend on your product via upsells, cross-sells, and add-ons, the higher your expansion MRR will be.
As users upgrade to higher-paid plans, they would also renew their subscriptions, which would cause your MRR to rise. Increasing your MRR would also improve net revenue retention.
You can use in-app triggers to send contextual alerts to the right users at the right time.
For instance, when customers search for the message history in Slack and reach the workplace limit, a pop-up message lets them know they’ve arrived at the end of 1,000 most recent messages.
It essentially tells users they can access older messages by upgrading to one of their paid plans.

Customer Engagement Score
Your customers won’t stay with you for long if they don’t find your product engaging. Thus, the Customer Engagement Score (CES) is another key product success metric.
The CES measures how engaged your free trial prospects and existing customers are. Every customer’s engagement level is represented by a score depending on inaction or action.
To measure the customer engagement score, you have to account for multiple events that users need to accomplish to highlight their engagement.
These engagement events include:
- Key features customers engage with (or don’t)
- Percentage of renewals and upgrades
- Product usage frequency
- The specific actions that different customers take inside your product
- The number of support tickets opened by users.
These may not be the only events you need, based on the type of your product. Moreover, they will differ in importance from one SaaS business to another.
Next, you need to assign a score to each of the key events, on a scale of 1-10, based on their importance to the user persona and your product.
For example, for a social media scheduling tool, scheduling posts is more important than A/B testing post hashtags. Thus, you may use a score of 10 for scheduling successfully and 2 for A/B testing hashtags.
Then track the number of times an event has taken place over a particular period. To find the total event value, multiply the assigned score by the frequency of usage in the last x days.
Finally, to calculate the customer engagement score, add the total event value for all the key events.

How to improve customer engagement score
To improve your CES, personalize your onboarding process with in-app marketing.
Segmentation is critical to personalized onboarding. By segmenting your users based on their persona and use cases, you can personalize the product experiences for each of them.
With Userpilot, you can create specific in-app experiences to engage your users more. You can monitor feature engagement without having to create custom events, plus release in-app guiding experiences. You can tag any UI features to improve the tracking.

For example, you can use checklists during trials to guide new users to their activation point and increase your trial-to-paid conversion rate.
Furthermore, you can use micro surveys to gather both qualitative and quantitative customer feedback. These surveys include customer satisfaction surveys, such as NPS surveys, which we’ll talk about more later on in the article.
Micro surveys help your customer success teams understand how the product is adding value to users. The feedback allows you to reach out to users with low customer engagement scores and improve their experience to boost product engagement.
Customer Lifetime Value
Customer Lifetime Value (LTV) is the expected amount of revenue you can earn from a user over the course of the period they are a paying customer.
The easiest way to calculate LTV is to divide your average revenue per account (ARPA) by the customer churn rate.
This metric is especially valuable to companies with big customer bases and high transaction rates. On the other hand, if you have 8 customers, with only 2 enterprise-level ones, you should focus more on improving your customer acquisition rates than on LTV.

The customer lifetime value to customer acquisition cost (LTV-CAC) ratio tells you how each user’s lifetime value measures up against the amount you spent to acquire them.
Thus, when your LTV-CAC ratio is 1:1, it means you are earning just as much from a user as you spent on acquiring them. A good LTV-CAC ratio for a healthy SaaS business should be a minimum of 3:1, and never go below 1.
How to increase LTV
Increasing LTV will improve the overall profitability of your business.
Primary onboarding is very important to prevent day 1 retention and improve activation rates. However, your onboarding efforts don’t end there. Rather, onboarding is a continuous process that’s necessary at each stage of the user journey.
Secondary onboarding helps you increase your LTV by keeping users with you for as long as possible. Through secondary onboarding, you can expose users to upgrades and new product features that are relevant to them and teach them how to leverage these.
Using onboarding elements like native tooltips, checklists, and experience flows, Userpilot helps you introduce users to relevant secondary features and increase your revenue.
Furthermore, you can optimize your LTV by showing users how much you care about them. To do this, use in-app help centers, complete with elements like FAQs and knowledge bases. This would make it easier for users to solve repetitive issues by themselves instead of having to wait around for busy human agents.
As customers can address their problems faster, they are less likely to churn and more likely to increase your LTV.
Net Promoter Score
Net Promoter Score (NPS) is a measure of customer satisfaction and loyalty.
Here, you use an NPS survey to ask customers how likely they are to recommend your product to others. This question uses a scale of 1-10, with 1 being “Not Likely” and 10 being “Extremely Likely”. The higher the score, the fewer chances of churn.
Before we discuss how you can measure the NPS metric, let’s go through a few more details.
The customers who rate you 9 or 10 are called promoters. They are your most loyal customers who may even do some word-of-mouth marketing for you.
On the contrary, detractors are the customers who are dissatisfied with your product and are on the verge of churning. So, they rate you 6 or less. In between are the passives who are indifferent to your product and rate you 7 or 8.
Now, to calculate the Net Promoter Score, subtract the percentage of detractors from the percentage of promoters.

How to improve NPS score?
You can add a qualitative follow-up question to your survey to ask users the reason behind their scores.
This open-ended question allows you to understand why users are happy or unhappy with your product.
Therefore, you can capitalize on your strengths to retain loyal customers and possibly convert passives to promoters. Plus, you can improve your product experiences according to customers’ pain points and reduce churn. What’s more, a significant improvement in your product can even convert detractors to promoters.
Additionally, you can cross-reference the NPS score with other behavioral analytics to find whether detractors have discovered and adopted key features that would give them more value. You can even contact them via emails to offer help.
With a tool like Userpilot, you can segment customers based on their NPS scores and personalize your responses directly inside your product.

Customer Retention Rate
According to SaaSScout, you can boost your SaaS profits by at least 25% by retaining only 5% of your customers.
Customer retention rate gives the percentage of customers you retain over a given period. So the more users renew their subscriptions, the higher your customer retention rates.
You should always use the retention rate with the churn rate to get a full picture of the renewal rates in your company. This lets you predict your revenue streams better and guide your success teams accordingly.
To measure retention, you first need to set a time period. To get a better perspective of what’s going on in your business, you can even use more than a one-time frame, like quarterly and yearly.
The customer retention rate is equal to the number of paying customers at the end of a given period divided by the number of paying customers at the start of that period, multiplied by 100.

How to improve customer retention rate?
To improve retention, make your onboarding process better to help users keep forward in their journey.
To create a good first impression, use personalized welcome screens to keep new users engaged. As mentioned earlier, personalized onboarding can help you educate your users and drive value for them. It increases engagement and thus encourages users to stick to your product.

Moreover, the technical support you provide your users matters a lot in reducing churn.
Furthermore, being proactive is key to customer retention. To achieve this, you need to measure customer success continuously. Are users finding features they need? Are they engaging more or less with your product with time?
Product usage analytics helps you analyze in-app user activities to check whether customers are using your product successfully. This way, you can proactively address their issues before they churn.
Customer Churn Rate
The customer churn rate tells you how quickly you are losing customers. Moreover, it also helps you form your retention strategies and is thus one of the most vital product success metrics.
You can learn how and why your users are leaving and where in the funnel they’re leaving to build product experiences accordingly to reduce churn.
In this case, too, you can use several time periods to measure the churn rate. Measuring churn on a monthly, quarterly, and yearly basis can help you gain a bird’s eye view of the situation in your business.
To calculate the churn rate, divide the number of customers churned during a specific period by the number of customers at the beginning of that period, and multiply the ratio by 100.

How to reduce customer churn rate?
Your customer churn rate can never be zero. That’s impractical. Instead, you need to reach negative churn, where the revenue you earn exceeds the amount you lose from churn.
To reduce churn, you need to focus on where users experience friction so that you can make those areas as frictionless as possible.
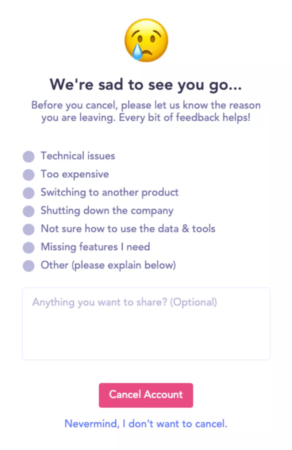
Churn surveys are great for understanding why users don’t want to stay or downgrade. In-app churn surveys not only let you know why a user left but also help them change their minds by showing what they’ll miss out on.
You can even automate personalized responses based on their reasons. For instance, you can give them an option to pause their account instead of canceling it entirely.
If you use an MCQ-based churn survey, you can add an open-ended optional question in the end for users to share any other reasons they may have.
Wrapping it up
Now that you know all the critical product success metrics, you need to action on all these valuable insights! Constantly developing and updating your product success strategy is key if you want to achieve product success.
Want to start driving product success with personalized onboarding experiences, code-free? Get a Userpilot demo and we’ll show you how!

