Network Diagramming with CardBoard
Mapping out your network and all the elements it interacts with can be done using networking diagram and digital whiteboard tool like CardBoard. Here’s an in-depth look at network diagrams and how you can build your own in CardBoard today.
What is a network diagram?
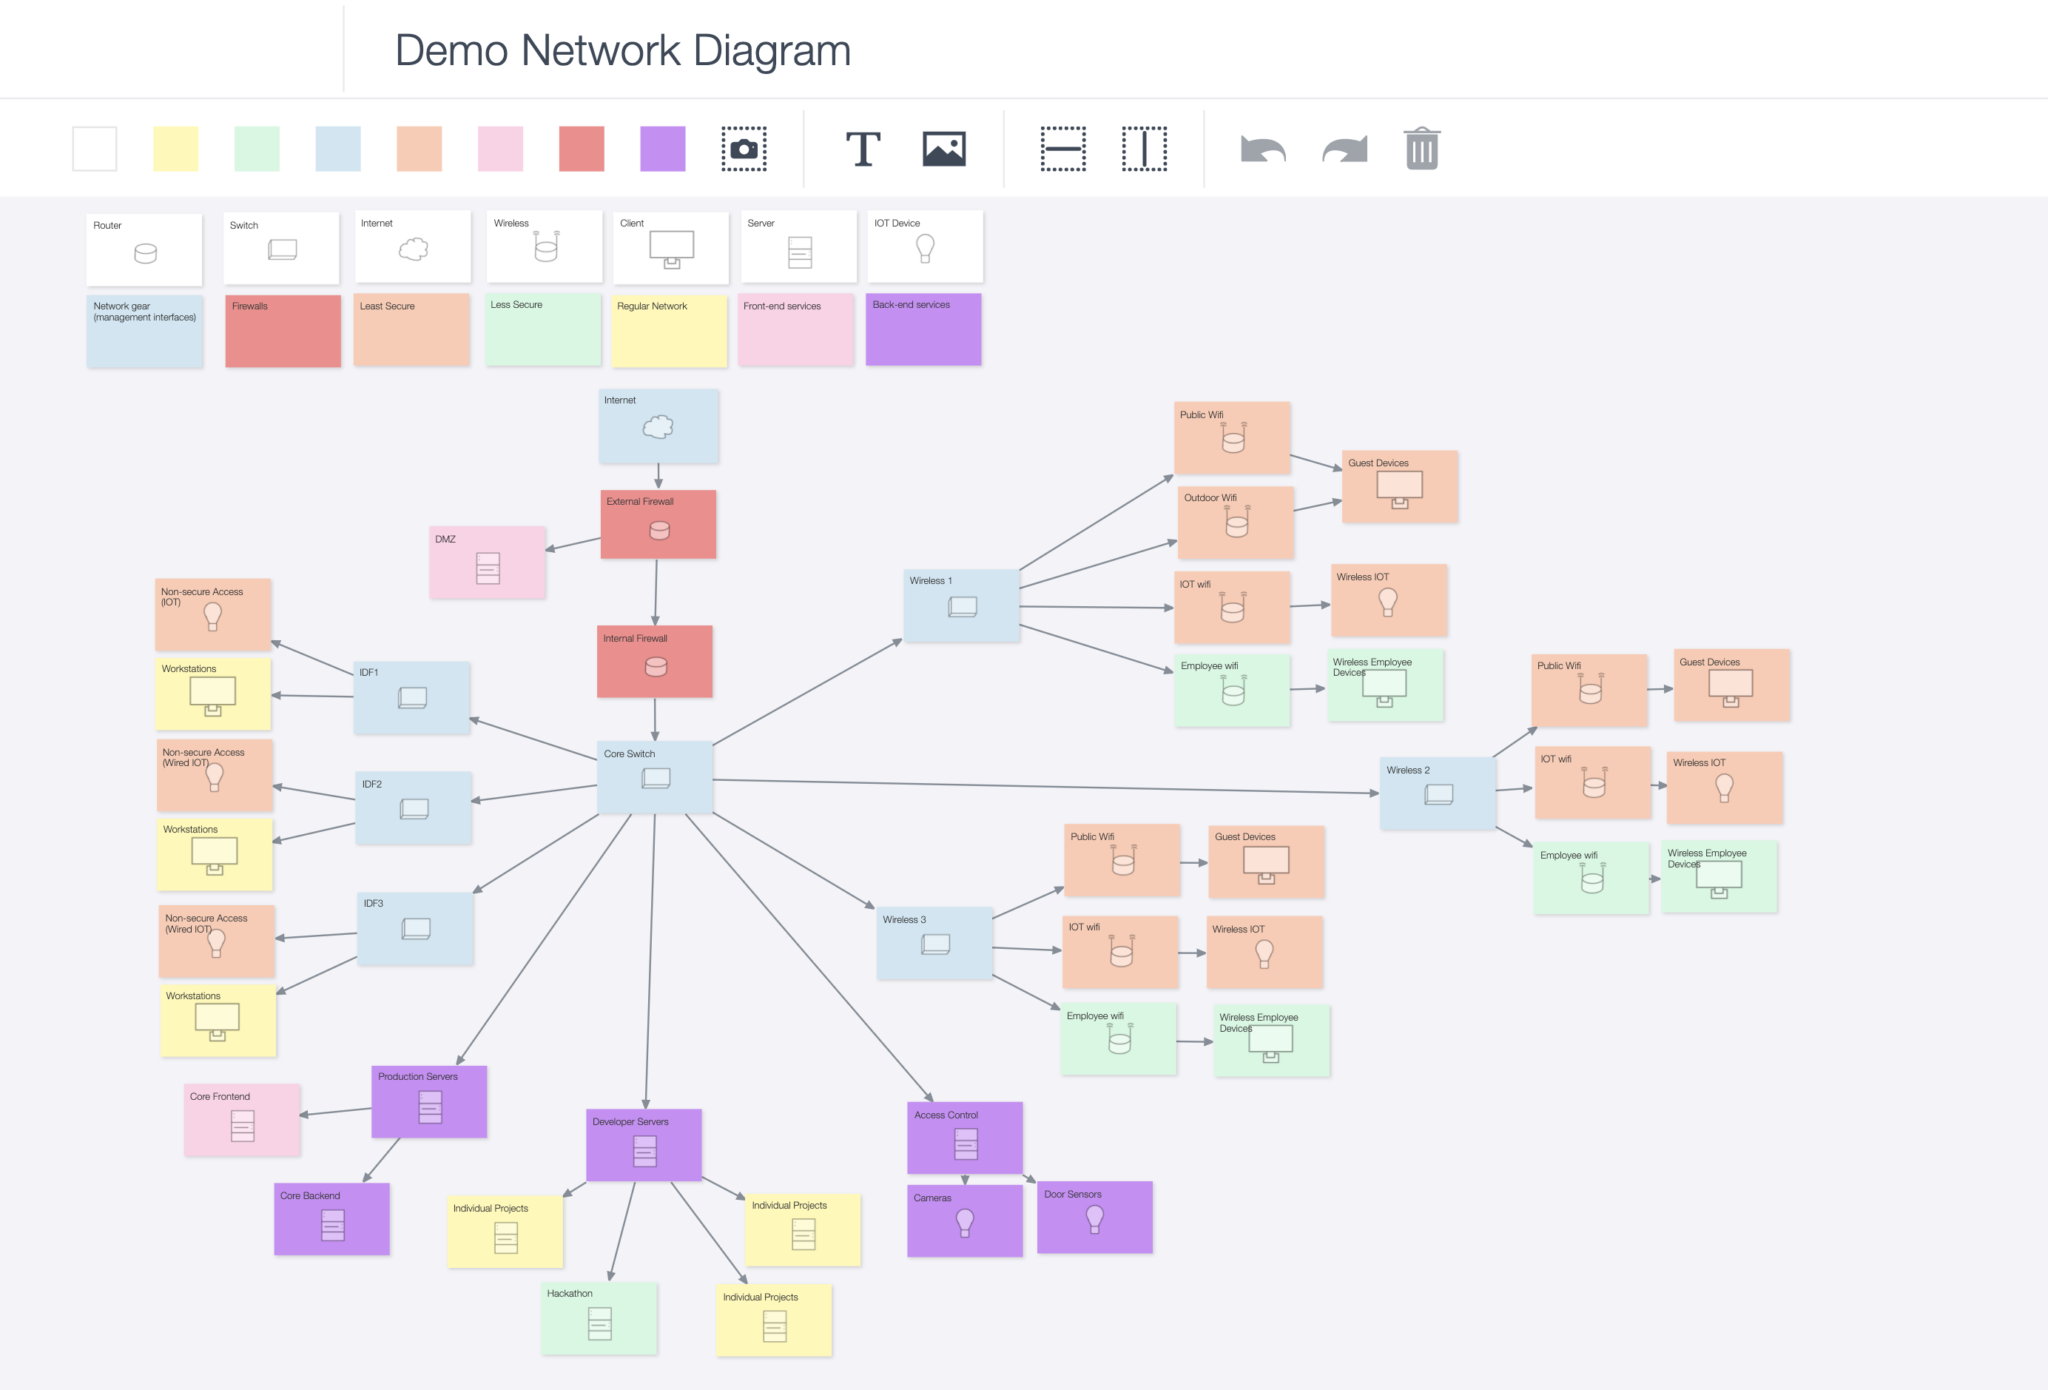
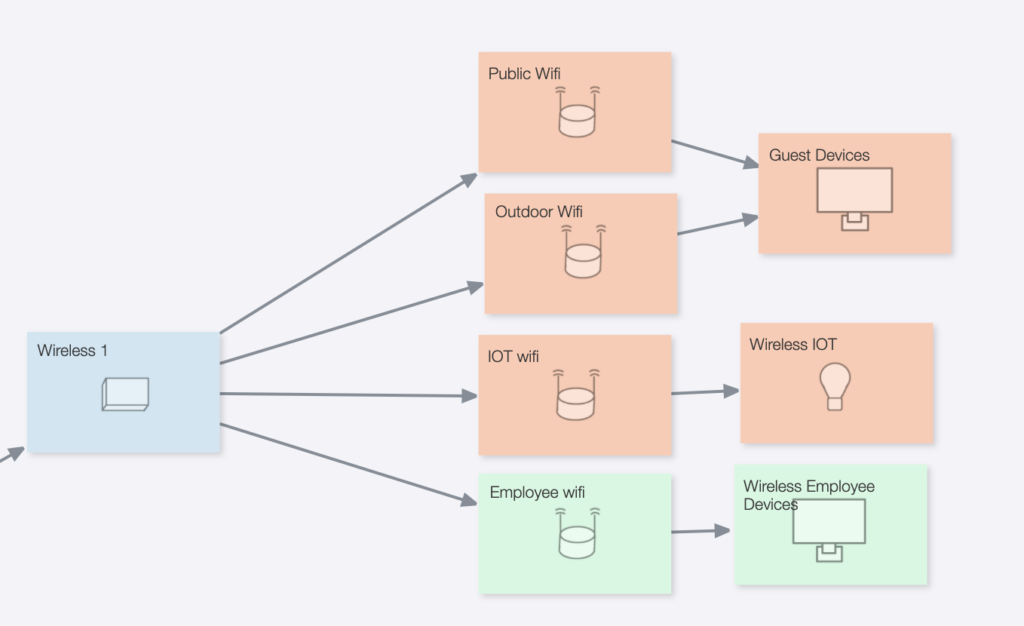
A network diagram is a visual representation of a computer or telecommunications network. It shows the elements that make up networks and how they interact. This includes devices, firewalls, routers, etc.
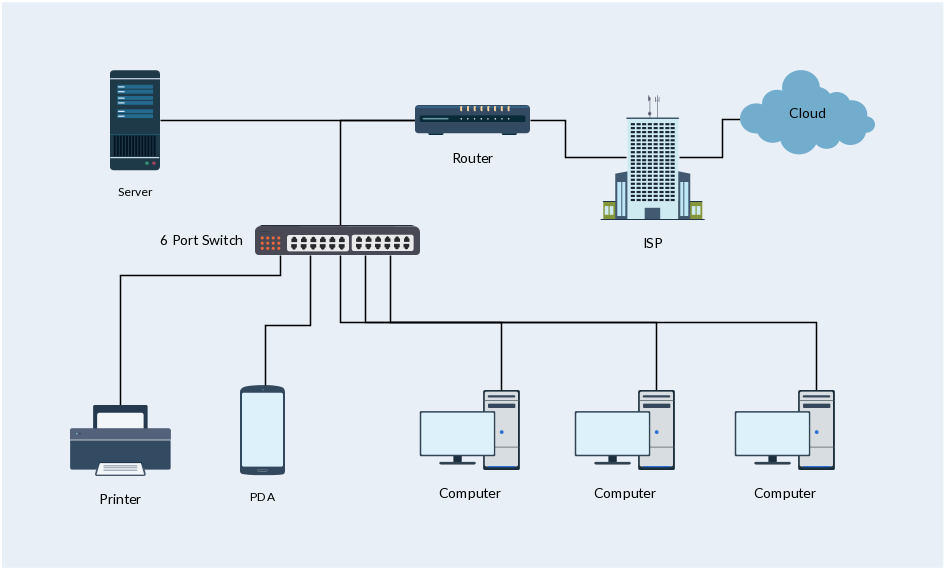
Here is a local area network (LAN) example:
How are they used?
By showing how network components connect and interact with each other, a network diagram serves a variety of purposes:
- Planning the setup of a home or professional network
- Updating existing networks
- Send info to vendors for an RFP without sharing confidential information
- Documentation for onboarding and external communication
- Troubleshoot network problems
- Comply with PCI or other requirements
- Selling network proposal to financial stakeholders
- Keep track of components
- Propose syslog infrastructure changes
How to make a network diagram
Before you start making a diagram, make sure you have a clear goal in mind. It’s better to create multiple diagrams, each capturing a different aspect of the network, than it is to try to cram all the information onto one diagram.
Once you’ve selected a network to map, follow these steps to produce a beautiful, useful network diagram in CardBoard.
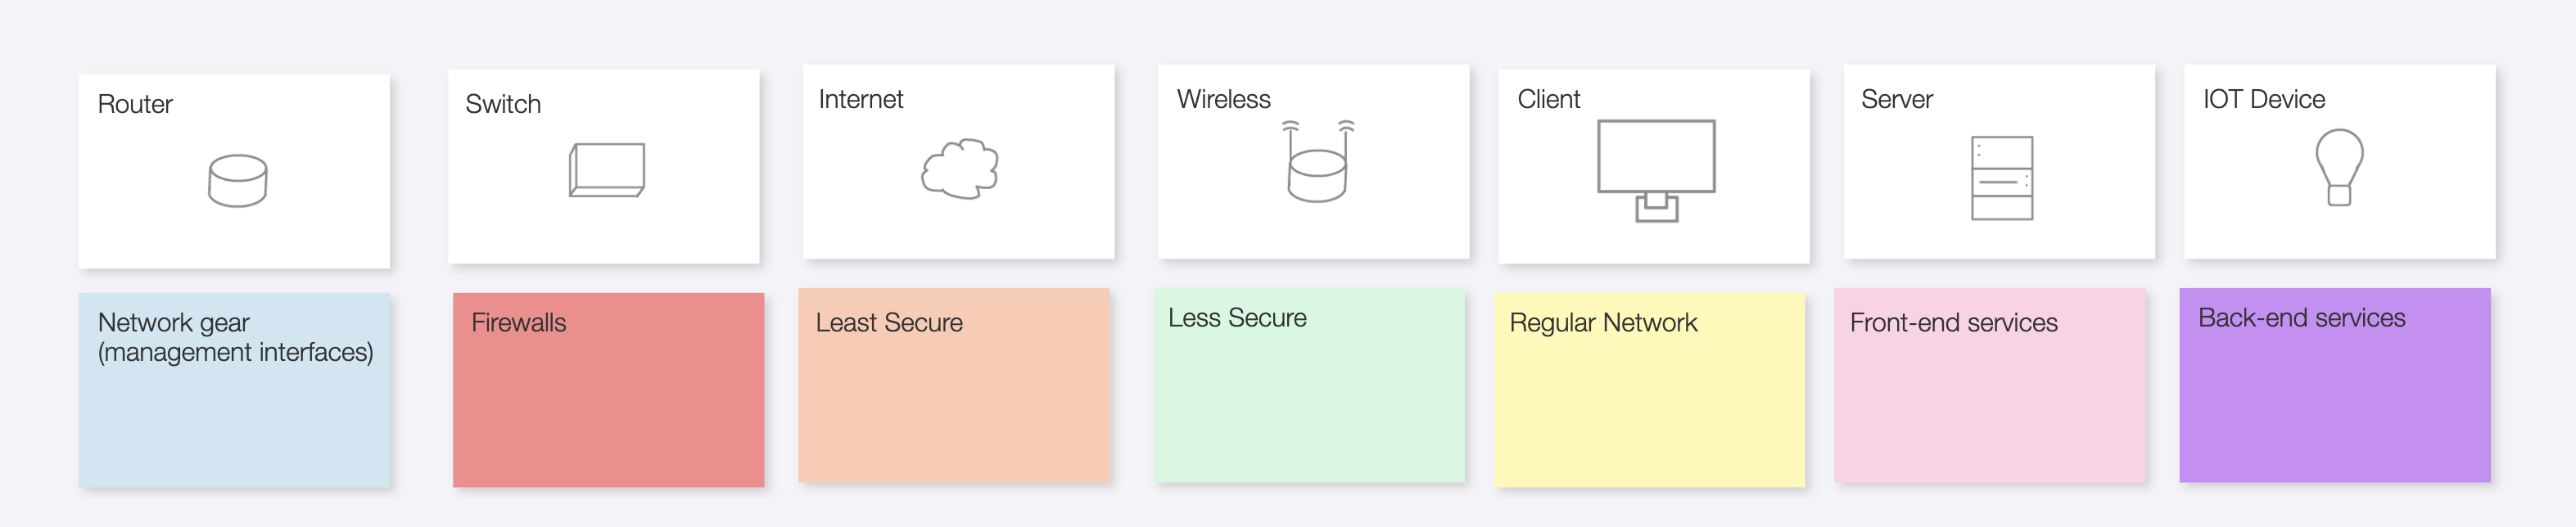
- Identify the equipment. List all the workstations, servers, routers, firewalls, and other components that are part of the network. We will worry about connecting them later. If you’re using CardBoard, you can accomplish this by simply dragging cards onto the canvas and using custom annotations to label.
- Group the cards. To begin arranging your diagram, move related cards closer to one another. Cards may be related either logically or physically, depending on what kind of diagram you’re drawing.
- Add connections. A line between two shapes shows that they are connected, typically by the flow of information.
- Label. Include any additional information about each shape that you consider useful to your audience. You may choose to place that information next to each component or to number the components, then add additional info in a legend.
- Final formatting. Adjust the placement, size, color, and other attributes of your diagram elements until you’re satisfied.
Other tips for network diagramming in CardBoard by Sam Ess – JR IT Janitor for SEP
- Use a freeform canvas so that it doesn’t snap to grid,
- make sure you have your arrows pointing in consistent directions (down from the cloud, or up into the cloud)
- Add custom annotations to identity cards
- Use different colors of cards to show categories of devices or VLANS
“From start to finish, it took less than two hours. Compared to YEd or Visio, it’s easier to share, and simpler to use” – Sam Ess
Didn’t find what you need? Visit our Help Center to find answers or get in contact with our team.
Ready to try CardBoard for yourself? Sign up to start your 14 day free trial!