Remove 2016 Remove Analytic Tools Remove Demo Remove Testing
article thumbnail

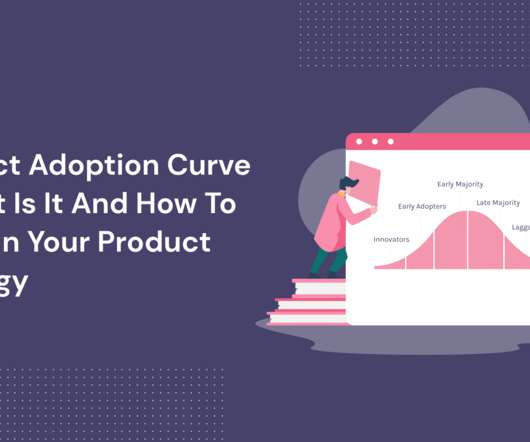
The Product Adoption Curve in SaaS: What Is It and How To Use It In Your Product Strategy

Userpilot

How to improve product adoption for your SaaS at each stage of the Product Adoption Curve. The best Product Adoption tools. They’re technology enthusiasts and are usually quite technical. He’s an electrical engineer living in a bachelor pad littered with all kinds of new technological inventions and contraptions.

article thumbnail

Citrix Troubleshooting 101: Frequently Asked Questions

eG Innovations

Citrix Virtual Apps and Desktops deployments are performance sensitive. There are many components both datacenter-side and client-side which must be optimally performing together to deliver a consistent and performing virtualized apps and desktops solution. Windows 2016. We have XenApp 6.5/XenApp XenApp 7.6,

Insiders

Sign Up for our Newsletter

This site is protected by reCAPTCHA and the Google Privacy Policy and Terms of Service apply.

article thumbnail

Concept Testing Examples and Methods for SaaS

Userpilot

What is concept testing and how can it help accelerate your product-led growth ? In this article, we’ll go over some concept testing examples from some of the best B2B and B2C brands to help you get started with your strategy. Airbnb failed to concept test its logo and faced ridicule due to its design.

article thumbnail

A Year in Product – The Greatest Product Growth & Adoption Trends of 2020 & for 2021

Userpilot

Analytics & Experimentation. Proactive onboarding means you proactively lead a user to an outcome, while reactive – that you only respond to their actions in-app. Building your own product adoption tools can set you back a lot of money. Trends to Watch In Product – Table of Contents.

article thumbnail

24 Essential Types of Charts for Data Visualization: Examples & Use Cases

Userpilot

TL;DR Funnel charts are excellent tools for visualizing how data flows through a funnel. It is also a great tool for finding outliers. Bar charts are excellent numeric comparison tools, with bar sizes revealing the relative difference in sizes. Analyzing event distribution over multiple platforms. A vertical bar chart.

article thumbnail

How to Apply a Design Sprint to Voice-Based Products

Mind the Product

I believe the answer is to use a test-and-learn approach to create a minimum lovable product (MLP) product – or the version of a new product a business can launch to create customer love with the least amount of effort and expense. The test-and-learn approach my colleagues at Moonshot and I use is an adaptation of the Design Sprint.

article thumbnail

4 Mind-blowing Things Data Can Tell Us About the Future of Food Delivery

Indicative

Technology has made it easier than ever to get restaurant-made food on demand. The foodservice industry is still rapidly evolving and learning to leverage customer data analytics to better cater to the ways we want our food. Your food delivery apps already know your weird ordering habits. Well, your food ordering app does.