Remove benchmarks
article thumbnail

Travel Apps: 2022 Mobile Customer Engagement Benchmarks

Alchemer Mobile

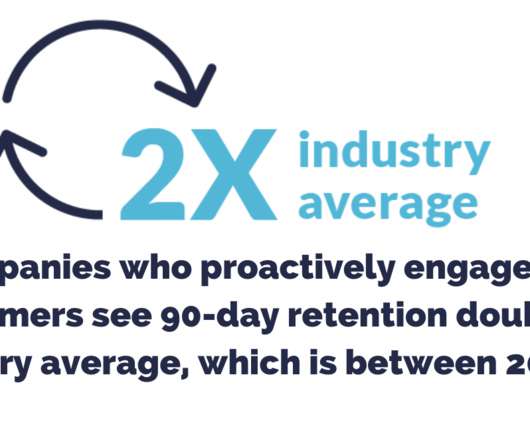
The Auto subcategory experiences less volatility in 2020, and saw 2021 benchmarks in-line with the year prior as a result. DOWNLOAD THE FULL 2022 BENCHMARK REPORT HERE. Retention benchmarks for Travel apps were up from 2020 throughout the year: 30-day was 51%, 90-day was 46%, and annual was 33%. Expressed customer emotion.

Travel 261
article thumbnail

Utilities Apps: 2022 Mobile Customer Engagement Benchmarks

Alchemer Mobile

DOWNLOAD THE FULL 2022 BENCHMARK REPORT HERE. Engagement benchmarks for interactions and responses in Utilities were impressive, with an average interaction rate of 40% (26% overall) and an average response rate of 96% (91% overall). Additional visual benchmark data for Utilities apps. ?DOWNLOAD Shifted emotions by subcategory.

Insiders

Sign Up for our Newsletter

This site is protected by reCAPTCHA and the Google Privacy Policy and Terms of Service apply.

Trending Sources

article thumbnail

Healthcare Apps: 2022 Mobile Customer Engagement Benchmarks

Alchemer Mobile

In our 2022 Mobile Customer Engagement Benchmark Report , a study of more than 1,000 apps across a billion mobile app installs, we take a close look at apps in the Healthcare category. DOWNLOAD THE FULL 2022 BENCHMARK REPORT HERE. While retention in Healthcare was lower than overall benchmarks, there were year-over-year improvements.

article thumbnail

Personal Services Apps: 2022 Mobile Customer Engagement Benchmarks

Alchemer Mobile

Rather than comparing by benchmark, below is a short summary of both the Home and Family apps included in our data. DOWNLOAD THE FULL 2022 BENCHMARK REPORT HERE. Home apps: Mobile customer engagement benchmarks. The average response rate in Home was also above the overall benchmark at 92% (91% overall).

article thumbnail

Understanding User Needs and Satisfying Them

Speaker: Scott Sehlhorst

Industry expert Scott Sehlhorst will: Introduce a taxonomy for user goals with real world examples Present the Onion Diagram, a tool for contextualizing task-level goals Illustrate how customer journey maps capture activity-level and task-level goals Demonstrate the best approach to selection and prioritization of user-goals to address Highlight the (..)

article thumbnail

Business Services Apps: 2022 Mobile Customer Engagement Benchmarks

Alchemer Mobile

DOWNLOAD THE FULL 2022 BENCHMARK REPORT HERE. Engagement benchmarks around interaction and response rates were high, with Business Services apps boasting an average interaction rate of 51% (26% overall) and an average response rate of 93% (91% overall). Additional visual benchmark data for Business Services apps. ?DOWNLOAD

article thumbnail

Media Apps: 2022 Mobile Customer Engagement Benchmarks

Alchemer Mobile

Rather than a benchmark comparison, below is a short summary of the six subcategories included in our data: News, Telco, Technology, Games, Sports, and Music. DOWNLOAD THE FULL 2022 BENCHMARK REPORT HERE. Visual benchmark data for Media apps. ?DOWNLOAD DOWNLOAD THE FULL 2022 BENCHMARK REPORT HERE. Shifted emotions.

article thumbnail

4 Steps to Product-Led Growth

According to survey data from the 2022 Product Benchmark report, product-led companies are more than twice as likely to grow quickly (100%+ year-over-year revenue growth) than sales-led companies, especially those offering a freemium product.

article thumbnail

A PM's Guide to Building a Culture of Product Innovation

Speaker: Bob Webber, VP Product Flow Optimization, Construx

Attend this webinar to benchmark your organization’s innovation potential and learn what it takes to create a culture of innovation. 10 questions to benchmark your organization's level of innovation and identify areas for improvement. Innovation advice will not work if your company's culture does not encourage it.

article thumbnail

2020 Database Strategies and Contact Acquisition Survey Report

Database benchmarks for education and resource prioritization. Insights detailed within this report include: Tools marketers are using to gain deeper intelligence on current and prospective customers for better targeting and messaging. New tactics to acquire data to reach marketing goals.

article thumbnail

Optimize Your Product Team to Win in the Market

Download 280 Group’s Global Product Management Skills Benchmark Report to learn how skill improvement yields faster results on optimizing your product function. Accenture’s Return on Learning study reported that training can yield an impressive 353% ROI through skills improvement.

article thumbnail

How to Get Promoted – Climbing the Product Management Ranks

According to 280 Group’s Global Product Management Skills Benchmark Report, certain skills directly impact your career trajectory, and therefore, your earning potential. While there are more than 41,000 Product Managers currently employed in the U.S. today, only a scant group will move up the ranks to achieve that coveted leadership level.

article thumbnail

The ABM Benchmark Survey

ABM gets better with age — but unfortunately, marketers don't have the luxury of pouring it into an oak barrel for a couple decades to let it mature.

article thumbnail

Trends and Benchmarks in Product Management 2020 Global Report

A comprehensive global report on Product Management with over 70 graphs based on a survey of over 2000 product professionals. Insights from topics: Leadership and Culture| People|Organization|Salaries |Process and Product

article thumbnail

Just launched! 2020 Customer Education Benchmarks and Trends Report

Based on a survey of more than 250+ external education teams, Skilljar has compiled this report on current trends including budgets, integrations, team structure, and more. In this report, see how companies across a variety of industries are building, optimizing, and measuring their training programs.